The same plot in 14 other libraries — Python: Altair, Bokeh, lets-plot, Matplotlib, Plotly, plotnine, Pygal, Seaborn; Julia: Makie.jl; JavaScript: Chart.js, D3.js, Apache ECharts, Highcharts, MUI X Charts. Compare all 15 side by side: Basic Quiver Plot in Python, R, Julia and JavaScript.
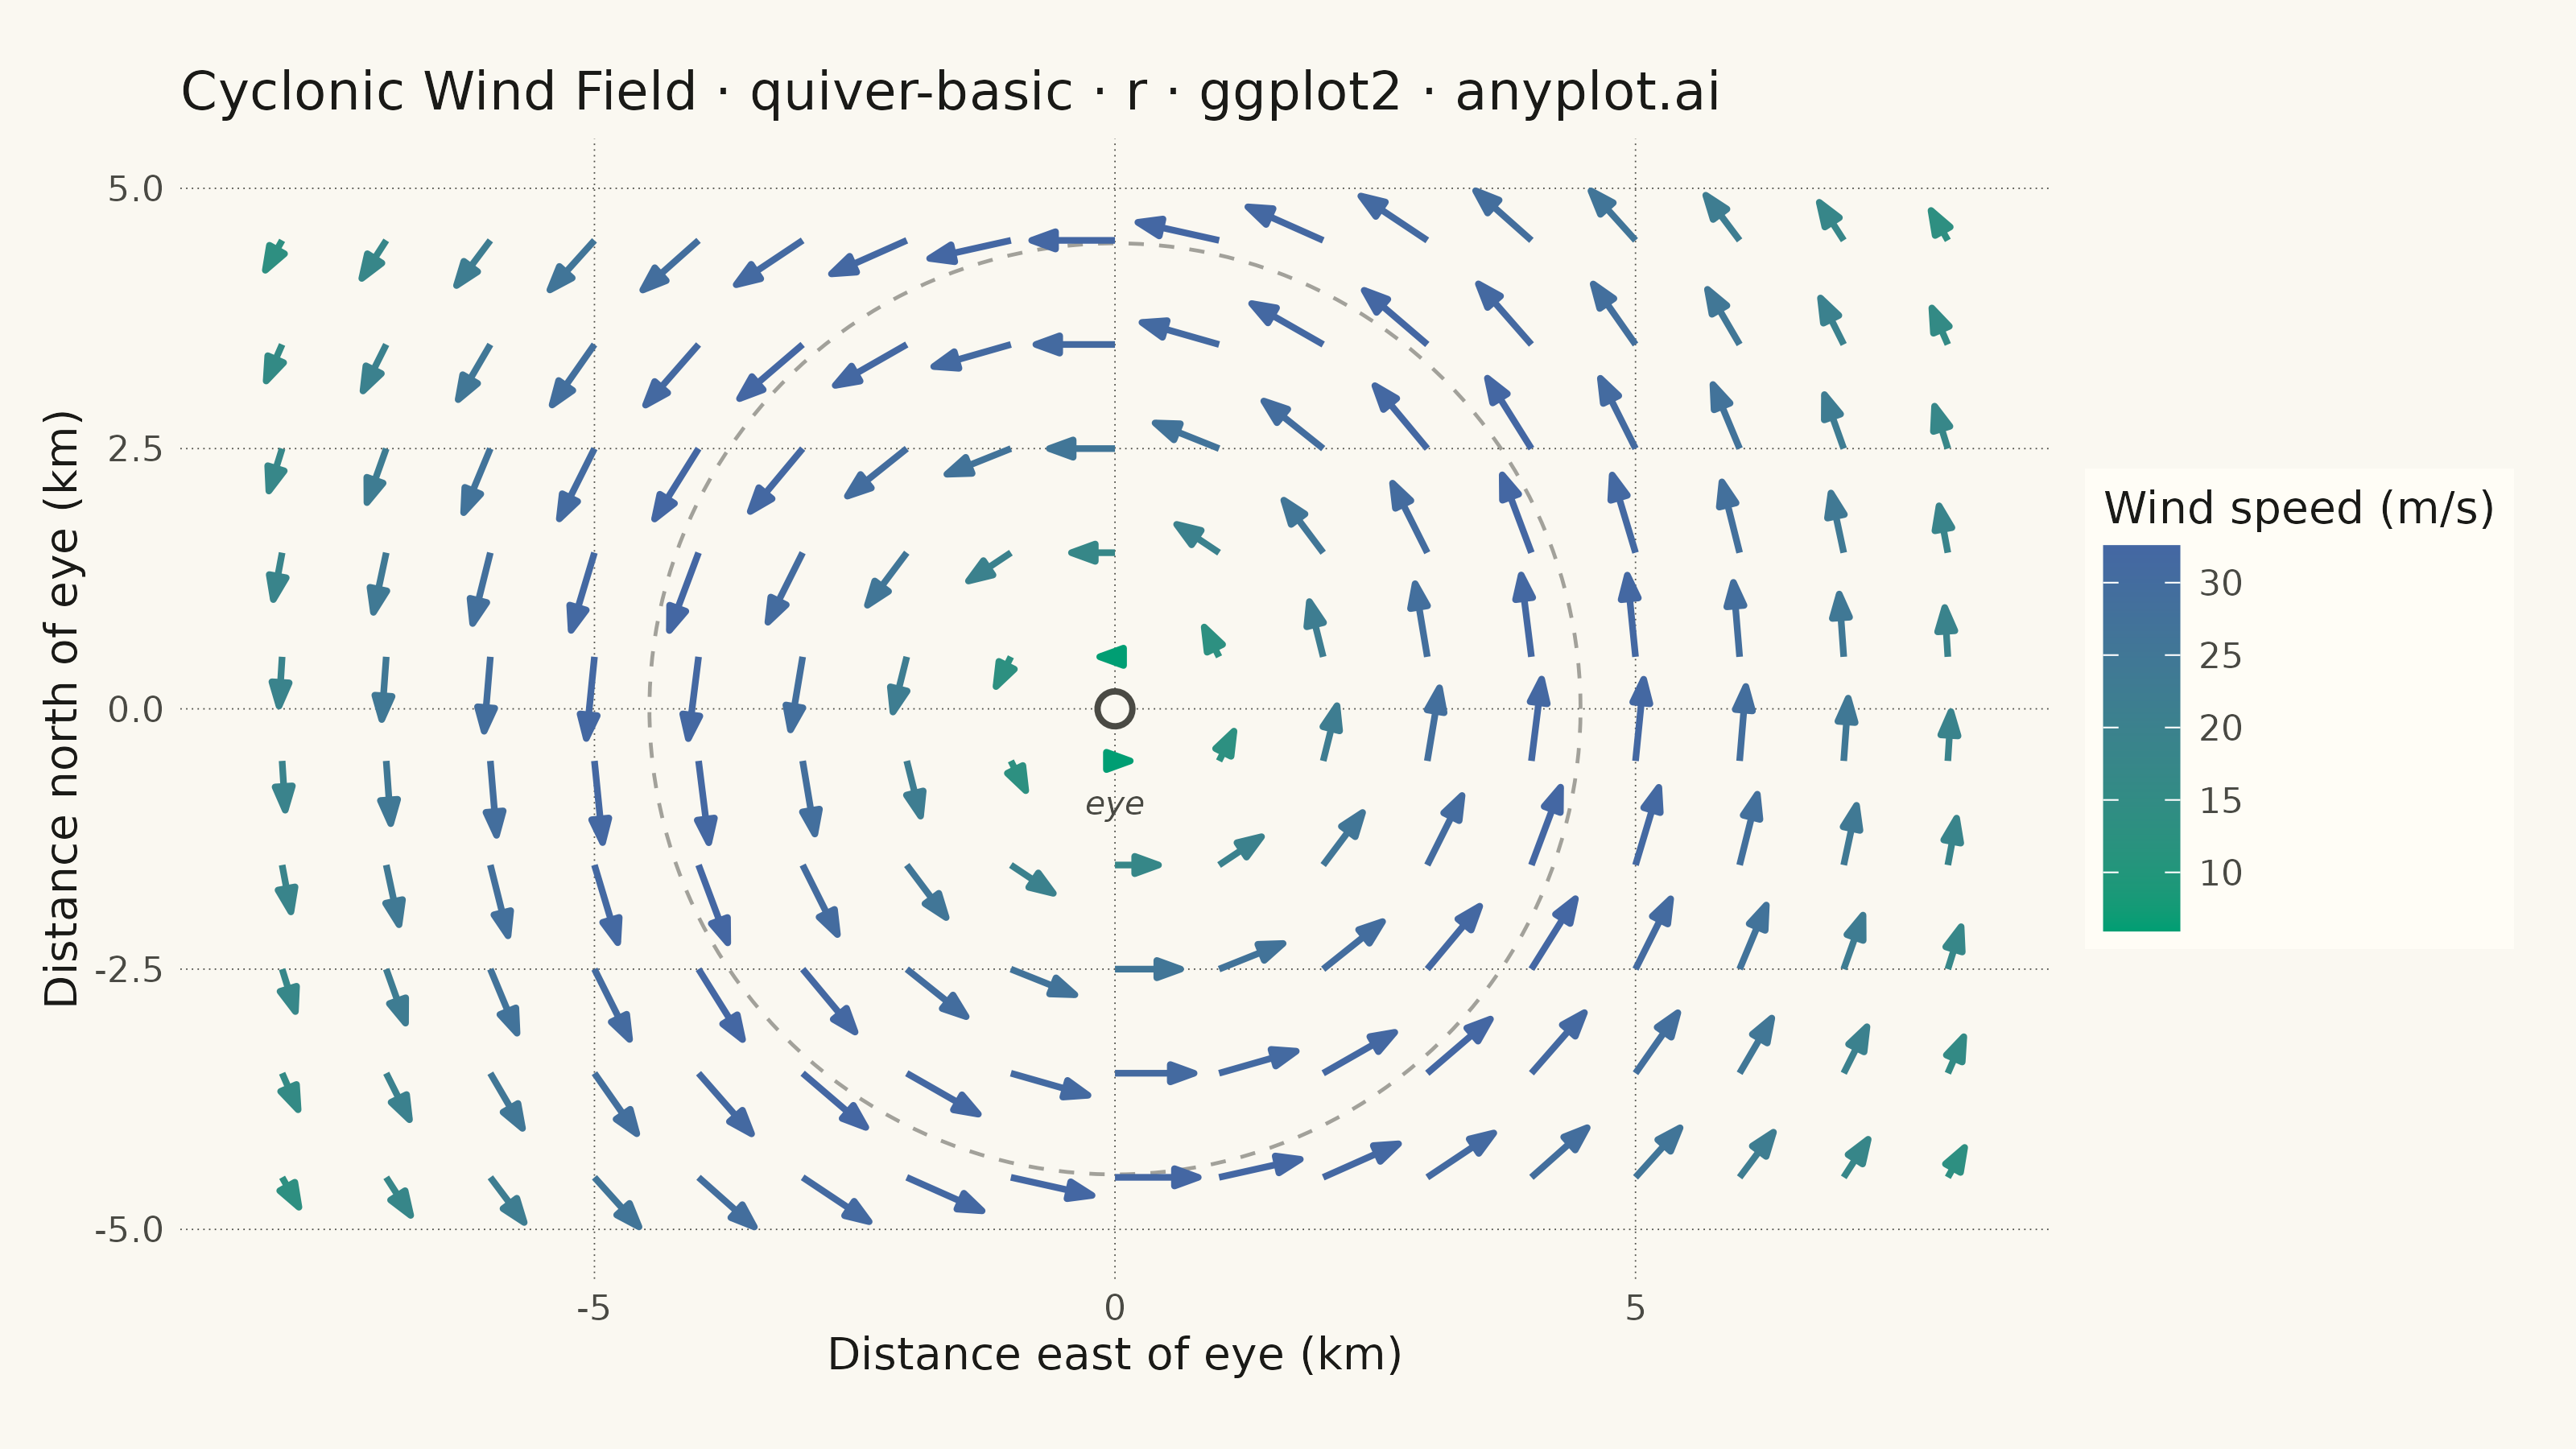
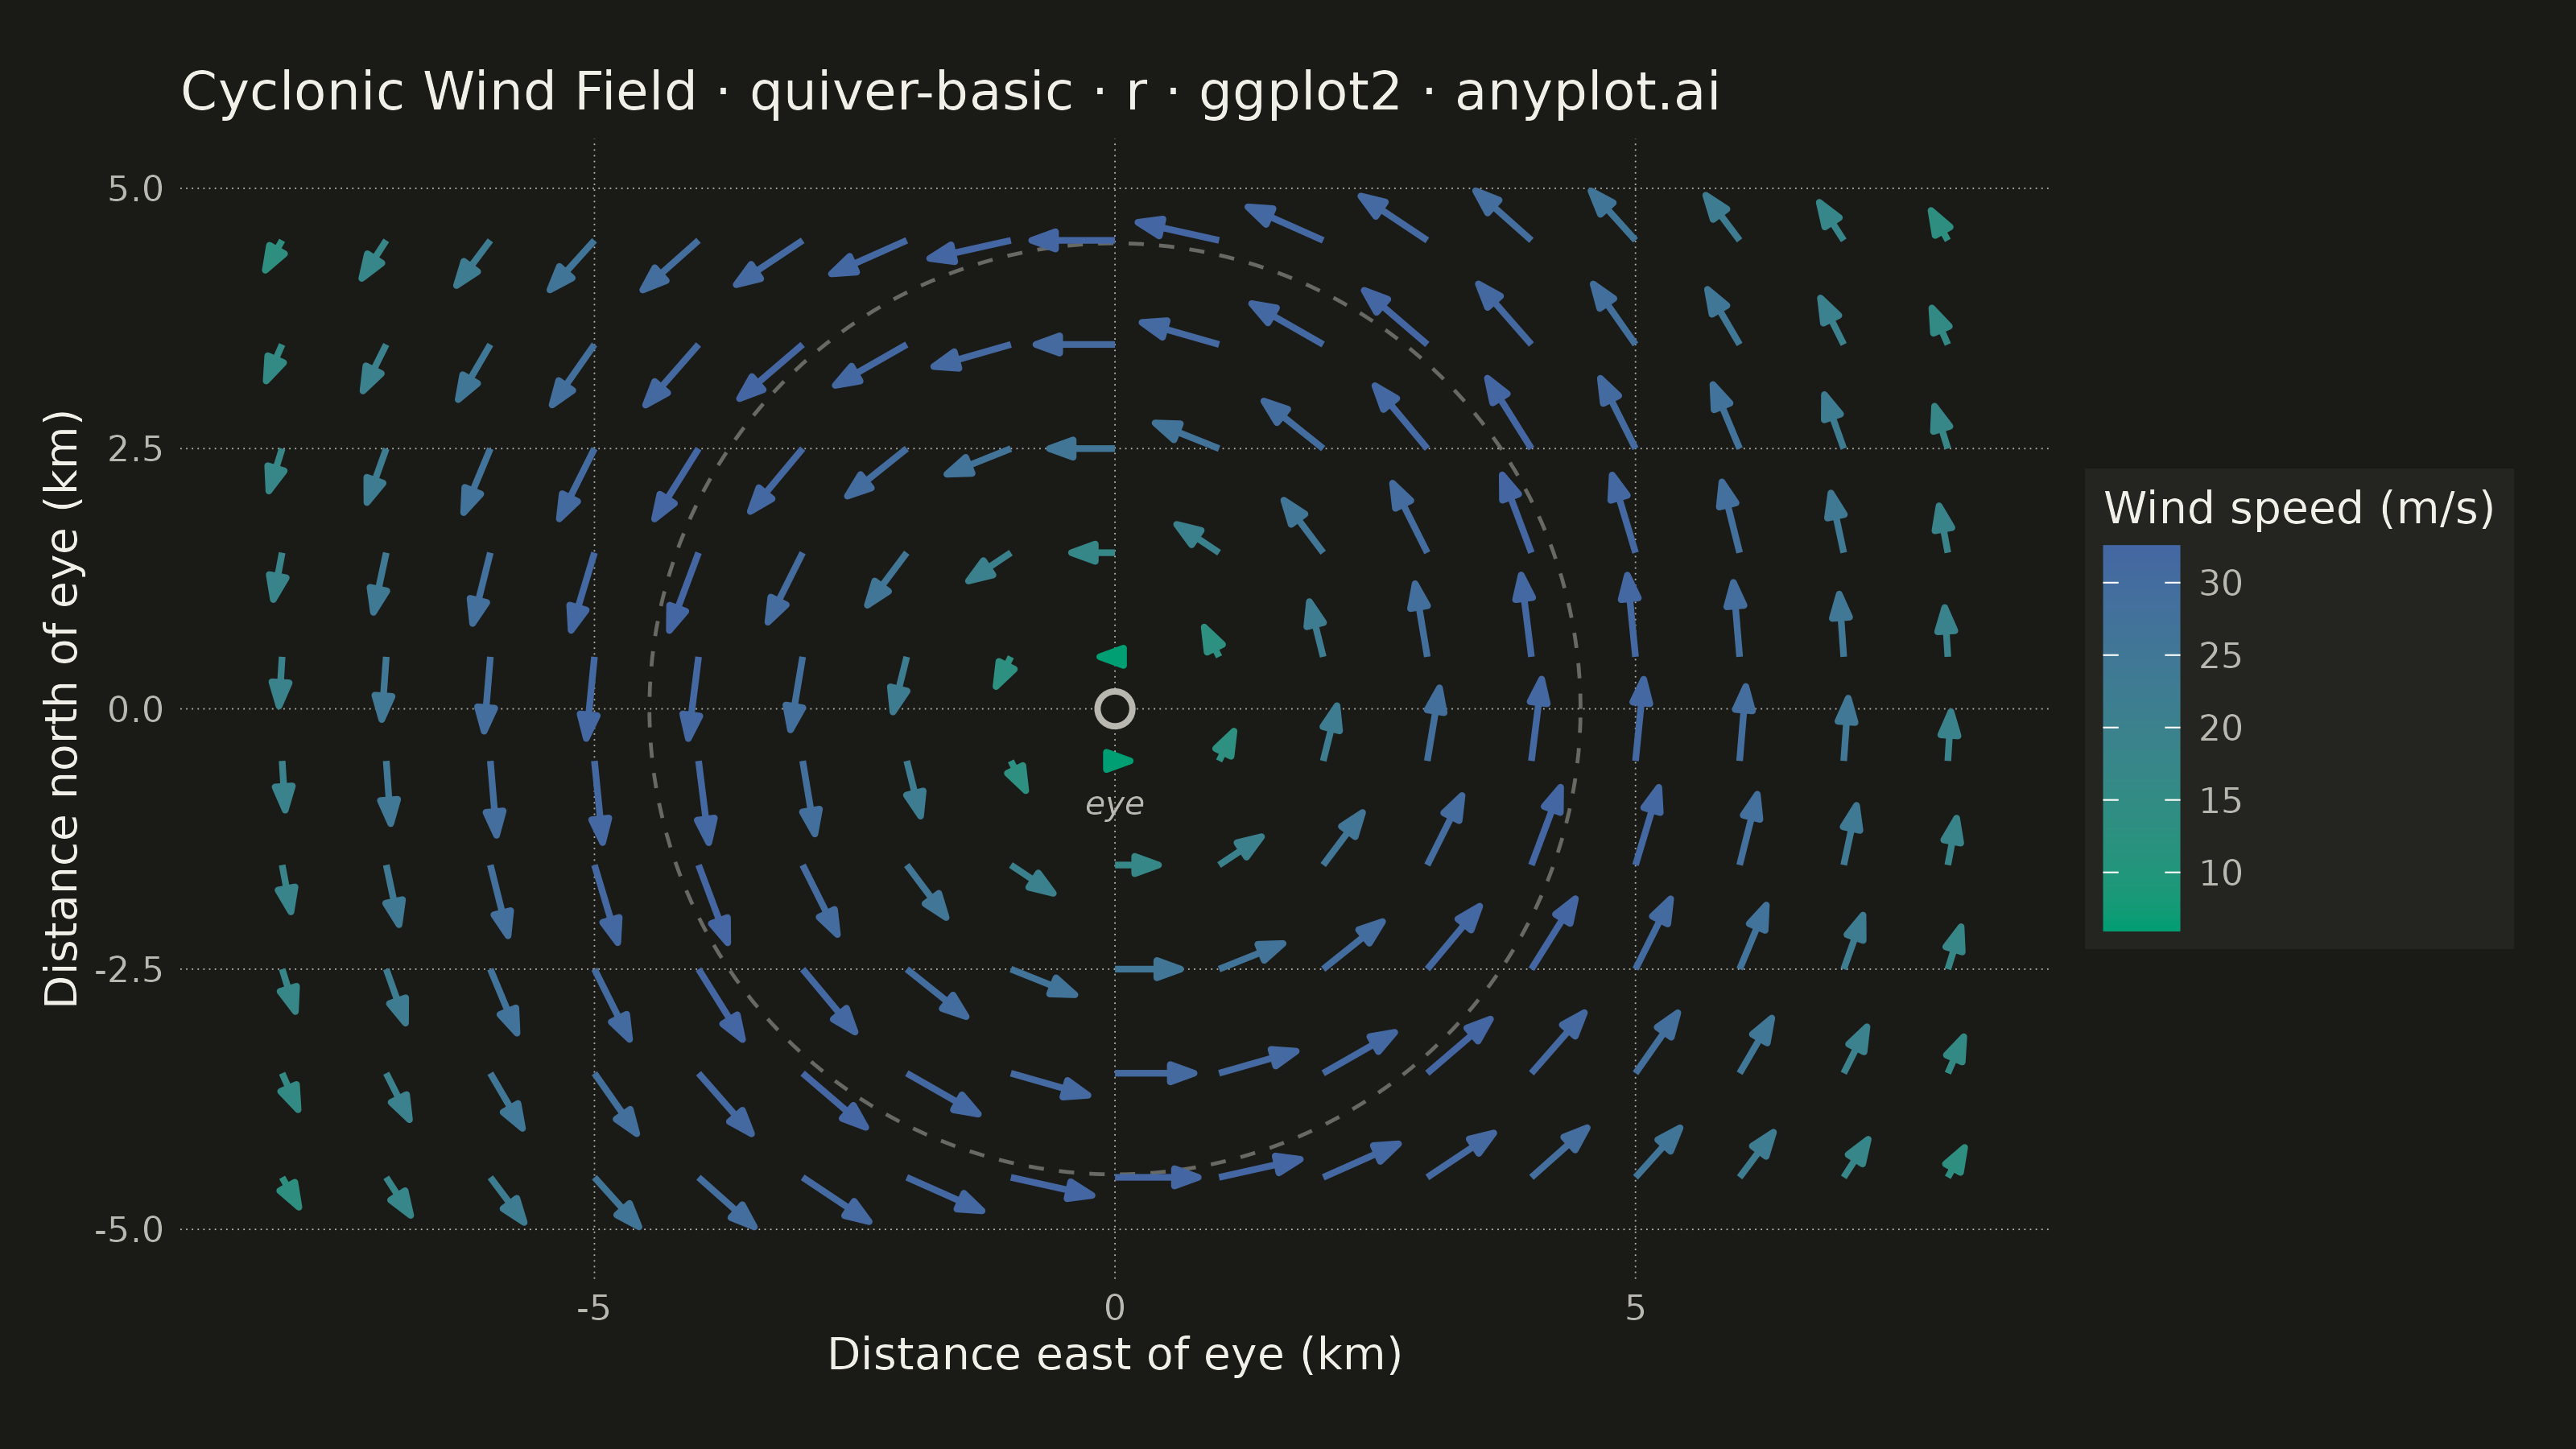
A quiver plot displays vector fields using arrows positioned at grid points. Each arrow represents a vector at that location, with direction indicating the vector's angle and length proportional to its magnitude. This visualization reveals flow patterns, gradients, and field structure in two-dimensional data.
#' anyplot.ai
#' quiver-basic: Basic Quiver Plot
#' Library: ggplot2 3.5.1 | R 4.4.1
#' Quality: 92/100 | Created: 2026-07-24

library(ggplot2)
library(dplyr)
library(tidyr)
library(ragg)

set.seed(42)

# --- Theme tokens -------------------------------------------------------
THEME       <- Sys.getenv("ANYPLOT_THEME", "light")
PAGE_BG     <- if (THEME == "light") "#FAF8F1" else "#1A1A17"
ELEVATED_BG <- if (THEME == "light") "#FFFDF6" else "#242420"
INK         <- if (THEME == "light") "#1A1A17" else "#F0EFE8"
INK_SOFT    <- if (THEME == "light") "#4A4A44" else "#B8B7B0"

# Imprint sequential cmap (single-polarity: wind speed magnitude)
IMPRINT_SEQ_LOW  <- "#009E73"
IMPRINT_SEQ_HIGH <- "#4467A3"

# --- Data: cyclonic wind field around a low-pressure eye ----------------
# Rotational flow (u = -y, v = x) modulated by a radial Gaussian decay so
# speed peaks in a ring around the calm eye and fades toward the outskirts.
# WIND_SCALE converts the unitless rotation field into storm-force m/s so the
# "Cyclonic" framing matches the numbers on the legend (peak ~34 m/s, low-end
# Category 1 hurricane strength).
WIND_SCALE <- 12
grid <- expand_grid(
    x = seq(-8, 8, by = 1),
    y = seq(-4.5, 4.5, by = 1)
)

wind <- grid %>%
    mutate(
        radius = sqrt(x^2 + y^2),
        decay  = exp(-radius^2 / 40),
        u      = -y * decay * WIND_SCALE,
        v      = x * decay * WIND_SCALE,
        speed  = sqrt(u^2 + v^2)
    )

# Scale arrow length so the fastest vector spans ~80% of the 1-unit grid
# spacing, keeping neighbouring arrows from overlapping.
arrow_scale <- 0.8 / max(wind$speed)
wind <- wind %>%
    mutate(
        xend = x + u * arrow_scale,
        yend = y + v * arrow_scale
    )

# Dashed radial guide marking the ring of peak tangential wind speed, i.e.
# the radius that maximises r * exp(-r^2/40) (found analytically at r = sqrt(20)).
eyewall_radius <- sqrt(20)
eyewall_theta  <- seq(0, 2 * pi, length.out = 200)
eyewall <- tibble::tibble(
    x = eyewall_radius * cos(eyewall_theta),
    y = eyewall_radius * sin(eyewall_theta)
)

# --- Plot ----------------------------------------------------------------
p <- ggplot(wind, aes(x = x, y = y, xend = xend, yend = yend, color = speed)) +
    geom_path(
        data = eyewall, aes(x = x, y = y), inherit.aes = FALSE,
        linetype = "dashed", linewidth = 0.4, color = INK_SOFT, alpha = 0.5
    ) +
    geom_segment(
        linewidth = 0.7,
        arrow = arrow(length = unit(2, "mm"), type = "closed", angle = 20)
    ) +
    annotate(
        "point", x = 0, y = 0,
        shape = 21, size = 3, stroke = 1, color = INK_SOFT, fill = PAGE_BG
    ) +
    annotate(
        "text", x = 0, y = -0.9, label = "eye",
        color = INK_SOFT, size = 2.6, fontface = "italic"
    ) +
    coord_fixed(ratio = 1, expand = TRUE) +
    scale_color_gradient(
        low = IMPRINT_SEQ_LOW, high = IMPRINT_SEQ_HIGH,
        name = "Wind speed (m/s)"
    ) +
    labs(
        x = "Distance east of eye (km)",
        y = "Distance north of eye (km)",
        title = "Cyclonic Wind Field · quiver-basic · r · ggplot2 · anyplot.ai"
    ) +
    theme_minimal(base_size = 8) +
    theme(
        plot.background    = element_rect(fill = PAGE_BG, color = PAGE_BG),
        panel.background   = element_rect(fill = PAGE_BG, color = NA),
        panel.grid.major   = element_line(color = INK_SOFT, linewidth = 0.15, linetype = "dotted"),
        panel.grid.minor   = element_blank(),
        axis.title         = element_text(color = INK, size = 10),
        axis.text          = element_text(color = INK_SOFT, size = 8),
        axis.ticks         = element_blank(),
        plot.title         = element_text(color = INK, size = 12),
        legend.background  = element_rect(fill = ELEVATED_BG, color = NA),
        legend.text        = element_text(color = INK_SOFT, size = 8),
        legend.title       = element_text(color = INK, size = 10),
        legend.key         = element_rect(fill = PAGE_BG, color = NA),
        plot.margin        = margin(10, 14, 10, 10)
    )

# --- Save ------------------------------------------------------------------
ggsave(
    filename = sprintf("plot-%s.png", THEME),
    plot     = p,
    device   = ragg::agg_png,
    width    = 8,
    height   = 4.5,
    units    = "in",
    dpi      = 400
)
Runnable source as JSON, for any HTTP client: https://api.anyplot.ai/specs/quiver-basic/ggplot2/code. Any spec id and library id listed in llms-full.txt fit the same URL shape; every URL below is complete and callable.
{
  "spec_id": "quiver-basic",
  "language": "r",
  "library": "ggplot2",
  "page": "https://anyplot.ai/quiver-basic/r/ggplot2",
  "hub": "https://anyplot.ai/quiver-basic",
  "code_json": "https://api.anyplot.ai/specs/quiver-basic/ggplot2/code",
  "spec_json": "https://api.anyplot.ai/specs/quiver-basic",
  "render_light_png": "https://storage.googleapis.com/anyplot-images/plots/quiver-basic/r/ggplot2/plot-light.png",
  "render_dark_png": "https://storage.googleapis.com/anyplot-images/plots/quiver-basic/r/ggplot2/plot-dark.png",
  "quality_score": 92.0,
  "license": "MIT",
  "guide": "https://anyplot.ai/llms.txt"
}
Part of Basic Quiver Plot on anyplot.ai.