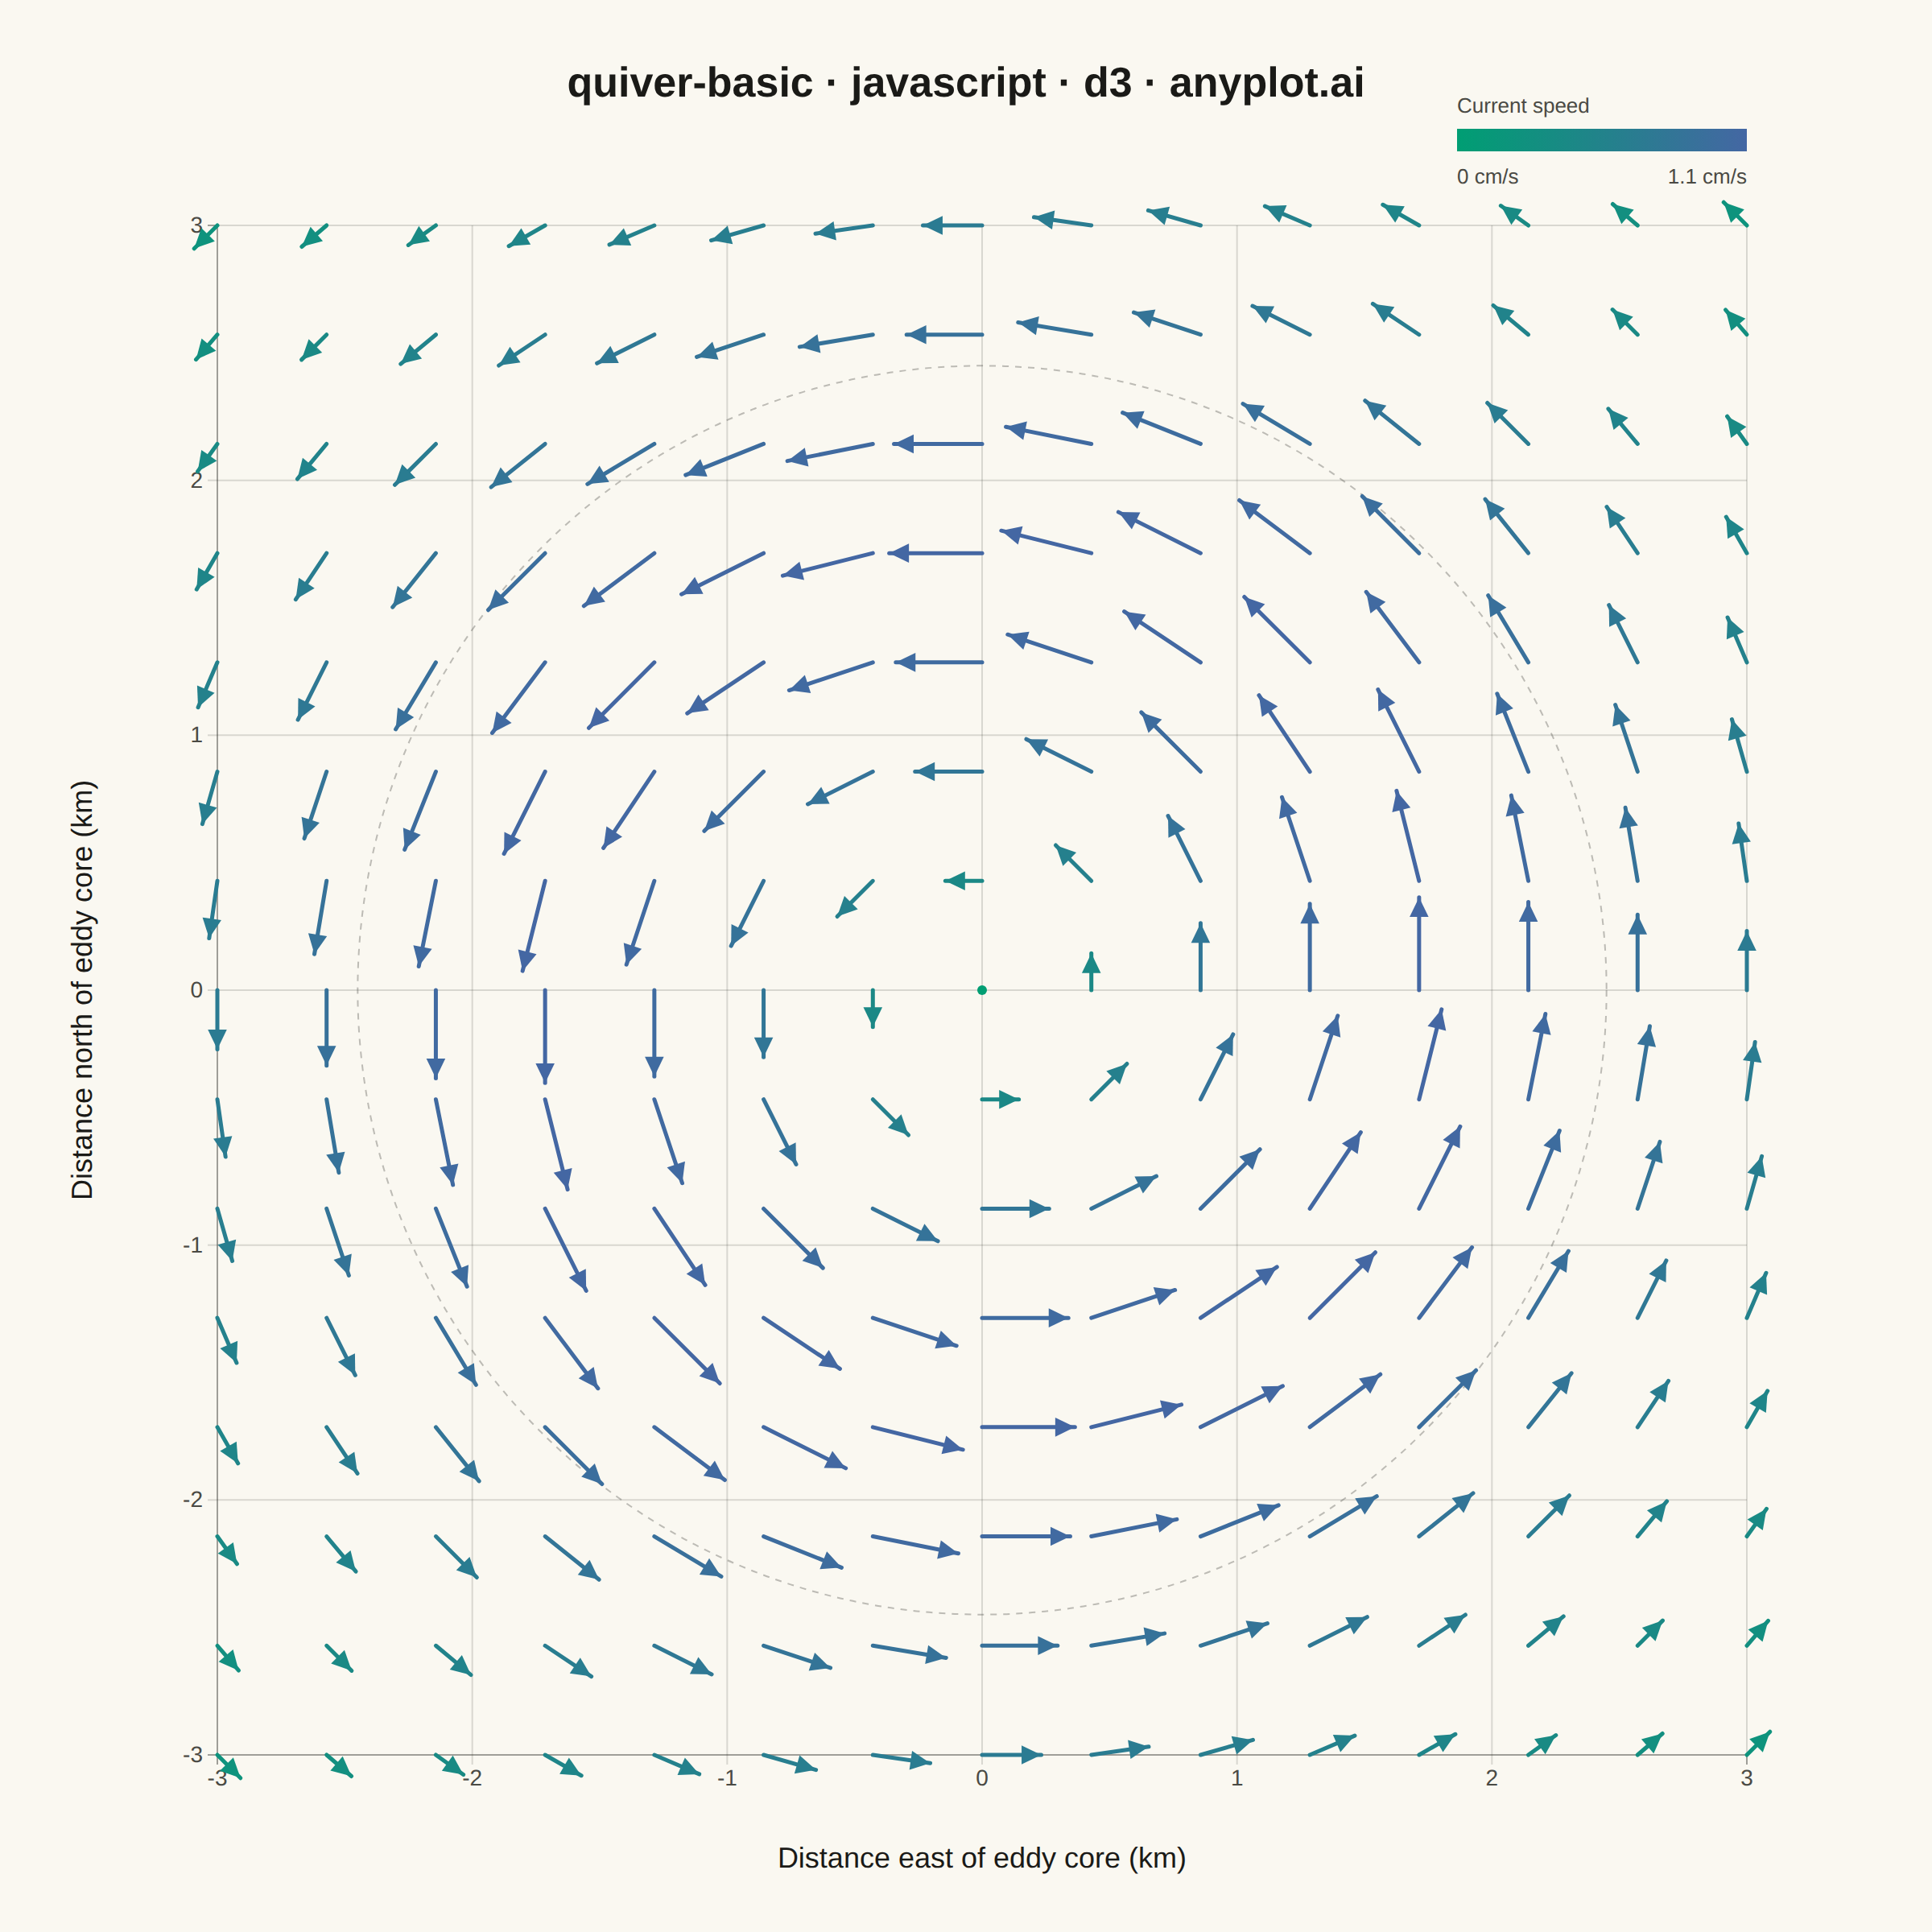
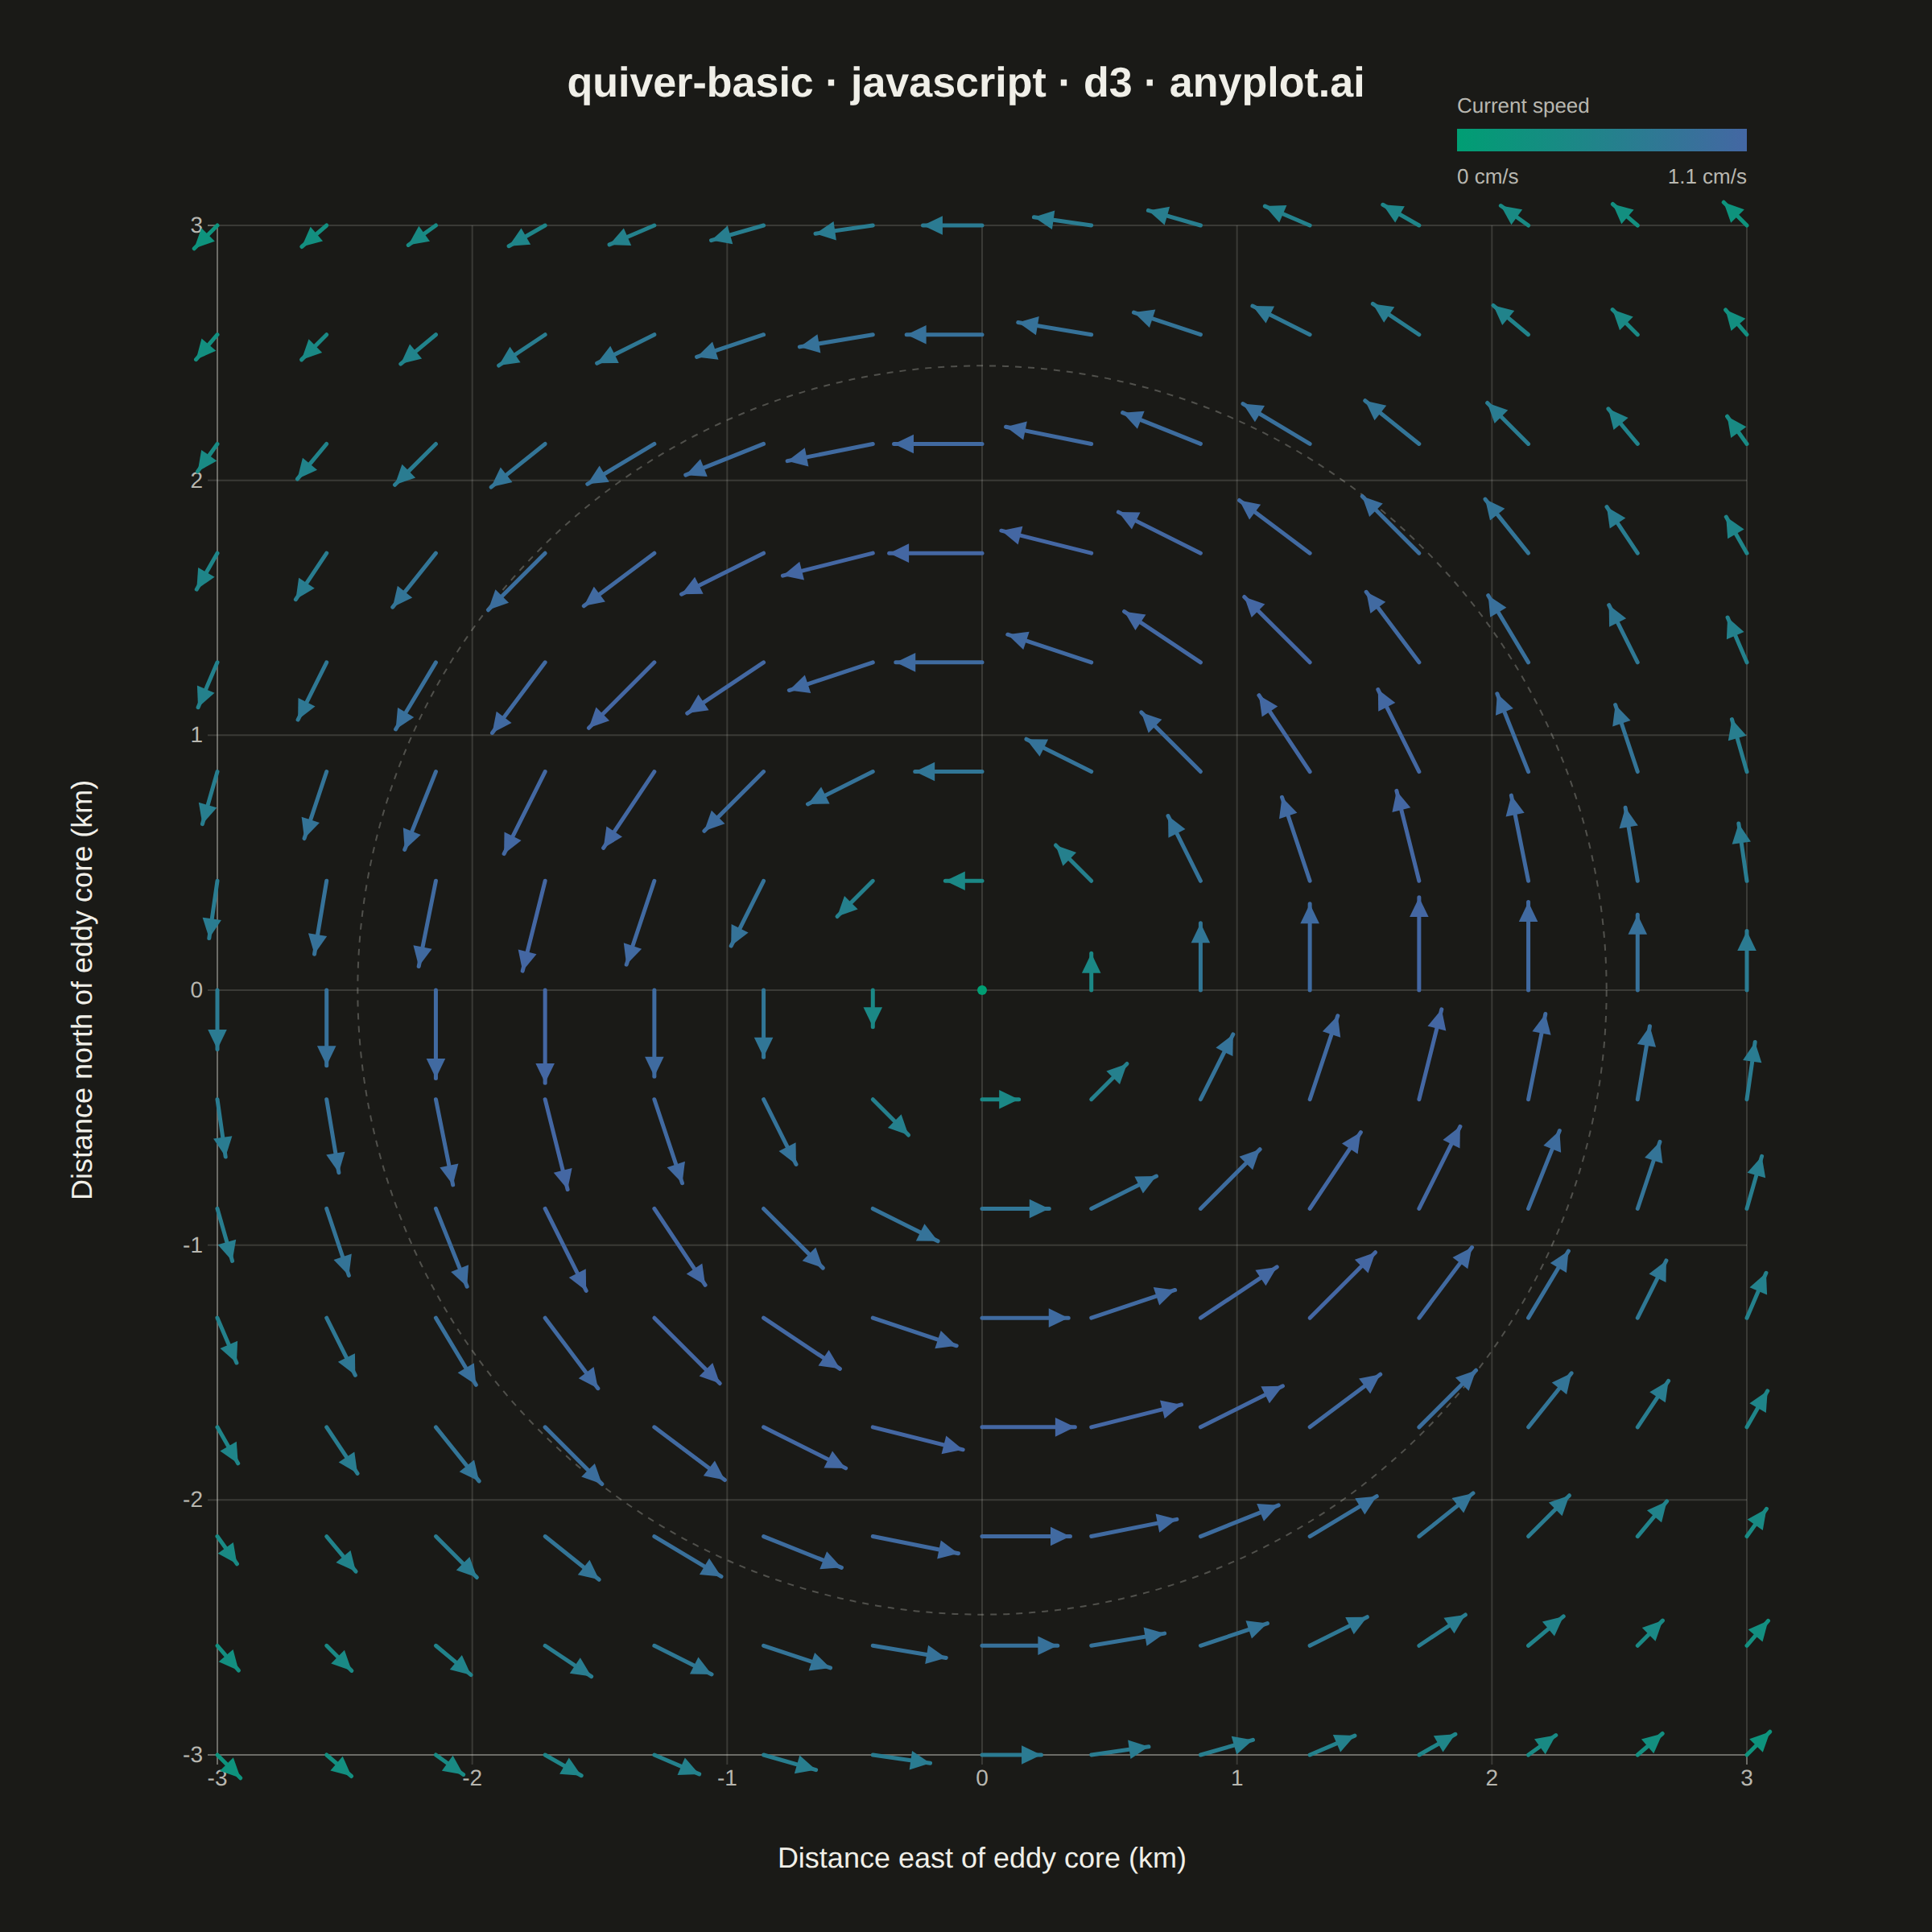
The same plot in 14 other libraries — JavaScript: Chart.js, Apache ECharts, Highcharts, MUI X Charts; Python: Altair, Bokeh, lets-plot, Matplotlib, Plotly, plotnine, Pygal, Seaborn; R: ggplot2; Julia: Makie.jl. Compare all 15 side by side: Basic Quiver Plot in Python, R, Julia and JavaScript.
A quiver plot displays vector fields using arrows positioned at grid points. Each arrow represents a vector at that location, with direction indicating the vector's angle and length proportional to its magnitude. This visualization reveals flow patterns, gradients, and field structure in two-dimensional data.
// anyplot.ai
// quiver-basic: Basic Quiver Plot
// Library: d3 7.9.0 | JavaScript 22.23.1
// Quality: 92/100 | Created: 2026-07-24
//# anyplot-orientation: square

const t = window.ANYPLOT_TOKENS;
const { width, height } = window.ANYPLOT_SIZE;

// --- Data: ocean-current vortex sampled on a uniform buoy grid -------------
// A rotating eddy (u = -y, v = x) with Gaussian decay from the eddy core,
// a classic pattern for coastal/oceanographic current surveys.
const gridSize = 15;
const domainExtent = 3; // km from the eddy core
const points = [];
for (let i = 0; i < gridSize; i++) {
  for (let j = 0; j < gridSize; j++) {
    const x = -domainExtent + (2 * domainExtent * i) / (gridSize - 1);
    const y = -domainExtent + (2 * domainExtent * j) / (gridSize - 1);
    const decay = Math.exp(-(x * x + y * y) / 6);
    const u = -y * decay; // eastward component (cm/s)
    const v = x * decay; // northward component (cm/s)
    points.push({ x, y, u, v, mag: Math.sqrt(u * u + v * v) });
  }
}
const maxMag = d3.max(points, (d) => d.mag);

// --- Layout: force a square plot area so vector angles render undistorted -
const margin = { top: 140, right: 90, bottom: 110, left: 110 };
const availW = width - margin.left - margin.right;
const availH = height - margin.top - margin.bottom;
const side = Math.min(availW, availH);
const offsetX = margin.left + (availW - side) / 2;
const offsetY = margin.top + (availH - side) / 2;

// --- Scales -----------------------------------------------------------------
const xScale = d3.scaleLinear().domain([-domainExtent, domainExtent]).range([0, side]);
const yScale = d3.scaleLinear().domain([-domainExtent, domainExtent]).range([side, 0]);
const cellSize = side / (gridSize - 1);
const pxPerUnit = (cellSize * 0.85) / maxMag; // arrow length scaled to fit the cell
const color = d3.scaleSequential(d3.interpolateRgbBasis(t.seq)).domain([0, maxMag]);

// --- SVG mount ----------------------------------------------------------------
const svg = d3.select("#container").append("svg").attr("width", width).attr("height", height);
const g = svg.append("g").attr("transform", `translate(${offsetX},${offsetY})`);

// --- Axes ---------------------------------------------------------------------
const xAxis = g
  .append("g")
  .attr("transform", `translate(0,${side})`)
  .call(d3.axisBottom(xScale).ticks(7).tickFormat((d) => `${d}`));
const yAxis = g.append("g").call(d3.axisLeft(yScale).ticks(7).tickFormat((d) => `${d}`));
for (const ax of [xAxis, yAxis]) {
  ax.selectAll("text").attr("fill", t.inkSoft).style("font-size", "14px");
  ax.selectAll("line").attr("stroke", t.grid);
  ax.select(".domain").attr("stroke", t.inkSoft).attr("stroke-width", 0.75).attr("stroke-opacity", 0.5);
}

// faint reference grid so arrow positions read against the coordinate frame
g.selectAll("line.gridx")
  .data(xScale.ticks(7))
  .join("line")
  .attr("class", "gridx")
  .attr("x1", (d) => xScale(d))
  .attr("x2", (d) => xScale(d))
  .attr("y1", 0)
  .attr("y2", side)
  .attr("stroke", t.grid)
  .attr("stroke-width", 1);
g.selectAll("line.gridy")
  .data(yScale.ticks(7))
  .join("line")
  .attr("class", "gridy")
  .attr("x1", 0)
  .attr("x2", side)
  .attr("y1", (d) => yScale(d))
  .attr("y2", (d) => yScale(d))
  .attr("stroke", t.grid)
  .attr("stroke-width", 1);

// subtle radial guide marking the eddy core's characteristic decay radius
const coreRadiusPx = xScale(Math.sqrt(6)) - xScale(0);
g.append("circle")
  .attr("cx", xScale(0))
  .attr("cy", yScale(0))
  .attr("r", coreRadiusPx)
  .attr("fill", "none")
  .attr("stroke", t.inkSoft)
  .attr("stroke-width", 1)
  .attr("stroke-dasharray", "4,4")
  .attr("stroke-opacity", 0.35);

// --- Arrows (line + solid triangular head, colored by current speed) --------
const headAngle = Math.PI / 7;
const headLen = Math.max(7, cellSize * 0.2);
const minShaftLen = Math.max(headLen * 1.5, cellSize * 0.3); // keep near-zero vectors legible

const arrows = g.selectAll("g.arrow").data(points).join("g").attr("class", "arrow");
arrows.each(function (d) {
  const x0 = xScale(d.x);
  const y0 = yScale(d.y);
  const fill = color(d.mag);

  if (d.mag < 1e-9) {
    // exact stagnation point at the eddy core: direction undefined, mark with a dot
    d3.select(this).append("circle").attr("cx", x0).attr("cy", y0).attr("r", 3).attr("fill", fill);
    return;
  }

  const lenPx = Math.max(d.mag * pxPerUnit, minShaftLen);
  const dxPx = (d.u / d.mag) * lenPx;
  const dyPx = (-d.v / d.mag) * lenPx; // screen y grows downward, data y grows upward
  const x1 = x0 + dxPx;
  const y1 = y0 + dyPx;
  const angle = Math.atan2(dyPx, dxPx);

  const hx1 = x1 - headLen * Math.cos(angle - headAngle);
  const hy1 = y1 - headLen * Math.sin(angle - headAngle);
  const hx2 = x1 - headLen * Math.cos(angle + headAngle);
  const hy2 = y1 - headLen * Math.sin(angle + headAngle);

  d3.select(this)
    .append("line")
    .attr("x1", x0)
    .attr("y1", y0)
    .attr("x2", x1)
    .attr("y2", y1)
    .attr("stroke", fill)
    .attr("stroke-width", 2.5)
    .attr("stroke-linecap", "round");

  d3.select(this)
    .append("path")
    .attr("d", `M${x1},${y1} L${hx1},${hy1} L${hx2},${hy2} Z`)
    .attr("fill", fill);
});

// --- Axis labels --------------------------------------------------------------
g.append("text")
  .attr("x", side / 2)
  .attr("y", side + 70)
  .attr("text-anchor", "middle")
  .attr("fill", t.ink)
  .style("font-size", "18px")
  .text("Distance east of eddy core (km)");

g.append("text")
  .attr("transform", `translate(${-78},${side / 2}) rotate(-90)`)
  .attr("text-anchor", "middle")
  .attr("fill", t.ink)
  .style("font-size", "18px")
  .text("Distance north of eddy core (km)");

// --- Speed legend (color encodes current magnitude) --------------------------
const legendW = 180;
const legendH = 14;
const legendX = offsetX + side - legendW;
const legendY = offsetY - 60;

const gradientId = "quiver-speed-gradient";
const defs = svg.append("defs");
const gradient = defs
  .append("linearGradient")
  .attr("id", gradientId)
  .attr("x1", "0%")
  .attr("x2", "100%");
gradient.append("stop").attr("offset", "0%").attr("stop-color", t.seq[0]);
gradient.append("stop").attr("offset", "100%").attr("stop-color", t.seq[1]);

svg
  .append("rect")
  .attr("x", legendX)
  .attr("y", legendY)
  .attr("width", legendW)
  .attr("height", legendH)
  .attr("fill", `url(#${gradientId})`);

svg
  .append("text")
  .attr("x", legendX)
  .attr("y", legendY - 10)
  .attr("text-anchor", "start")
  .attr("fill", t.inkSoft)
  .style("font-size", "13px")
  .text("Current speed");

svg
  .append("text")
  .attr("x", legendX)
  .attr("y", legendY + legendH + 20)
  .attr("text-anchor", "start")
  .attr("fill", t.inkSoft)
  .style("font-size", "13px")
  .text("0 cm/s");

svg
  .append("text")
  .attr("x", legendX + legendW)
  .attr("y", legendY + legendH + 20)
  .attr("text-anchor", "end")
  .attr("fill", t.inkSoft)
  .style("font-size", "13px")
  .text(`${maxMag.toFixed(1)} cm/s`);

// --- Title ----------------------------------------------------------------
svg
  .append("text")
  .attr("x", width / 2)
  .attr("y", 60)
  .attr("text-anchor", "middle")
  .attr("fill", t.ink)
  .style("font-size", "26px")
  .style("font-weight", "600")
  .text("quiver-basic · javascript · d3 · anyplot.ai");
Runnable source as JSON, for any HTTP client: https://api.anyplot.ai/specs/quiver-basic/d3/code. Any spec id and library id listed in llms-full.txt fit the same URL shape; every URL below is complete and callable.
{
  "spec_id": "quiver-basic",
  "language": "javascript",
  "library": "d3",
  "page": "https://anyplot.ai/quiver-basic/javascript/d3",
  "hub": "https://anyplot.ai/quiver-basic",
  "code_json": "https://api.anyplot.ai/specs/quiver-basic/d3/code",
  "spec_json": "https://api.anyplot.ai/specs/quiver-basic",
  "render_light_png": "https://storage.googleapis.com/anyplot-images/plots/quiver-basic/javascript/d3/plot-light.png",
  "render_dark_png": "https://storage.googleapis.com/anyplot-images/plots/quiver-basic/javascript/d3/plot-dark.png",
  "interactive_light_html": "https://storage.googleapis.com/anyplot-images/plots/quiver-basic/javascript/d3/plot-light.html",
  "interactive_dark_html": "https://storage.googleapis.com/anyplot-images/plots/quiver-basic/javascript/d3/plot-dark.html",
  "quality_score": 92.0,
  "license": "MIT",
  "guide": "https://anyplot.ai/llms.txt"
}
Part of Basic Quiver Plot on anyplot.ai.