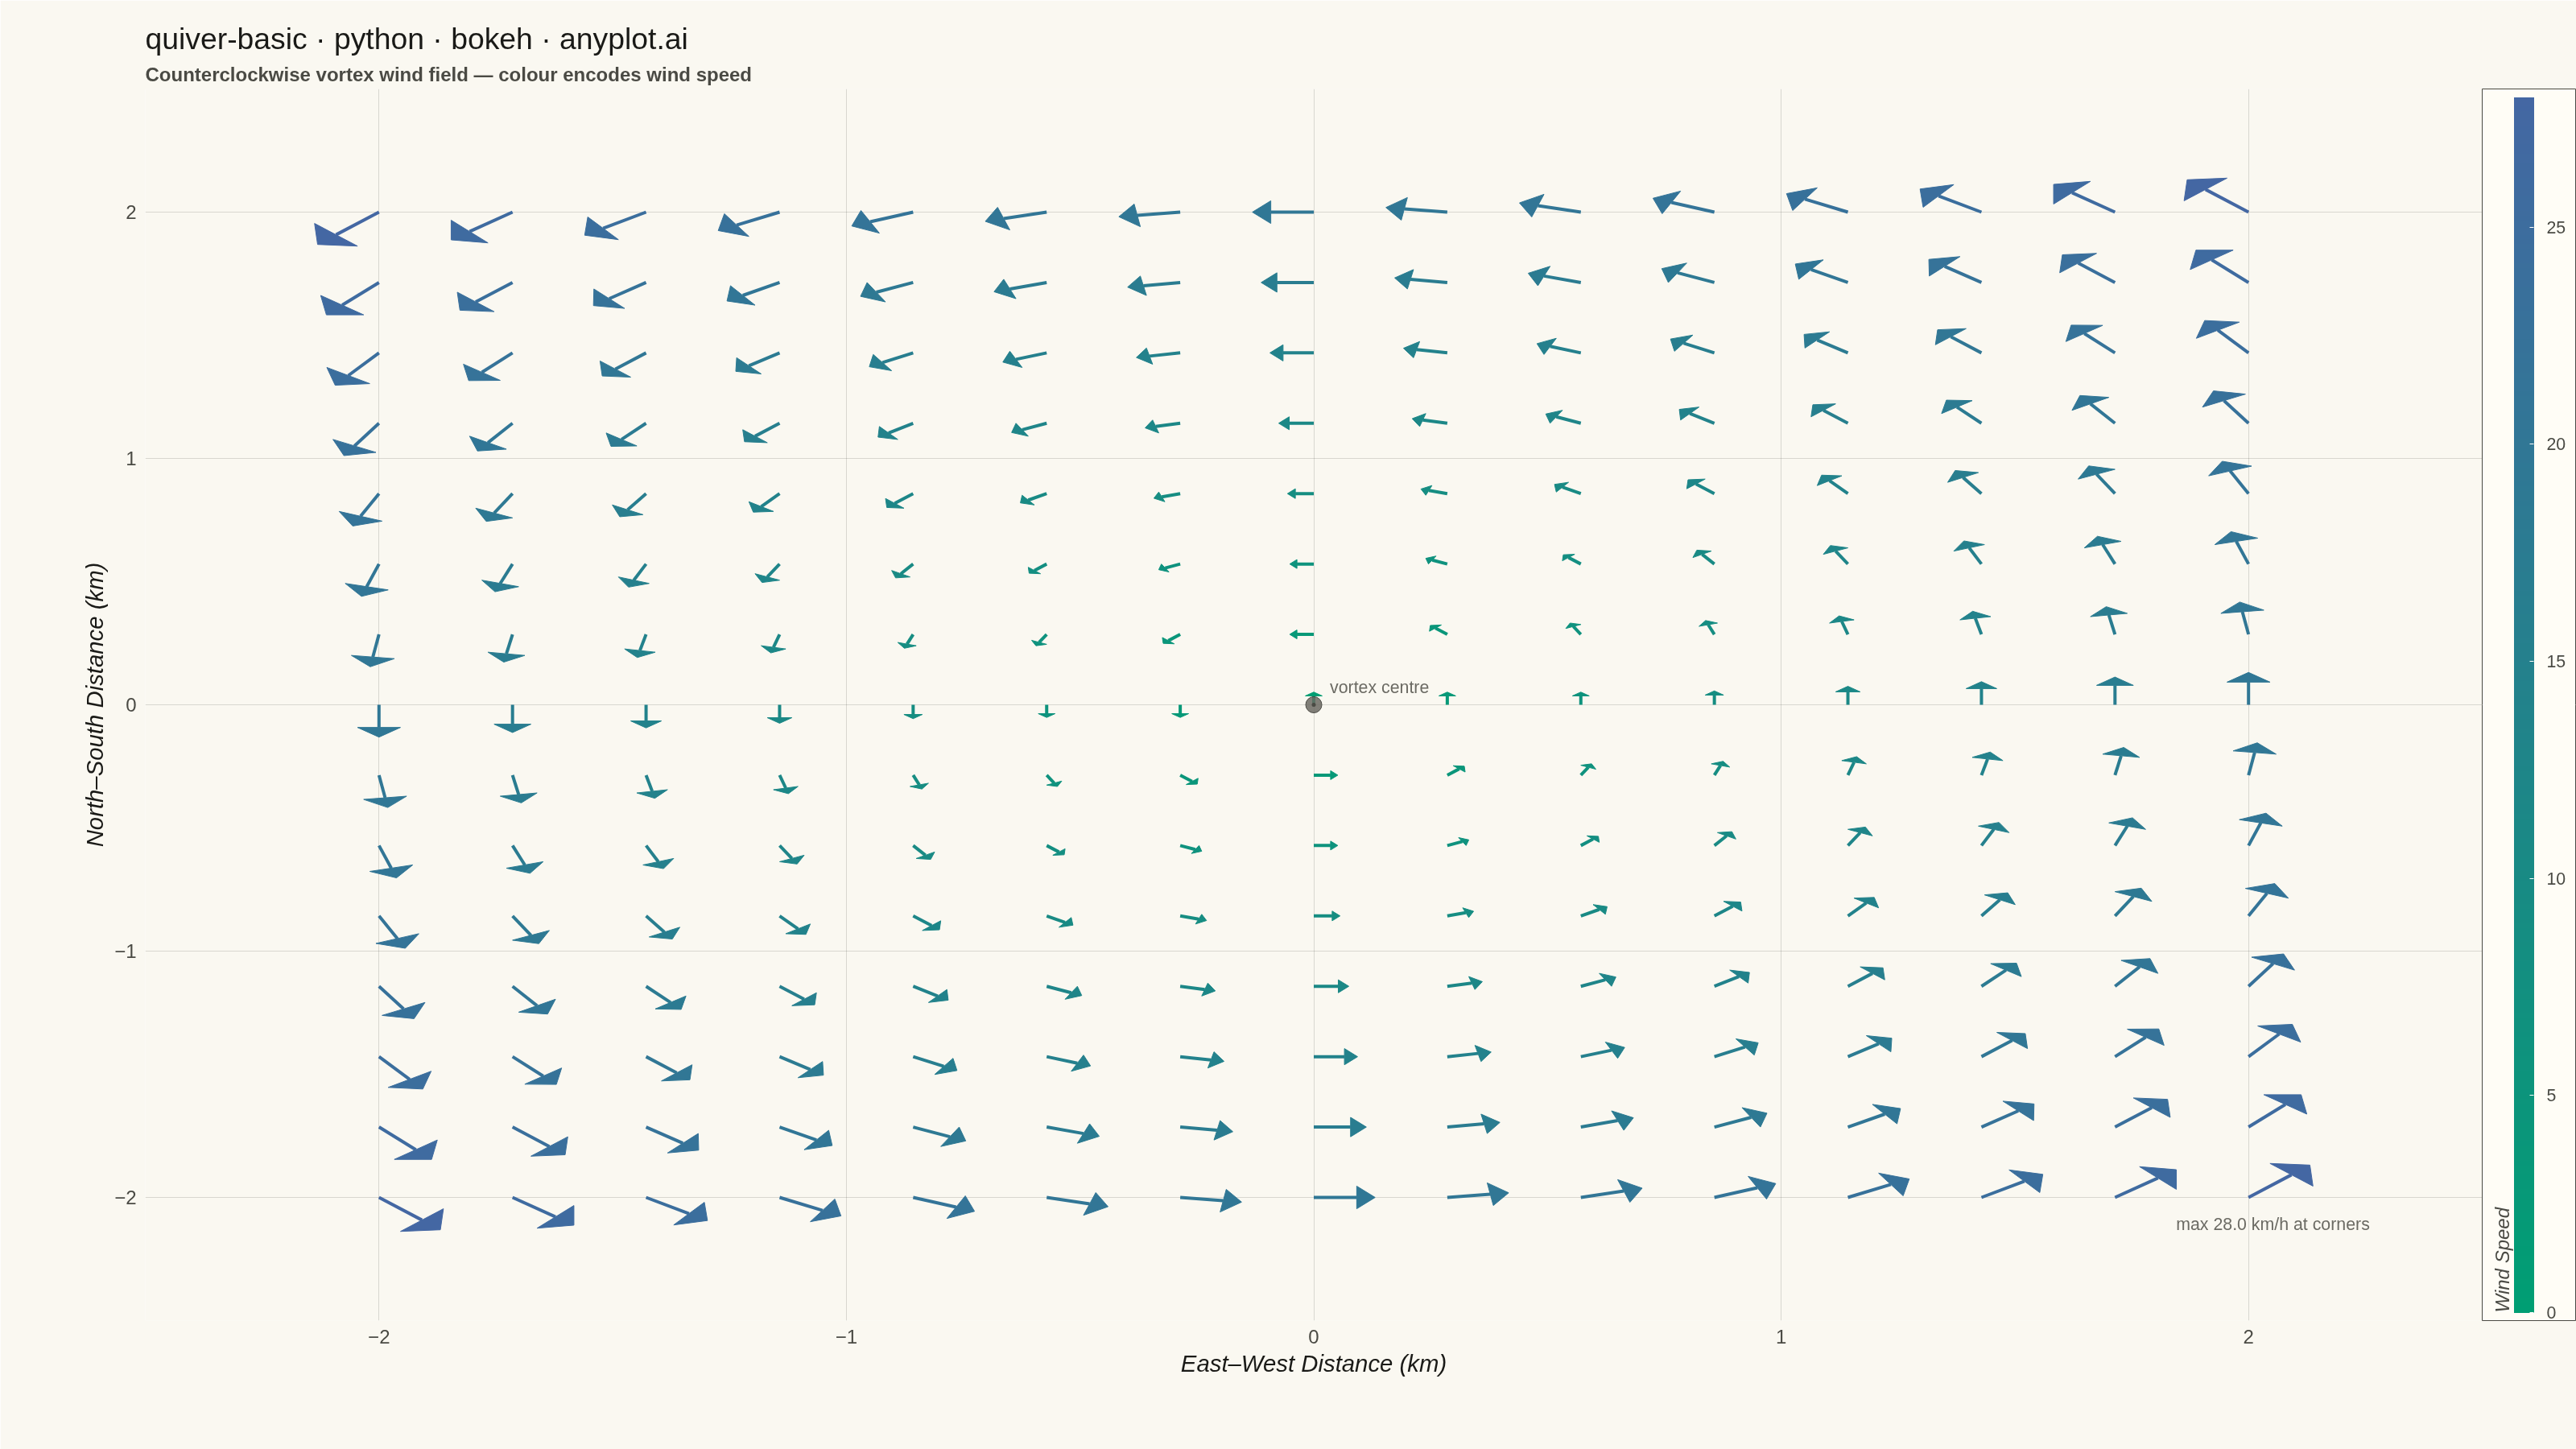
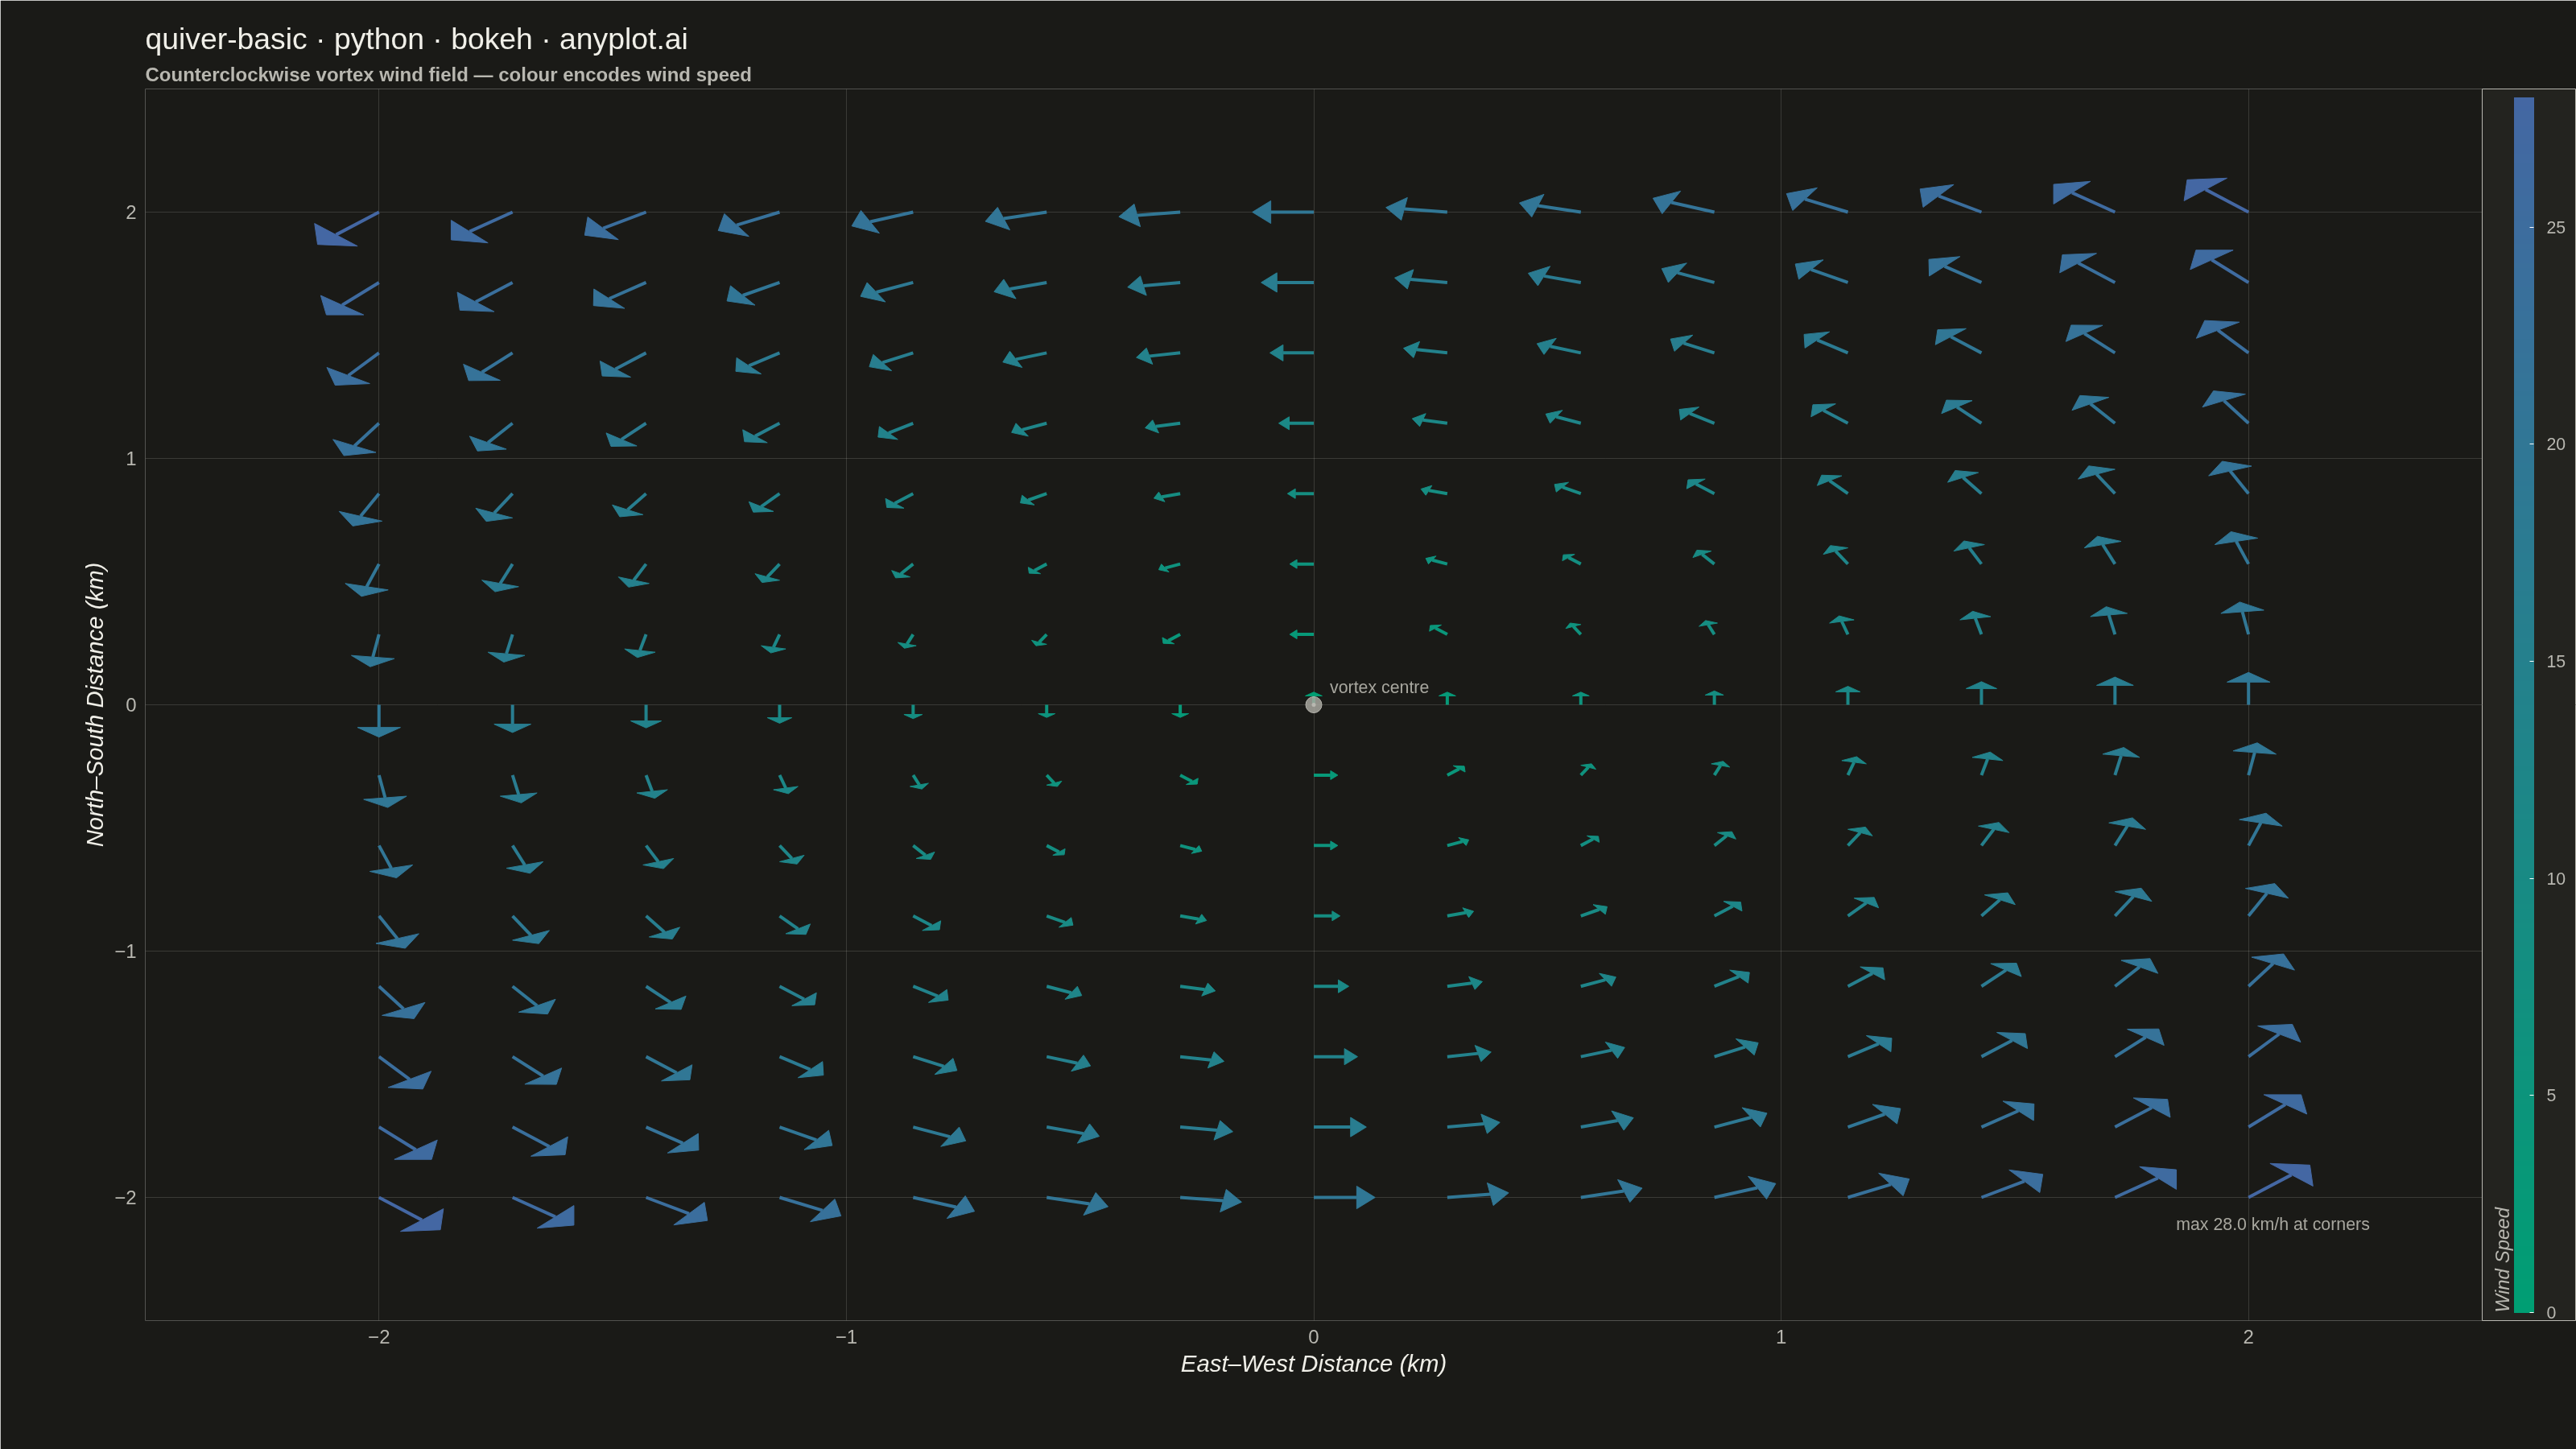
A quiver plot displays vector fields using arrows positioned at grid points. Each arrow represents a vector at that location, with direction indicating the vector's angle and length proportional to its magnitude. This visualization reveals flow patterns, gradients, and field structure in two-dimensional data.
""" anyplot.ai
quiver-basic: Basic Quiver Plot
Library: bokeh 3.9.1 | Python 3.13.14
Quality: 87/100 | Updated: 2026-07-24
"""

import os
import sys


# Prevent self-import: this file is named bokeh.py, which shadows the installed
# bokeh package when its directory sits at the front of sys.path.
_this_dir = os.path.dirname(os.path.abspath(__file__))
sys.path = [p for p in sys.path if os.path.abspath(p or ".") != _this_dir]

import time
from pathlib import Path

import numpy as np
from bokeh.io import output_file, save
from bokeh.models import ColorBar, ColumnDataSource, Label, LinearColorMapper, Title
from bokeh.plotting import figure
from selenium import webdriver
from selenium.webdriver.chrome.options import Options


# Theme tokens (Imprint)
THEME = os.getenv("ANYPLOT_THEME", "light")
PAGE_BG = "#FAF8F1" if THEME == "light" else "#1A1A17"
ELEVATED_BG = "#FFFDF6" if THEME == "light" else "#242420"
INK = "#1A1A17" if THEME == "light" else "#F0EFE8"
INK_SOFT = "#4A4A44" if THEME == "light" else "#B8B7B0"
INK_MUTED = "#6B6A63" if THEME == "light" else "#A8A79F"


# Continuous colormap — imprint_seq (single-polarity: wind speed magnitude)
def _lerp_hex(c0, c1, t):
    r0, g0, b0 = (int(c0[i : i + 2], 16) for i in (1, 3, 5))
    r1, g1, b1 = (int(c1[i : i + 2], 16) for i in (1, 3, 5))
    r, g, b = (int(round(a + (b - a) * t)) for a, b in ((r0, r1), (g0, g1), (b0, b1)))
    return f"#{r:02X}{g:02X}{b:02X}"


IMPRINT_SEQ256 = [_lerp_hex("#009E73", "#4467A3", t / 255.0) for t in range(256)]

# Data - counterclockwise vortex wind field: u = -y, v = x
grid_size = 15
axis_coords = np.linspace(-2, 2, grid_size)
X, Y = np.meshgrid(axis_coords, axis_coords)
x = X.flatten()
y = Y.flatten()

u = -y.copy()
v = x.copy()

# Magnitude-proportional arrow lengths (length encodes wind speed)
magnitude = np.sqrt(u**2 + v**2)

grid_spacing = 4.0 / (grid_size - 1)
raw_max_mag = np.max(magnitude) if np.max(magnitude) > 0 else 1.0

# Rescale the abstract rotation field into a realistic wind-speed range
# (km/h) so the "Wind Speed" label/legend reads true — the raw u=-y, v=x
# field only spans 0-2.8, which looks like still air for a field labeled wind.
WIND_SPEED_MAX = 28.0  # km/h — brisk breeze, plausible peak for the label
speed = magnitude * (WIND_SPEED_MAX / raw_max_mag)
max_mag = WIND_SPEED_MAX

scale = grid_spacing * 0.65 / raw_max_mag
u_scaled = u * scale
v_scaled = v * scale

# Arrow geometry — enforce minimum displayed length so near-origin arrows stay visible
arrow_lengths = np.sqrt(u_scaled**2 + v_scaled**2)
MIN_DISP = grid_spacing * 0.18
display_lengths = np.maximum(arrow_lengths, MIN_DISP)

# Unit direction vectors (default to pointing up for zero-magnitude vectors)
near_zero = arrow_lengths < 1e-10
safe_lengths = np.where(near_zero, 1.0, arrow_lengths)
dx = np.where(near_zero, 0.0, u_scaled / safe_lengths)
dy = np.where(near_zero, 1.0, v_scaled / safe_lengths)
perp_x = -dy
perp_y = dx

head_len = display_lengths * 0.30
head_wid = display_lengths * 0.35

arrow_x_end = x + dx * display_lengths
arrow_y_end = y + dy * display_lengths
arrow_base_x = arrow_x_end - head_len * dx
arrow_base_y = arrow_y_end - head_len * dy
arrow_x1 = arrow_base_x + head_wid * perp_x
arrow_y1 = arrow_base_y + head_wid * perp_y
arrow_x2 = arrow_base_x - head_wid * perp_x
arrow_y2 = arrow_base_y - head_wid * perp_y

# Color by wind speed using the Imprint sequential colormap (green -> blue)
speed_norm = speed / max_mag
color_indices = (speed_norm * 255).astype(int).clip(0, 255)
colors = [IMPRINT_SEQ256[i] for i in color_indices]

# Canvas — 3200x1800 canonical landscape; toolbar disabled so the static PNG
# isn't shrunk by bokeh's default toolbar strip (see bokeh.md "Canvas" rule).
W, H = 3200, 1800
p = figure(
    width=W,
    height=H,
    title="quiver-basic · python · bokeh · anyplot.ai",
    x_axis_label="East–West Distance (km)",
    y_axis_label="North–South Distance (km)",
    x_range=(-2.5, 2.5),
    y_range=(-2.5, 2.5),
    background_fill_color=PAGE_BG,
    border_fill_color=PAGE_BG,
    toolbar_location=None,
    min_border_bottom=160,
    min_border_left=180,
    min_border_top=110,
    min_border_right=50,
)

# Subtitle
p.add_layout(
    Title(
        text="Counterclockwise vortex wind field — colour encodes wind speed",
        text_font_size="18pt",
        text_color=INK_SOFT,
    ),
    "above",
)

# Theme-adaptive chrome — spines removed entirely for a clean look against the
# dense arrow grid (Style guide "Spines: Alternative — remove all for grid-based plots")
p.outline_line_color = None

p.title.text_color = INK
p.title.text_font_size = "28pt"
p.title.text_font_style = "normal"

p.xaxis.axis_label_text_color = INK
p.yaxis.axis_label_text_color = INK
p.xaxis.axis_label_text_font_size = "22pt"
p.yaxis.axis_label_text_font_size = "22pt"
p.xaxis.major_label_text_color = INK_SOFT
p.yaxis.major_label_text_color = INK_SOFT
p.xaxis.major_label_text_font_size = "18pt"
p.yaxis.major_label_text_font_size = "18pt"
p.xaxis.axis_line_color = None
p.yaxis.axis_line_color = None
p.xaxis.major_tick_line_color = None
p.yaxis.major_tick_line_color = None
p.xaxis.minor_tick_line_color = None
p.yaxis.minor_tick_line_color = None

p.xgrid.grid_line_color = INK
p.ygrid.grid_line_color = INK
p.xgrid.grid_line_alpha = 0.15
p.ygrid.grid_line_alpha = 0.15

# Arrow shafts (stop at arrowhead base to avoid shaft poking through head)
segment_source = ColumnDataSource(data={"x0": x, "y0": y, "x1": arrow_base_x, "y1": arrow_base_y, "color": colors})
p.segment(x0="x0", y0="y0", x1="x1", y1="y1", source=segment_source, line_width=4, line_color="color")

# Arrowheads as filled triangles
xs = [[arrow_x_end[i], arrow_x1[i], arrow_x2[i]] for i in range(len(x))]
ys = [[arrow_y_end[i], arrow_y1[i], arrow_y2[i]] for i in range(len(y))]
patch_source = ColumnDataSource(data={"xs": xs, "ys": ys, "color": colors})
p.patches(xs="xs", ys="ys", source=patch_source, fill_color="color", line_color="color")

# Vortex centre marker and annotation
p.scatter([0], [0], marker="circle_dot", size=20, color=INK_MUTED, fill_alpha=0.85, line_color=INK_SOFT)
p.add_layout(
    Label(
        x=0,
        y=0,
        text="vortex centre",
        x_offset=20,
        y_offset=10,
        text_font_size="16pt",
        text_color=INK_MUTED,
        background_fill_color=None,
        border_line_color=None,
    )
)

# Max-speed annotation — all four corners tie for the highest wind speed
# (magnitude depends only on radius). Anchored at the bottom-right corner,
# where the tangential flow (u=-y, v=x) points up-and-away from the margin
# below the grid, so the label sits in clear space with no arrow overlap.
p.add_layout(
    Label(
        x=2.0,
        y=-2.0,
        text=f"max {max_mag:.1f} km/h at corners",
        x_offset=-90,
        y_offset=-45,
        text_font_size="16pt",
        text_color=INK_MUTED,
        background_fill_color=None,
        border_line_color=None,
    )
)

# ColorBar for wind speed legend
color_mapper = LinearColorMapper(palette=IMPRINT_SEQ256, low=0.0, high=float(max_mag))
color_bar = ColorBar(
    color_mapper=color_mapper,
    label_standoff=16,
    location=(0, 0),
    title="Wind Speed",
    title_text_color=INK_SOFT,
    title_text_font_size="18pt",
    major_label_text_color=INK_SOFT,
    major_label_text_font_size="16pt",
    background_fill_color=ELEVATED_BG,
    border_line_color=INK_SOFT,
)
p.add_layout(color_bar, "right")

# Save interactive HTML
output_file(f"plot-{THEME}.html", title="quiver-basic · bokeh · anyplot.ai")
save(p)

# Screenshot via Selenium headless Chrome — matches bokeh.md pattern
# (bokeh.io.export_png probes /usr/bin/chromedriver via a snap shim that fails
# in this environment; Selenium Manager resolves a working driver instead)
opts = Options()
for arg in (
    "--headless=new",
    "--no-sandbox",
    "--disable-dev-shm-usage",
    "--disable-gpu",
    f"--window-size={W},{H}",
    "--hide-scrollbars",
):
    opts.add_argument(arg)
driver = webdriver.Chrome(options=opts)
# CDP override forces an exact W×H viewport regardless of outer window chrome
driver.execute_cdp_cmd(
    "Emulation.setDeviceMetricsOverride", {"width": W, "height": H, "deviceScaleFactor": 1, "mobile": False}
)
driver.get(f"file://{Path(f'plot-{THEME}.html').resolve()}")
time.sleep(3)  # let bokeh's JS render the canvas
driver.save_screenshot(f"plot-{THEME}.png")
driver.quit()
Runnable source as JSON, for any HTTP client: https://api.anyplot.ai/specs/quiver-basic/bokeh/code. Any spec id and library id listed in llms-full.txt fit the same URL shape; every URL below is complete and callable.
{
  "spec_id": "quiver-basic",
  "language": "python",
  "library": "bokeh",
  "page": "https://anyplot.ai/quiver-basic/python/bokeh",
  "hub": "https://anyplot.ai/quiver-basic",
  "code_json": "https://api.anyplot.ai/specs/quiver-basic/bokeh/code",
  "spec_json": "https://api.anyplot.ai/specs/quiver-basic",
  "render_light_png": "https://storage.googleapis.com/anyplot-images/plots/quiver-basic/python/bokeh/plot-light.png",
  "render_dark_png": "https://storage.googleapis.com/anyplot-images/plots/quiver-basic/python/bokeh/plot-dark.png",
  "interactive_light_html": "https://storage.googleapis.com/anyplot-images/plots/quiver-basic/python/bokeh/plot-light.html",
  "interactive_dark_html": "https://storage.googleapis.com/anyplot-images/plots/quiver-basic/python/bokeh/plot-dark.html",
  "quality_score": 87.0,
  "license": "MIT",
  "guide": "https://anyplot.ai/llms.txt"
}
Part of Basic Quiver Plot on anyplot.ai.