The same plot in 14 other libraries — JavaScript: Chart.js, D3.js, Apache ECharts, Highcharts; Python: Altair, Bokeh, lets-plot, Matplotlib, Plotly, plotnine, Pygal, Seaborn; R: ggplot2; Julia: Makie.jl. Compare all 15 side by side: Basic Quiver Plot in Python, R, Julia and JavaScript.
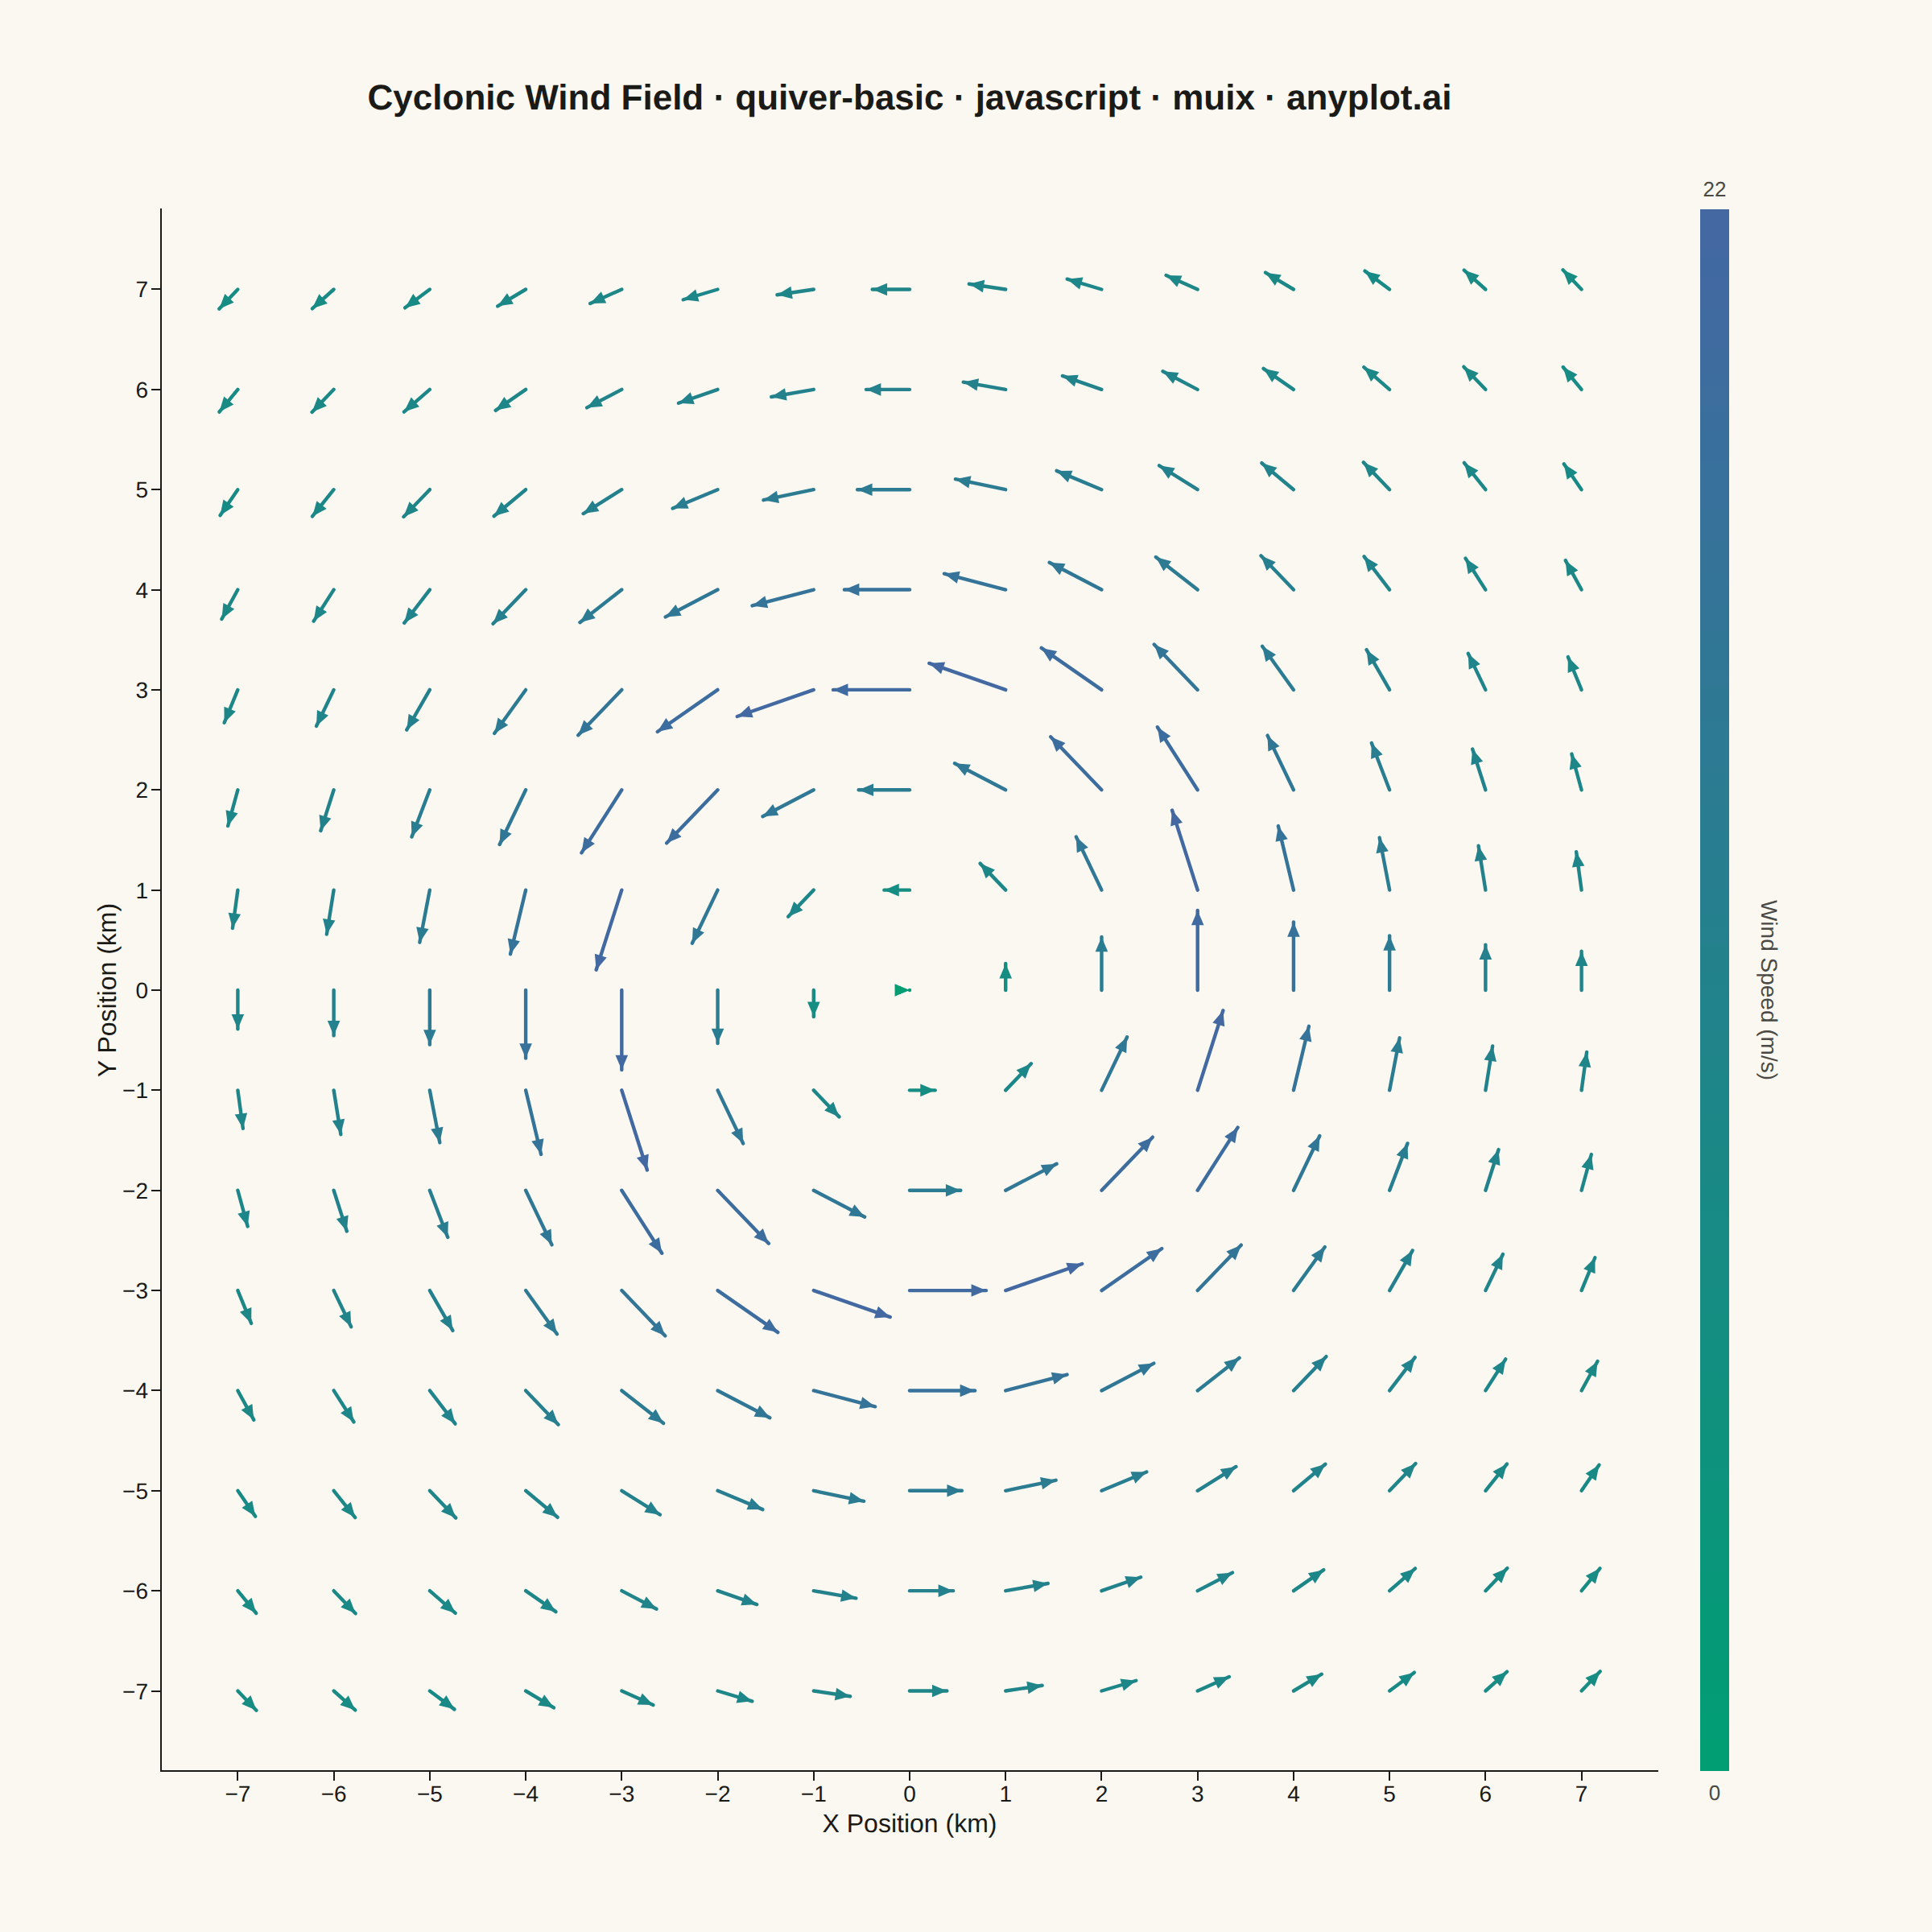
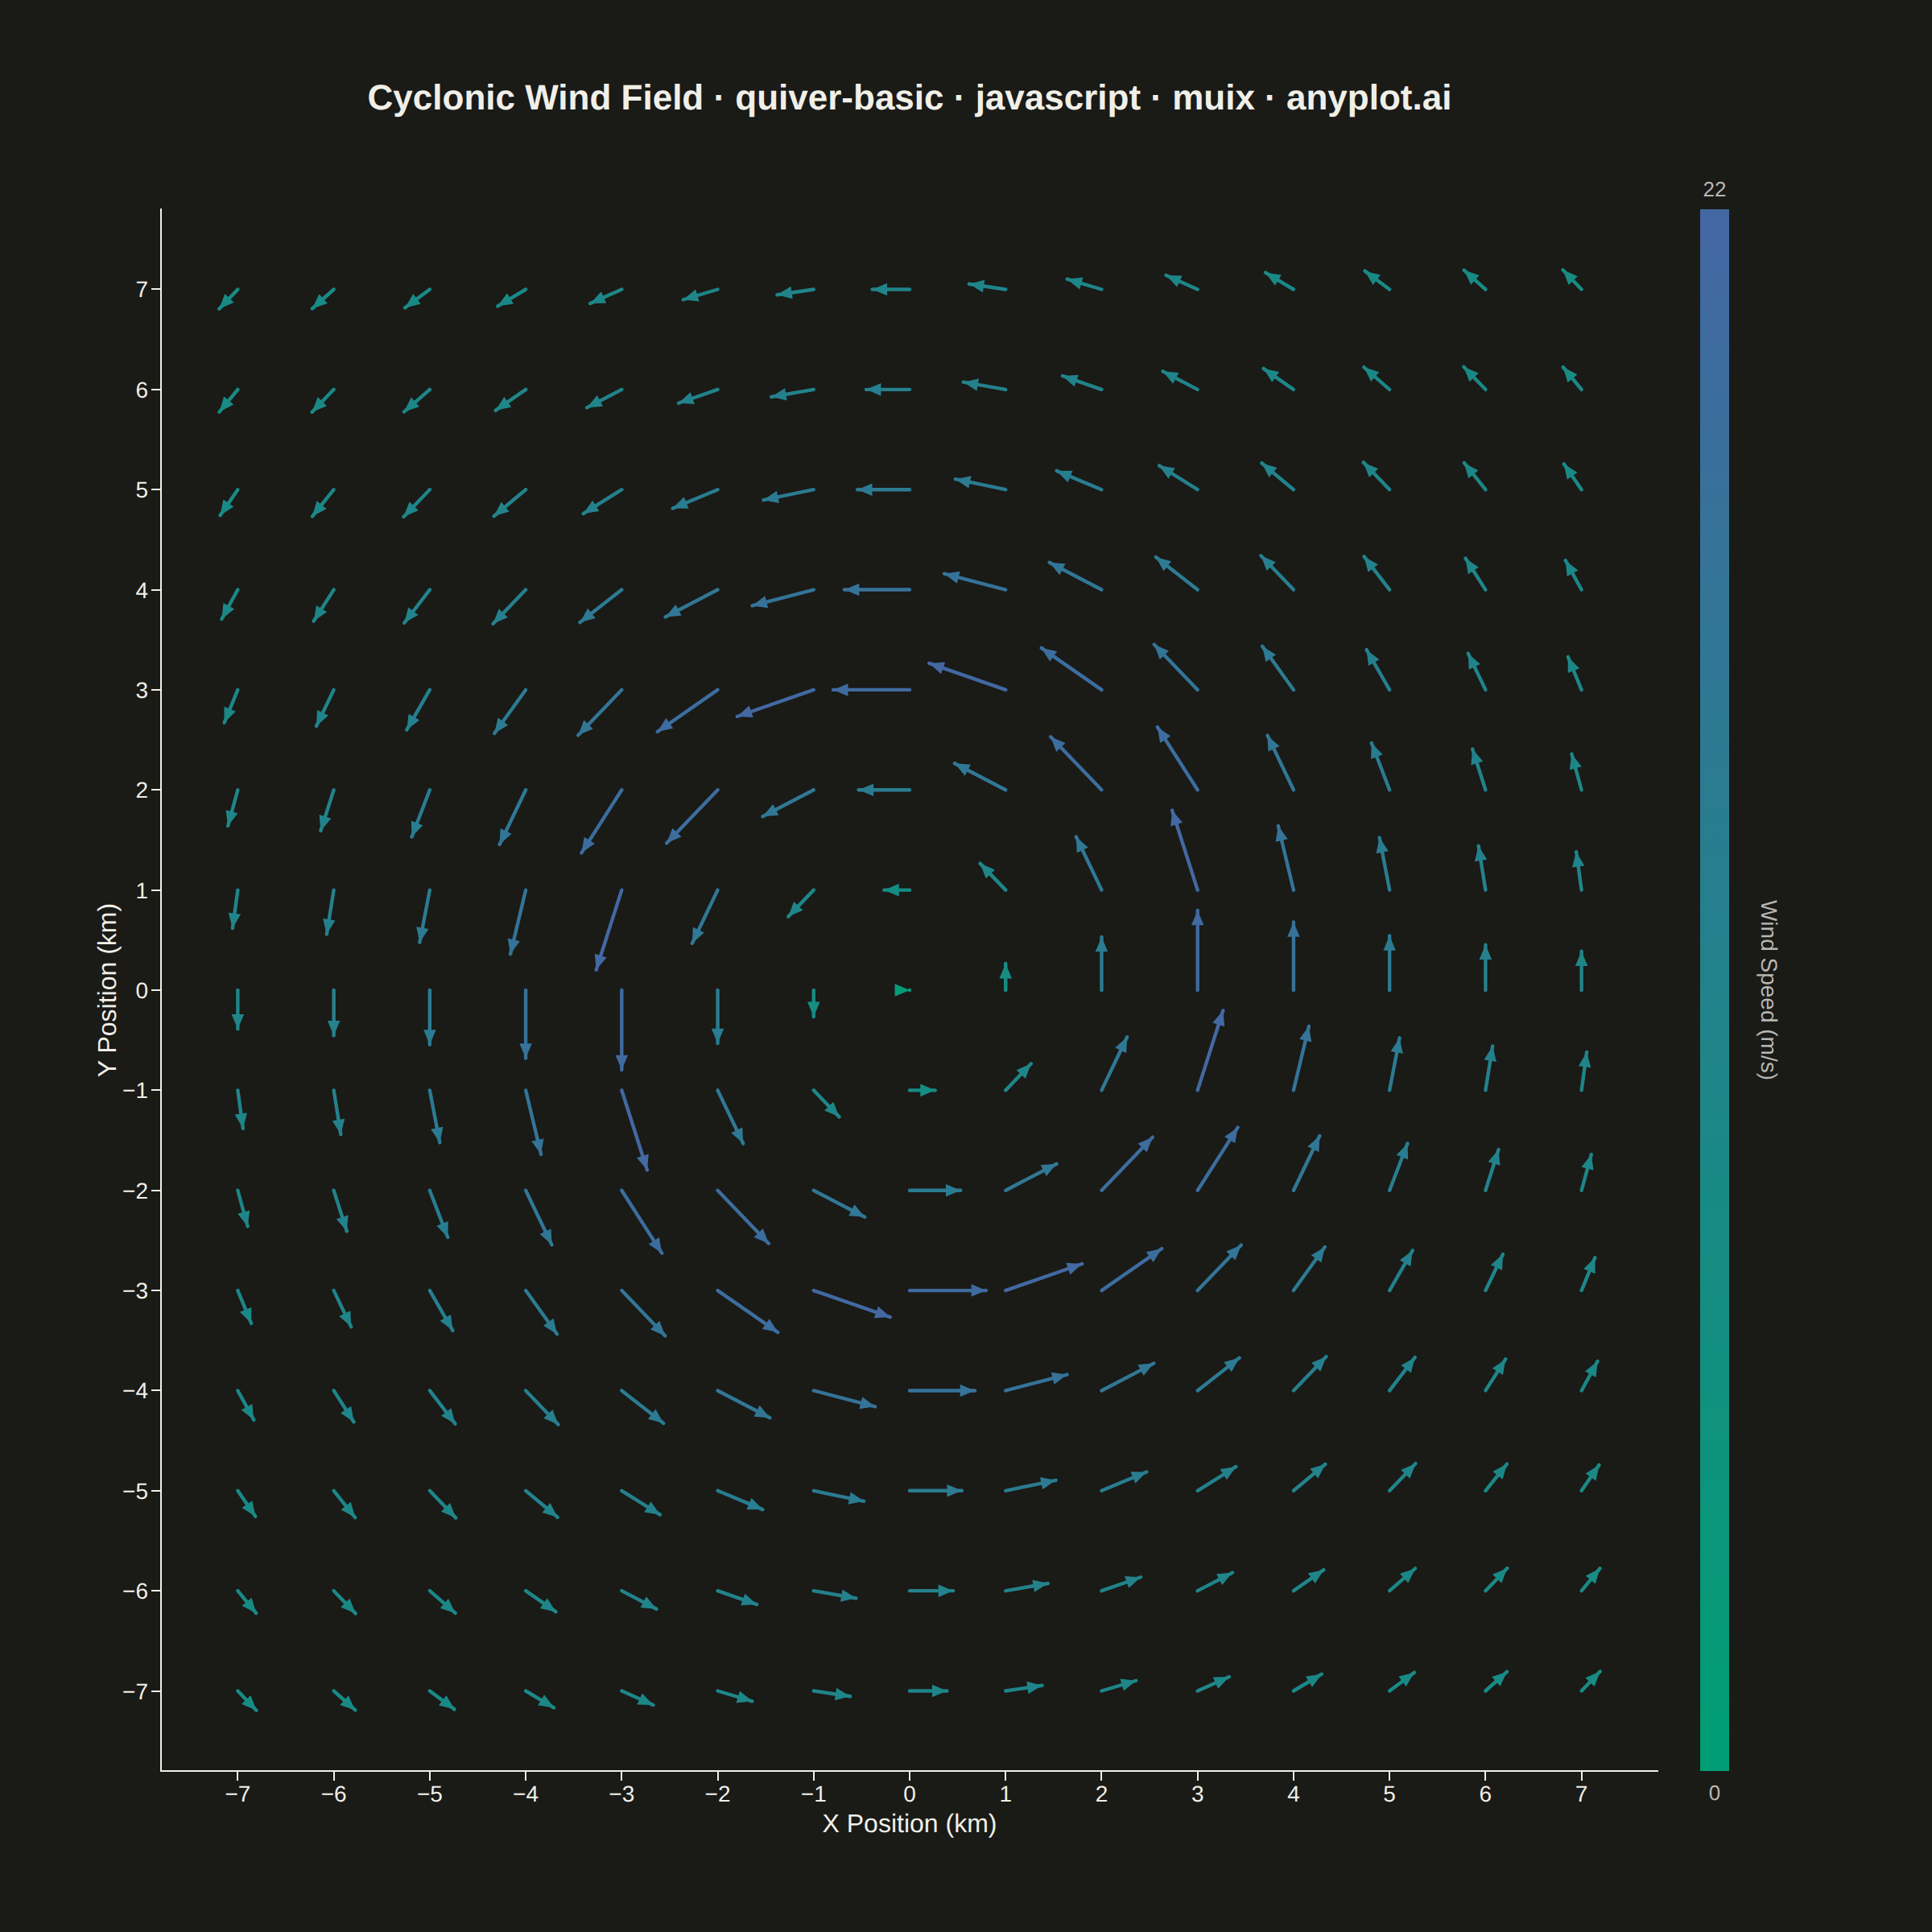
A quiver plot displays vector fields using arrows positioned at grid points. Each arrow represents a vector at that location, with direction indicating the vector's angle and length proportional to its magnitude. This visualization reveals flow patterns, gradients, and field structure in two-dimensional data.
// anyplot.ai
// quiver-basic: Basic Quiver Plot
// Library: muix 7.29.1 | JavaScript 22.23.1
// Quality: 91/100 | Created: 2026-07-24
//# anyplot-orientation: square

import { ChartContainer } from "@mui/x-charts/ChartContainer";
import { ChartsXAxis } from "@mui/x-charts/ChartsXAxis";
import { ChartsYAxis } from "@mui/x-charts/ChartsYAxis";
import { useXScale, useYScale, useDrawingArea } from "@mui/x-charts/hooks";

const t = window.ANYPLOT_TOKENS;
const FONT = "-apple-system, BlinkMacSystemFont, 'Segoe UI', Roboto, Helvetica, Arial, sans-serif";

// --- Data: cyclonic wind field around a low-pressure center ----------------
// Rankine vortex model — solid-body rotation inside the core radius, decaying
// tangential flow outside it. Positions are km from the storm center; wind
// speed is m/s. This produces the calm "eye" at the center and the peak wind
// band at the core radius that real low-pressure systems exhibit.
const DOMAIN = 7; // km, grid spans [-DOMAIN, DOMAIN] on both axes
const GRID_N = 15; // 15x15 = 225 arrows
const CORE_RADIUS = 3.2; // km, radius of peak tangential wind
const PEAK_SPEED = 22; // m/s, tangential wind speed at the core radius
const ARROW_SCALE = 0.85 / PEAK_SPEED; // km of arrow length per m/s of speed

const VECTORS = [];
for (let i = 0; i < GRID_N; i += 1) {
  for (let j = 0; j < GRID_N; j += 1) {
    const x = -DOMAIN + (2 * DOMAIN * i) / (GRID_N - 1);
    const y = -DOMAIN + (2 * DOMAIN * j) / (GRID_N - 1);
    const r = Math.sqrt(x * x + y * y) + 1e-6;
    const speed = r <= CORE_RADIUS ? (PEAK_SPEED * r) / CORE_RADIUS : (PEAK_SPEED * CORE_RADIUS) / r;
    const u = (-y / r) * speed; // horizontal component (dx)
    const v = (x / r) * speed; // vertical component (dy)
    VECTORS.push({ x, y, u, v, speed });
  }
}

// Interpolate between the two imprint_seq stops by a 0..1 fraction.
function lerpColor(hexA, hexB, frac) {
  const a = parseInt(hexA.slice(1), 16);
  const b = parseInt(hexB.slice(1), 16);
  const ar = (a >> 16) & 255, ag = (a >> 8) & 255, ab = a & 255;
  const br = (b >> 16) & 255, bg = (b >> 8) & 255, bb = b & 255;
  const rr = Math.round(ar + (br - ar) * frac);
  const rg = Math.round(ag + (bg - ag) * frac);
  const rb = Math.round(ab + (bb - ab) * frac);
  return `rgb(${rr}, ${rg}, ${rb})`;
}

// --- Arrows — drawn on the MUI X coordinate system via scale hooks ---------
function QuiverArrows() {
  const xScale = useXScale();
  const yScale = useYScale();
  const HEAD = 10; // px

  return (
    <g strokeLinecap="round">
      {VECTORS.map((vec, i) => {
        const x1 = xScale(vec.x);
        const y1 = yScale(vec.y);
        const x2 = xScale(vec.x + vec.u * ARROW_SCALE);
        const y2 = yScale(vec.y + vec.v * ARROW_SCALE);
        const frac = Math.min(1, vec.speed / PEAK_SPEED);
        const color = lerpColor(t.seq[0], t.seq[1], frac);
        const angle = Math.atan2(y2 - y1, x2 - x1);
        const a1 = angle - 0.4;
        const a2 = angle + 0.4;
        const headPoints = `${x2},${y2} ${x2 - HEAD * Math.cos(a1)},${y2 - HEAD * Math.sin(a1)} ${x2 - HEAD * Math.cos(a2)},${y2 - HEAD * Math.sin(a2)}`;
        return (
          <g key={i}>
            <line x1={x1} y1={y1} x2={x2} y2={y2} stroke={color} strokeWidth={2.2} />
            <polygon points={headPoints} fill={color} />
          </g>
        );
      })}
    </g>
  );
}

// Colorbar gradient encoding wind speed magnitude.
function Colorbar() {
  const { left, top, width: gW, height: gH } = useDrawingArea();
  const cbX = left + gW + 26;
  const cbW = 18;

  return (
    <>
      <defs>
        <linearGradient id="quiverSpeedGrad" x1="0" y1="1" x2="0" y2="0">
          <stop offset="0%" stopColor={t.seq[0]} />
          <stop offset="100%" stopColor={t.seq[1]} />
        </linearGradient>
      </defs>
      <rect x={cbX} y={top} width={cbW} height={gH} fill="url(#quiverSpeedGrad)" />
      <text x={cbX + cbW / 2} y={top - 8} textAnchor="middle" fontSize={13} fill={t.inkSoft} fontFamily={FONT}>
        {PEAK_SPEED}
      </text>
      <text x={cbX + cbW / 2} y={top + gH + 18} textAnchor="middle" fontSize={13} fill={t.inkSoft} fontFamily={FONT}>
        0
      </text>
      <text
        x={cbX + cbW + 20}
        y={top + gH / 2}
        textAnchor="middle"
        fontSize={14}
        fill={t.inkSoft}
        fontFamily={FONT}
        transform={`rotate(90, ${cbX + cbW + 20}, ${top + gH / 2})`}
      >
        Wind Speed (m/s)
      </text>
    </>
  );
}

function ChartTitle({ text, fontSize }) {
  const { left, top, width: gW } = useDrawingArea();
  return (
    <text
      x={left + gW / 2}
      y={top - 62}
      textAnchor="middle"
      fontSize={fontSize}
      fontWeight={600}
      fill={t.ink}
      fontFamily={FONT}
    >
      {text}
    </text>
  );
}

export default function Chart() {
  const W = window.ANYPLOT_SIZE.width;
  const H = window.ANYPLOT_SIZE.height;

  const title = "Cyclonic Wind Field · quiver-basic · javascript · muix · anyplot.ai";
  const titleSize = title.length > 67 ? Math.round(22 * (67 / title.length)) : 22;

  const pad = 0.8;

  return (
    <ChartContainer
      width={W}
      height={H}
      skipAnimation
      series={[]}
      xAxis={[{ scaleType: "linear", min: -DOMAIN - pad, max: DOMAIN + pad, label: "X Position (km)" }]}
      yAxis={[{ scaleType: "linear", min: -DOMAIN - pad, max: DOMAIN + pad, label: "Y Position (km)" }]}
      margin={{ top: 130, right: 170, bottom: 100, left: 100 }}
    >
      <ChartTitle text={title} fontSize={titleSize} />
      <QuiverArrows />
      <Colorbar />
      <ChartsXAxis labelStyle={{ fontSize: 16 }} tickLabelStyle={{ fontSize: 14 }} />
      <ChartsYAxis labelStyle={{ fontSize: 16 }} tickLabelStyle={{ fontSize: 14 }} />
    </ChartContainer>
  );
}
Runnable source as JSON, for any HTTP client: https://api.anyplot.ai/specs/quiver-basic/muix/code. Any spec id and library id listed in llms-full.txt fit the same URL shape; every URL below is complete and callable.
{
  "spec_id": "quiver-basic",
  "language": "javascript",
  "library": "muix",
  "page": "https://anyplot.ai/quiver-basic/javascript/muix",
  "hub": "https://anyplot.ai/quiver-basic",
  "code_json": "https://api.anyplot.ai/specs/quiver-basic/muix/code",
  "spec_json": "https://api.anyplot.ai/specs/quiver-basic",
  "render_light_png": "https://storage.googleapis.com/anyplot-images/plots/quiver-basic/javascript/muix/plot-light.png",
  "render_dark_png": "https://storage.googleapis.com/anyplot-images/plots/quiver-basic/javascript/muix/plot-dark.png",
  "interactive_light_html": "https://storage.googleapis.com/anyplot-images/plots/quiver-basic/javascript/muix/plot-light.html",
  "interactive_dark_html": "https://storage.googleapis.com/anyplot-images/plots/quiver-basic/javascript/muix/plot-dark.html",
  "quality_score": 91.0,
  "license": "MIT",
  "guide": "https://anyplot.ai/llms.txt"
}
Part of Basic Quiver Plot on anyplot.ai.