The same plot in 14 other libraries — JavaScript: Chart.js, D3.js, Highcharts, MUI X Charts; Python: Altair, Bokeh, lets-plot, Matplotlib, Plotly, plotnine, Pygal, Seaborn; R: ggplot2; Julia: Makie.jl. Compare all 15 side by side: Basic Quiver Plot in Python, R, Julia and JavaScript.
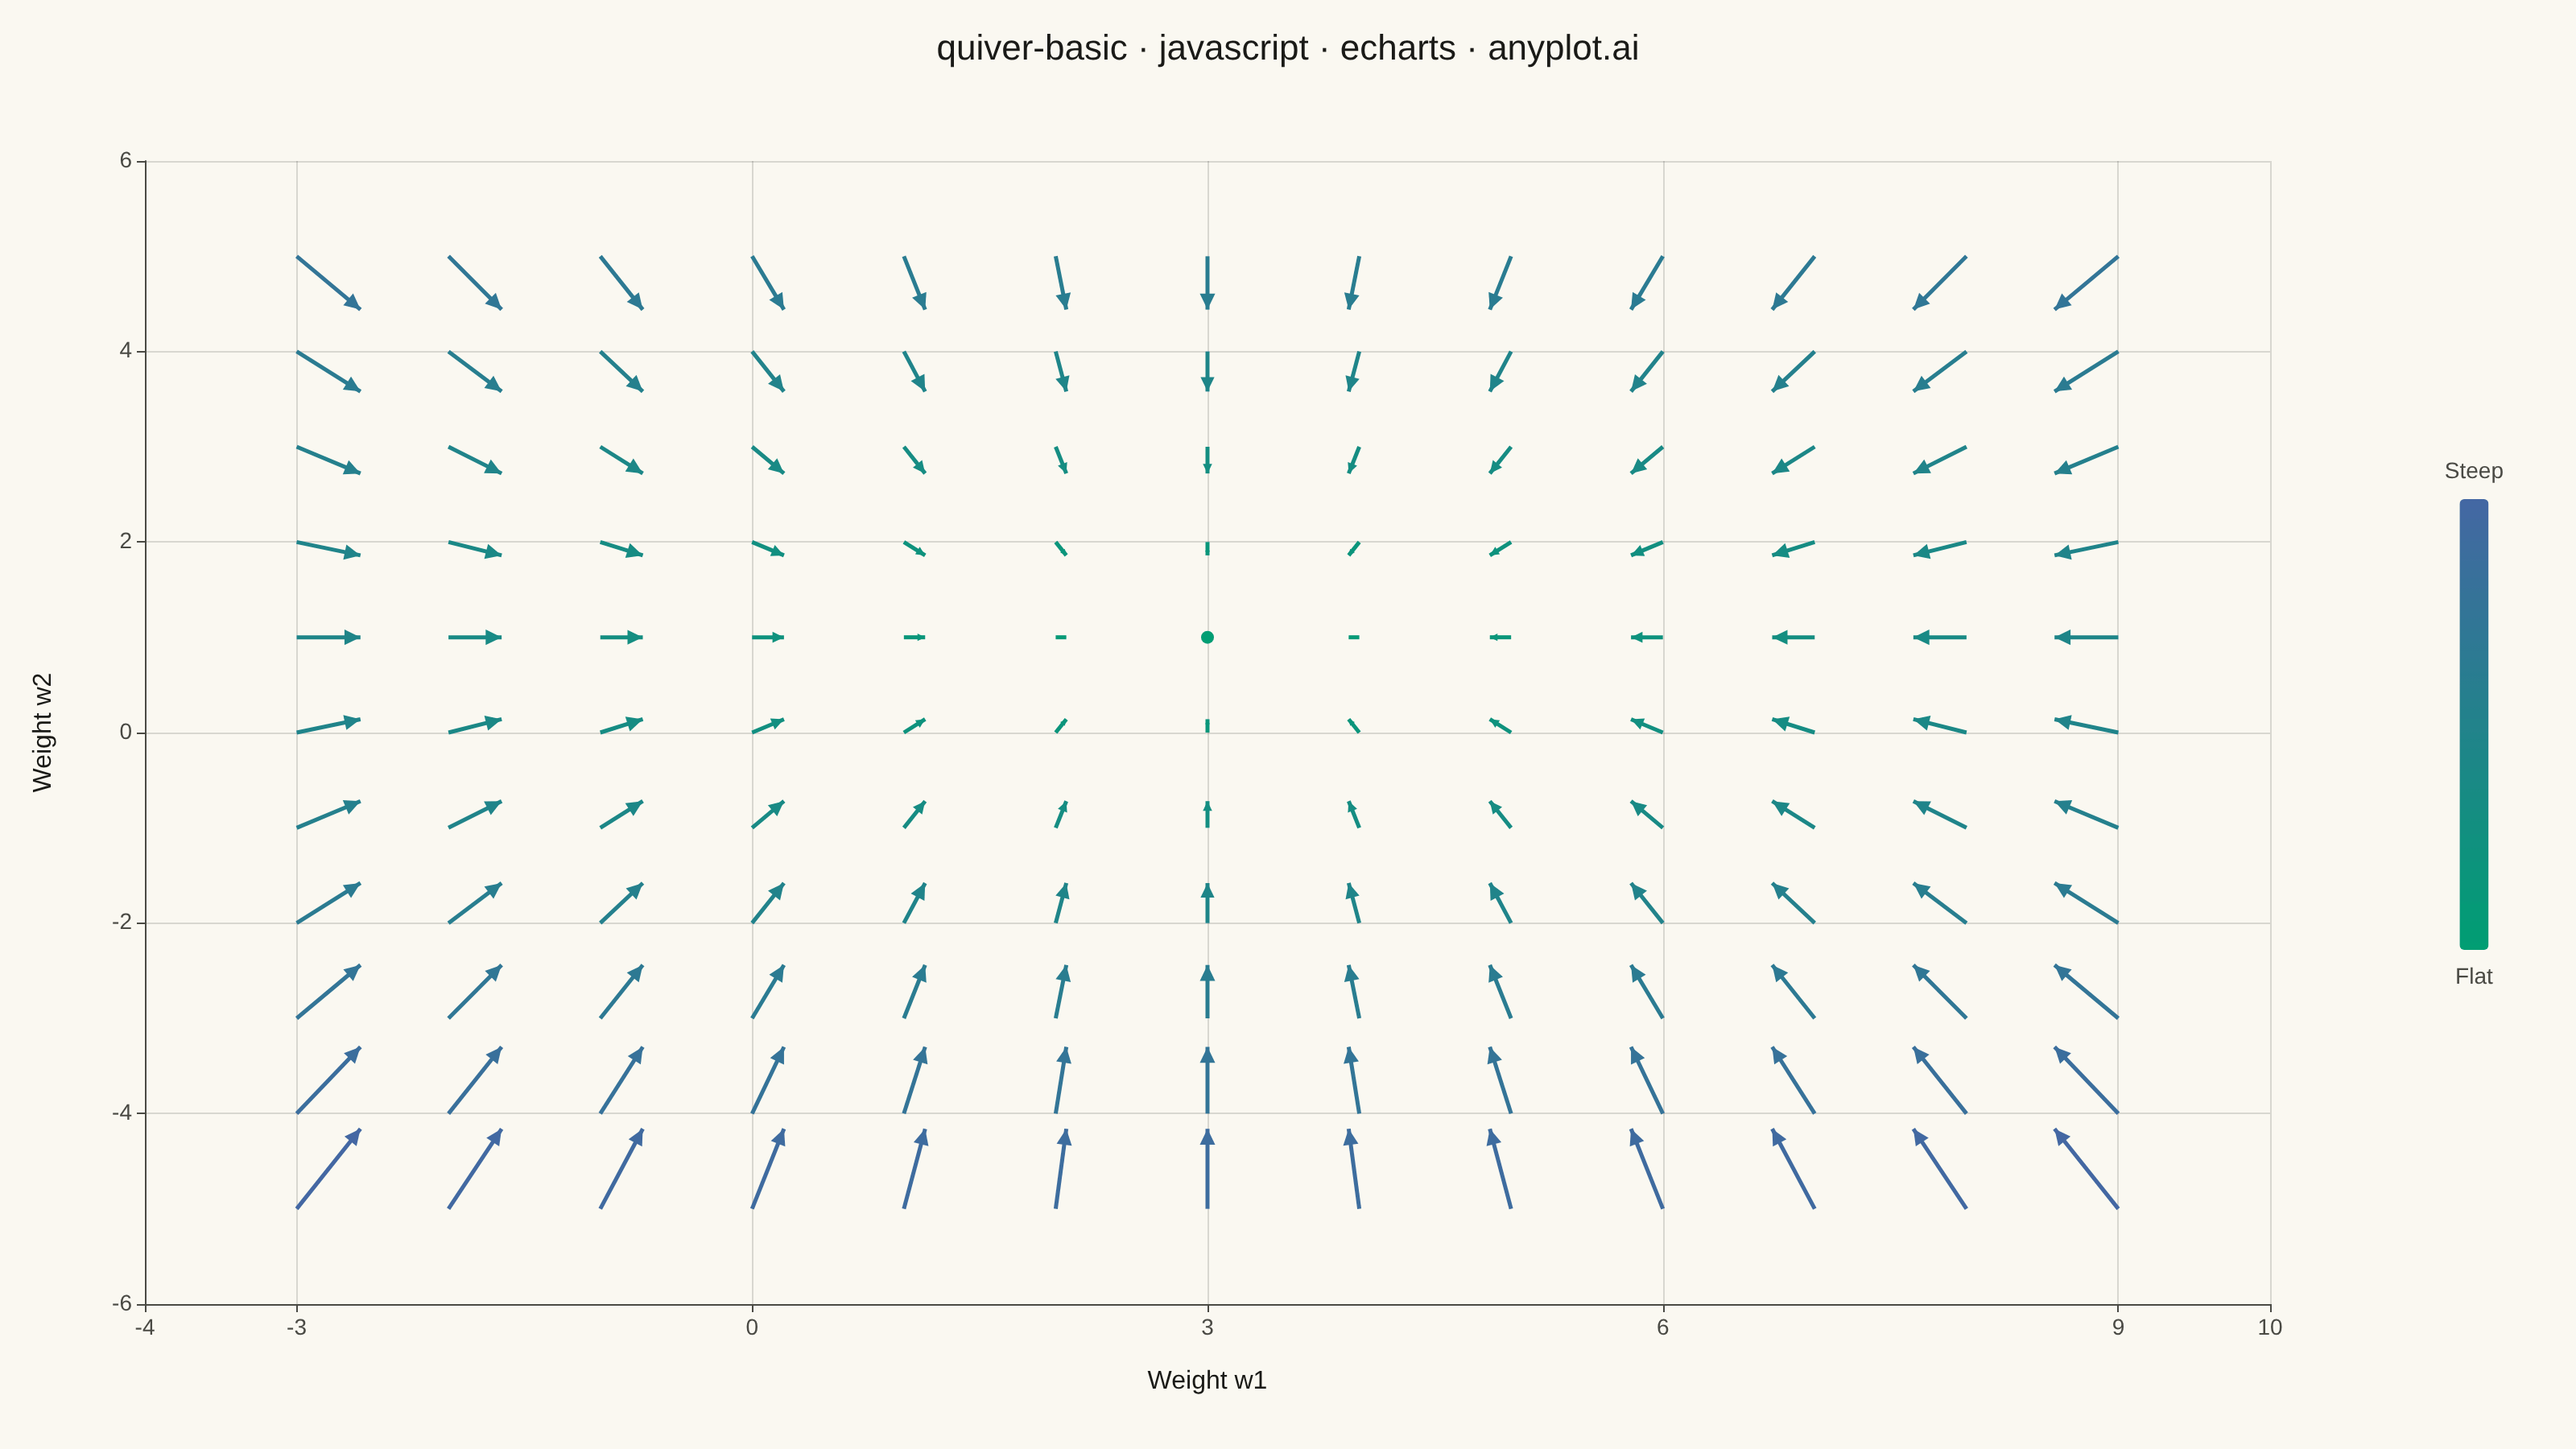
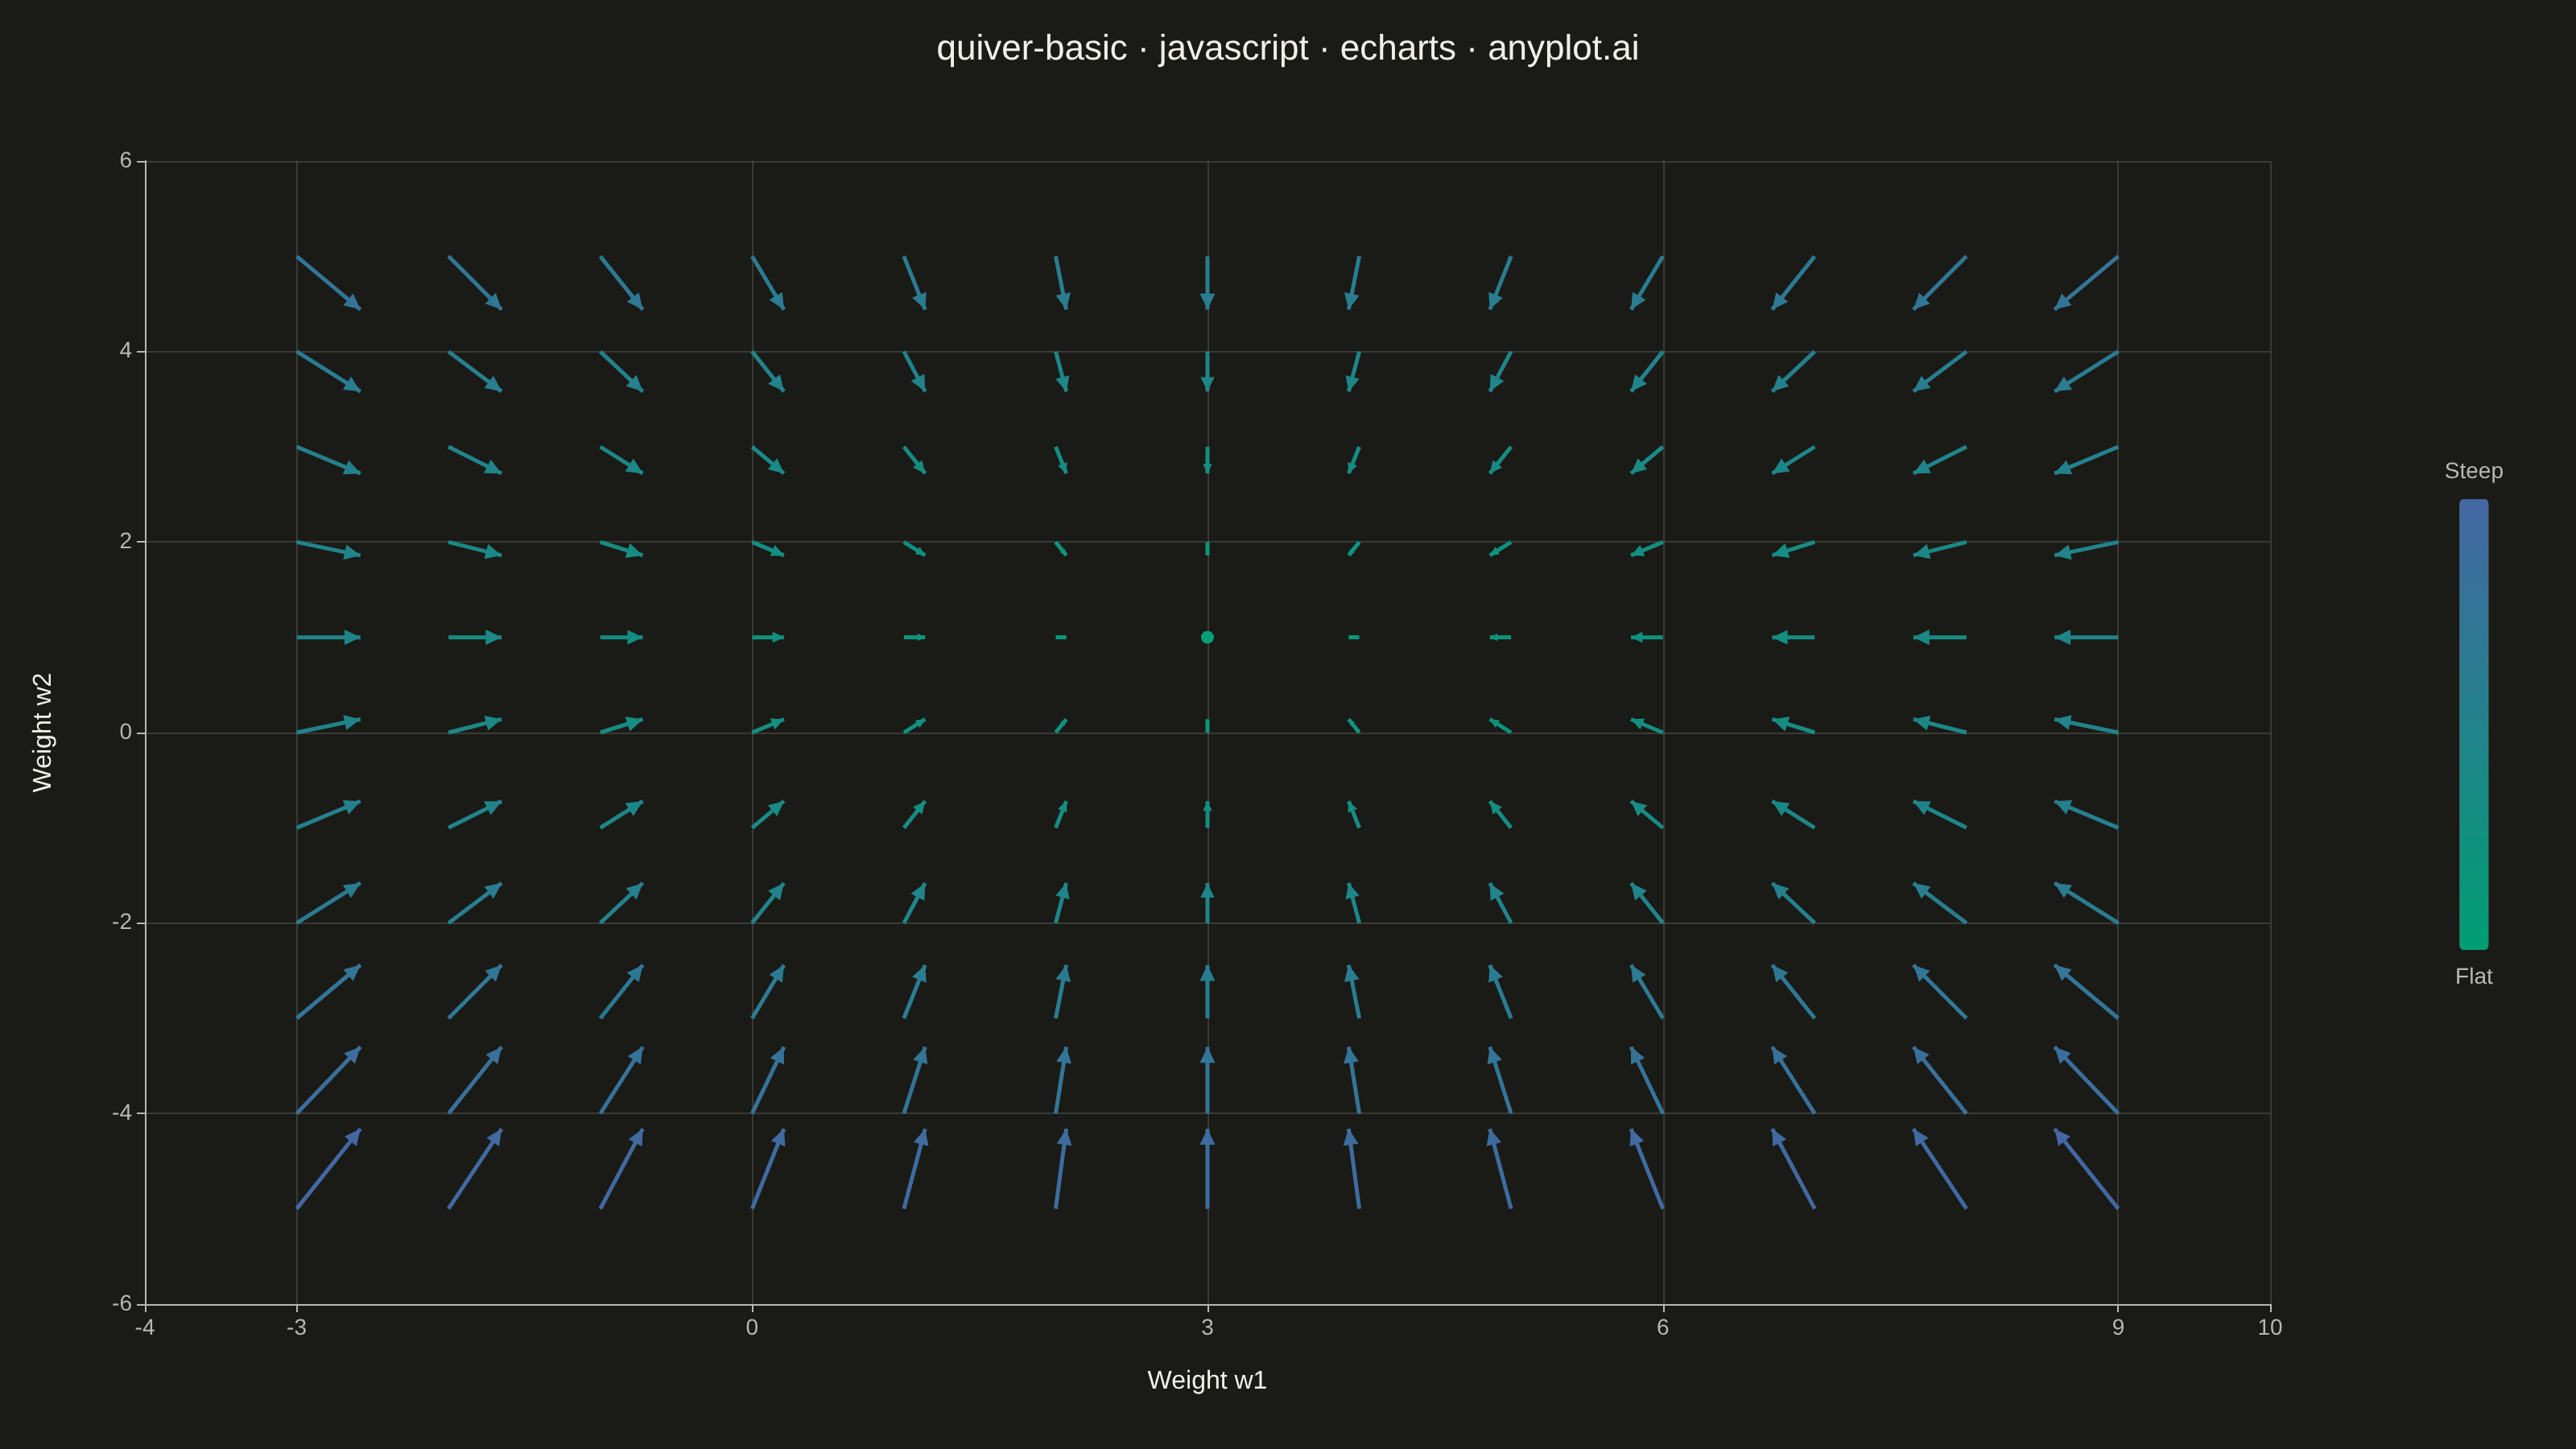
A quiver plot displays vector fields using arrows positioned at grid points. Each arrow represents a vector at that location, with direction indicating the vector's angle and length proportional to its magnitude. This visualization reveals flow patterns, gradients, and field structure in two-dimensional data.
// anyplot.ai
// quiver-basic: Basic Quiver Plot
// Library: echarts 6.1.0 | JavaScript 22.23.1
// Quality: 90/100 | Created: 2026-07-24
//# anyplot-orientation: landscape

const t = window.ANYPLOT_TOKENS;

// --- Data: negative-gradient field over an elliptic loss bowl ---------------
// Steepest-descent direction at each grid point of a toy 2-parameter loss
// surface L(w1, w2) = A/2 * (w1 - MIN_W1)^2 + B/2 * (w2 - MIN_W2)^2.
const ARROW_SCALE = 0.28;
const A = 0.25;
const B = 0.5;
const MIN_W1 = 3;
const MIN_W2 = 1;

const arrows = [];
for (let w1 = -3; w1 <= 9; w1 += 1) {
  for (let w2 = -5; w2 <= 5; w2 += 1) {
    const gradW1 = A * (w1 - MIN_W1);
    const gradW2 = B * (w2 - MIN_W2);
    const u = -gradW1;
    const v = -gradW2;
    const magnitude = Math.hypot(gradW1, gradW2);
    arrows.push([w1, w2, u, v, magnitude]);
  }
}
const maxMagnitude = Math.max(...arrows.map((d) => d[4]));

// --- Render one arrow (shaft + arrowhead); a dot marks zero-gradient points -
function renderArrow(_params, api) {
  const w1 = api.value(0);
  const w2 = api.value(1);
  const u = api.value(2);
  const v = api.value(3);
  const color = api.visual("color");

  const start = api.coord([w1, w2]);
  const end = api.coord([w1 + u * ARROW_SCALE, w2 + v * ARROW_SCALE]);
  const dx = end[0] - start[0];
  const dy = end[1] - start[1];
  const length = Math.hypot(dx, dy);

  if (length < 3) {
    return {
      type: "circle",
      shape: { cx: start[0], cy: start[1], r: 4 },
      style: { fill: color },
    };
  }

  const angle = Math.atan2(dy, dx);
  const headLength = Math.min(11, length * 0.4);
  const headAngle = Math.PI / 7;
  const left = [
    end[0] - headLength * Math.cos(angle - headAngle),
    end[1] - headLength * Math.sin(angle - headAngle),
  ];
  const right = [
    end[0] - headLength * Math.cos(angle + headAngle),
    end[1] - headLength * Math.sin(angle + headAngle),
  ];

  return {
    type: "group",
    children: [
      {
        type: "line",
        shape: { x1: start[0], y1: start[1], x2: end[0], y2: end[1] },
        style: { stroke: color, lineWidth: 2.5 },
      },
      {
        type: "polygon",
        shape: { points: [end, left, right] },
        style: { fill: color },
      },
    ],
  };
}

// --- Init ---------------------------------------------------------------
const chart = echarts.init(document.getElementById("container"));

// --- Option ---------------------------------------------------------------
chart.setOption({
  animation: false,
  backgroundColor: "transparent",
  title: {
    text: "quiver-basic · javascript · echarts · anyplot.ai",
    left: "center",
    textStyle: { color: t.ink, fontSize: 22, fontWeight: 500 },
  },
  grid: { left: 90, right: 190, top: 100, bottom: 90 },
  xAxis: {
    type: "value",
    name: "Weight w1",
    nameLocation: "middle",
    nameGap: 40,
    nameTextStyle: { color: t.ink, fontSize: 16 },
    min: -4,
    max: 10,
    axisLabel: { color: t.inkSoft, fontSize: 14 },
    axisLine: { onZero: false, lineStyle: { color: t.inkSoft } },
    splitLine: { lineStyle: { color: t.grid } },
  },
  yAxis: {
    type: "value",
    name: "Weight w2",
    nameLocation: "middle",
    nameGap: 55,
    nameTextStyle: { color: t.ink, fontSize: 16 },
    min: -6,
    max: 6,
    axisLabel: { color: t.inkSoft, fontSize: 14 },
    axisLine: { onZero: false, lineStyle: { color: t.inkSoft } },
    splitLine: { lineStyle: { color: t.grid } },
  },
  visualMap: {
    type: "continuous",
    dimension: 4,
    seriesIndex: 0,
    min: 0,
    max: maxMagnitude,
    right: 30,
    top: "middle",
    itemWidth: 18,
    itemHeight: 280,
    text: ["Steep", "Flat"],
    textStyle: { color: t.inkSoft, fontSize: 14 },
    inRange: { color: t.seq },
  },
  series: [
    {
      type: "custom",
      renderItem: renderArrow,
      data: arrows,
      encode: { x: 0, y: 1 },
    },
  ],
});
Runnable source as JSON, for any HTTP client: https://api.anyplot.ai/specs/quiver-basic/echarts/code. Any spec id and library id listed in llms-full.txt fit the same URL shape; every URL below is complete and callable.
{
  "spec_id": "quiver-basic",
  "language": "javascript",
  "library": "echarts",
  "page": "https://anyplot.ai/quiver-basic/javascript/echarts",
  "hub": "https://anyplot.ai/quiver-basic",
  "code_json": "https://api.anyplot.ai/specs/quiver-basic/echarts/code",
  "spec_json": "https://api.anyplot.ai/specs/quiver-basic",
  "render_light_png": "https://storage.googleapis.com/anyplot-images/plots/quiver-basic/javascript/echarts/plot-light.png",
  "render_dark_png": "https://storage.googleapis.com/anyplot-images/plots/quiver-basic/javascript/echarts/plot-dark.png",
  "interactive_light_html": "https://storage.googleapis.com/anyplot-images/plots/quiver-basic/javascript/echarts/plot-light.html",
  "interactive_dark_html": "https://storage.googleapis.com/anyplot-images/plots/quiver-basic/javascript/echarts/plot-dark.html",
  "quality_score": 90.0,
  "license": "MIT",
  "guide": "https://anyplot.ai/llms.txt"
}
Part of Basic Quiver Plot on anyplot.ai.