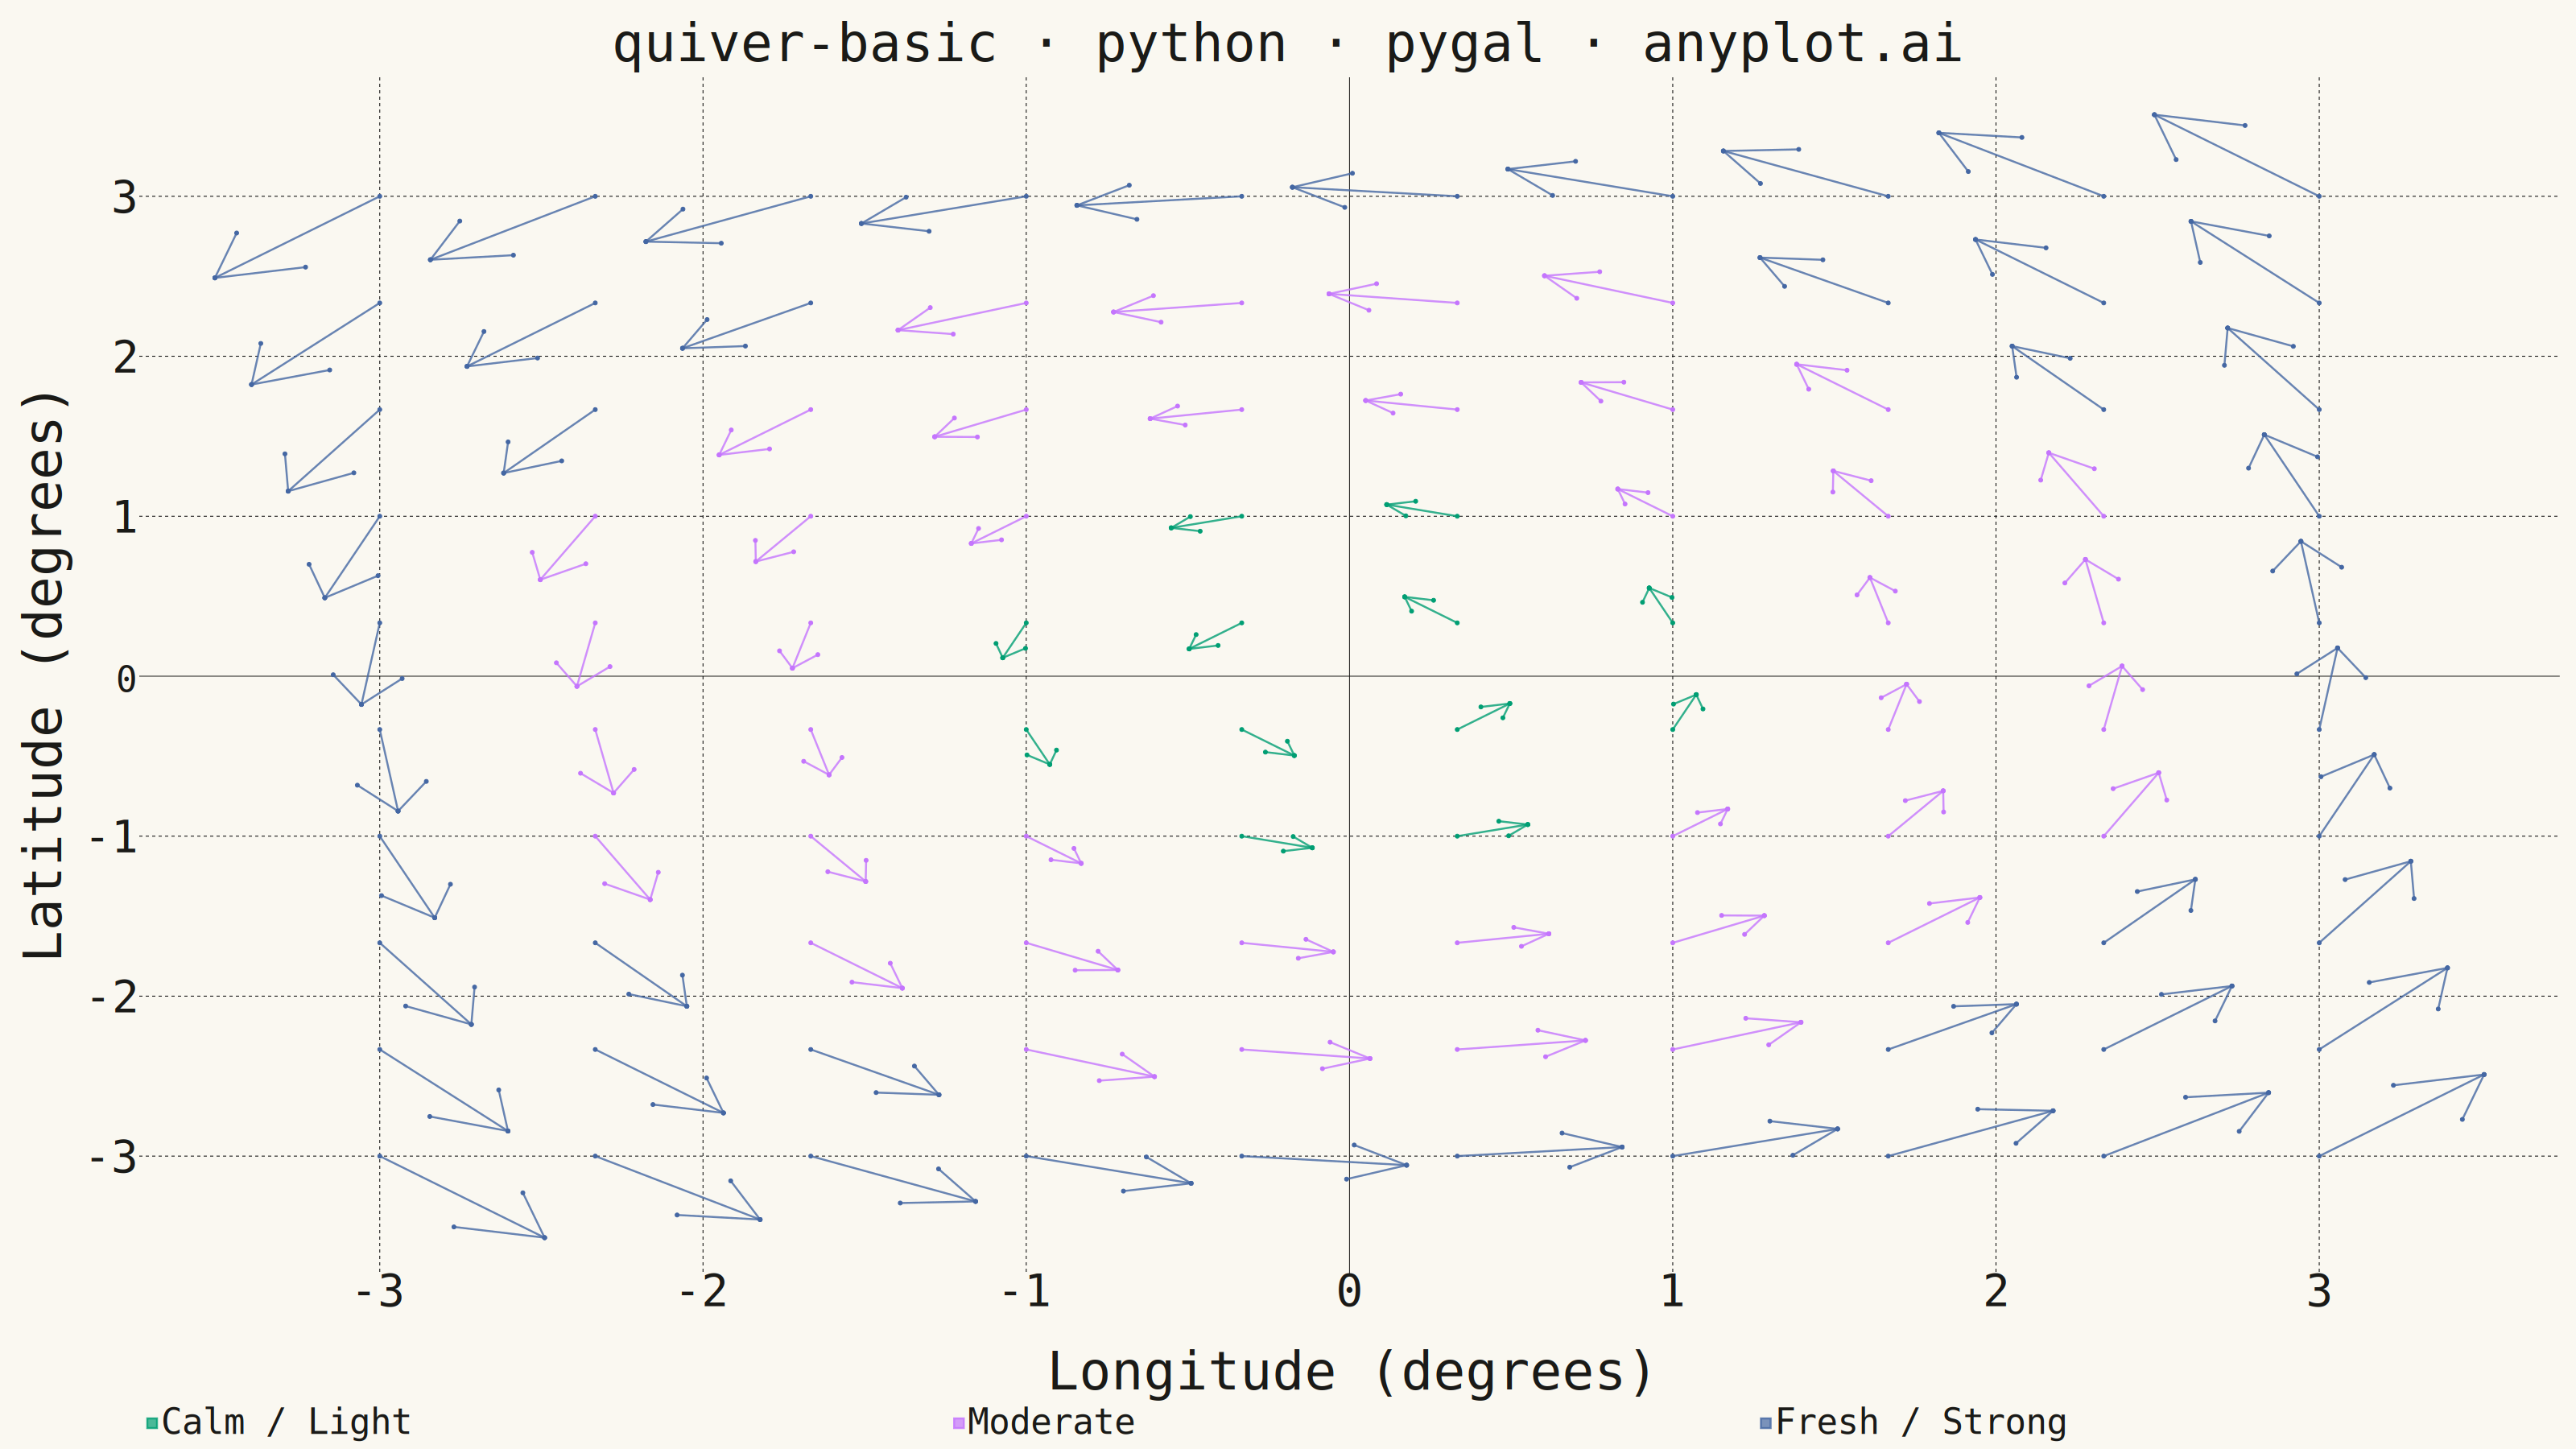
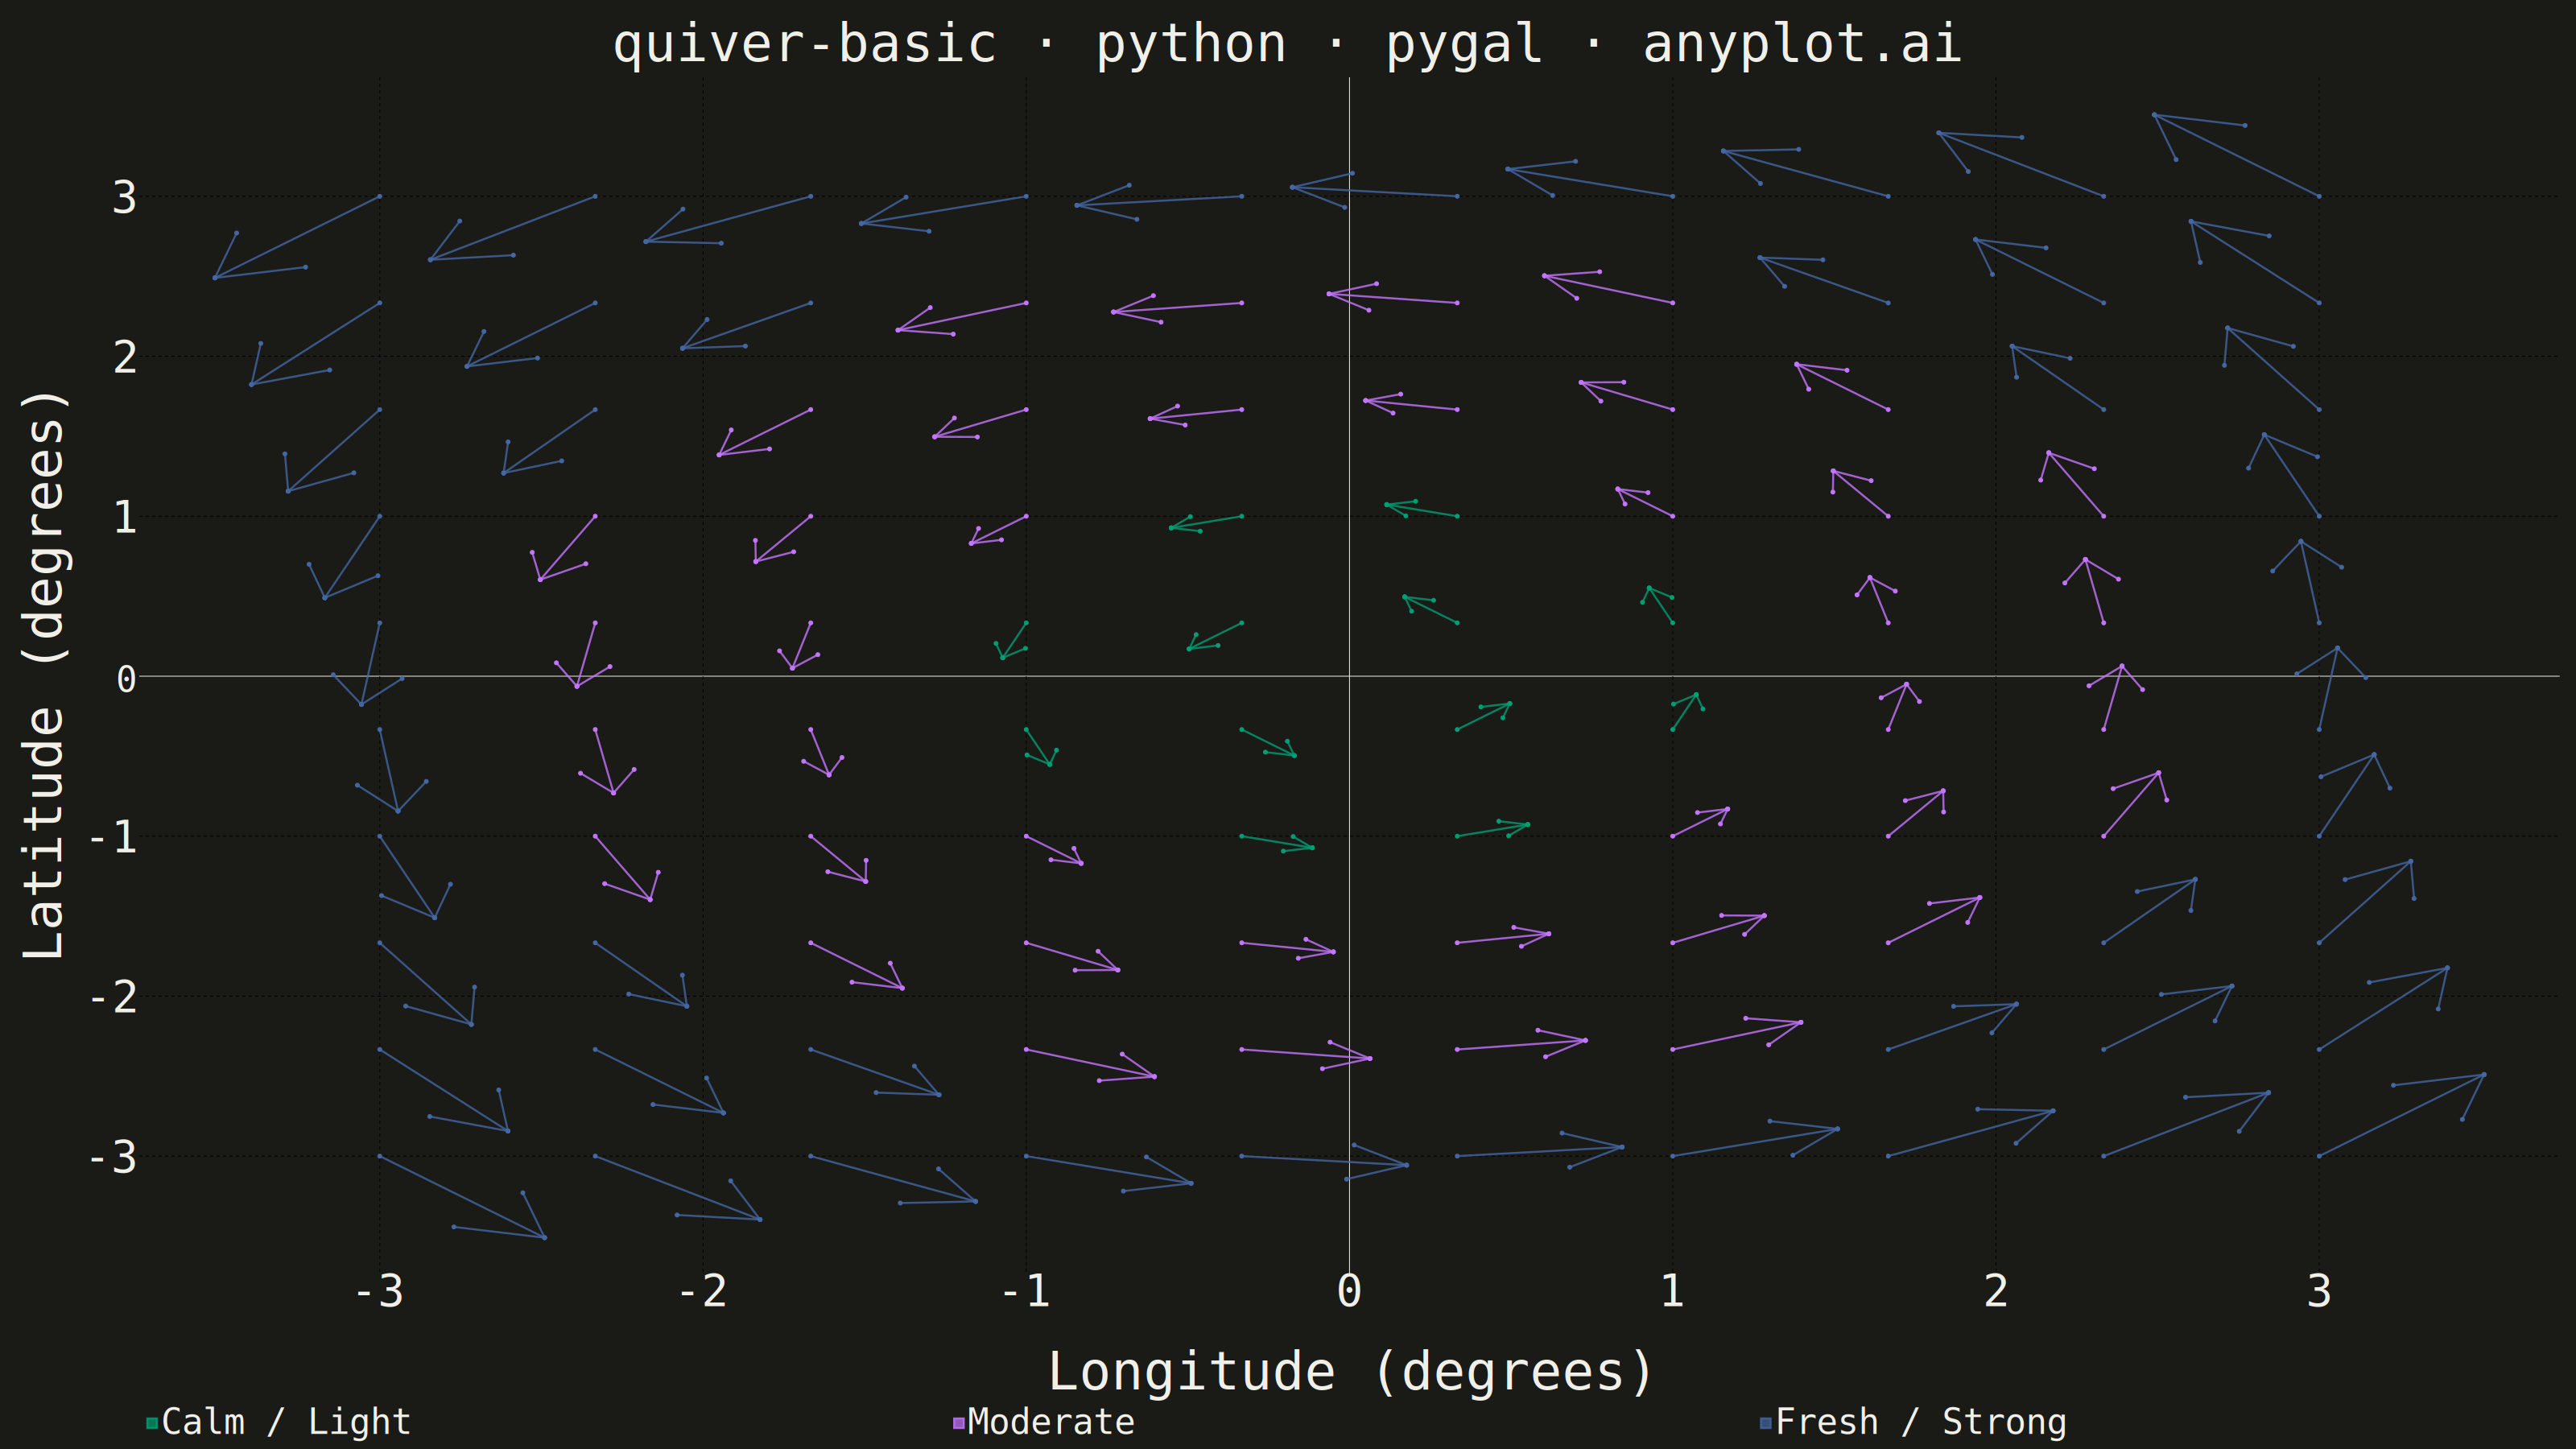
A quiver plot displays vector fields using arrows positioned at grid points. Each arrow represents a vector at that location, with direction indicating the vector's angle and length proportional to its magnitude. This visualization reveals flow patterns, gradients, and field structure in two-dimensional data.
""" anyplot.ai
quiver-basic: Basic Quiver Plot
Library: pygal 3.1.3 | Python 3.13.14
Quality: 86/100 | Updated: 2026-07-24
"""

import importlib
import os
import sys
from itertools import chain

import numpy as np


# Remove script dir so 'pygal' resolves to the installed package, not this file
_d = os.path.abspath(os.path.dirname(__file__))
sys.path = [p for p in sys.path if os.path.abspath(p) != _d]
os.chdir(_d)

pygal = importlib.import_module("pygal")
Style = importlib.import_module("pygal.style").Style

# Theme tokens
THEME = os.getenv("ANYPLOT_THEME", "light")
PAGE_BG = "#FAF8F1" if THEME == "light" else "#1A1A17"
INK = "#1A1A17" if THEME == "light" else "#F0EFE8"
INK_MUTED = "#6B6A63" if THEME == "light" else "#A8A79F"

IMPRINT = ("#009E73", "#C475FD", "#4467A3", "#BD8233", "#AE3030", "#2ABCCD", "#954477")

# Data — counterclockwise wind rotation around a low-pressure centre (u=-y, v=x)
np.random.seed(42)
grid_size = 10  # 10×10 = 100 arrows, matches the spec's suggested density floor
x_range = np.linspace(-3, 3, grid_size)
y_range = np.linspace(-3, 3, grid_size)
X, Y = np.meshgrid(x_range, y_range)
x_flat = X.flatten()
y_flat = Y.flatten()

U = -y_flat
V = x_flat
magnitude = np.sqrt(U**2 + V**2)
max_mag = magnitude.max()
norm_mag = magnitude / max_mag

# Scaled down from the 8×8 layout in proportion to the tighter grid spacing
# (6/7 -> 6/9) so the longest arrows still clear their neighbours.
arrow_scale = 0.17
min_arrow_len = 0.23  # floor so near-centre (low-magnitude) arrows stay visible

head_ratio = 0.40
head_angle = 0.55

num_bins = 3
wind_labels = ["Calm / Light", "Moderate", "Fresh / Strong"]
bin_colors = IMPRINT[:num_bins]

# Build each arrow as an isolated 9-item segment group, collected per bin
arrow_bins = [[] for _ in range(num_bins)]
for i in range(len(x_flat)):
    if magnitude[i] < 0.01:
        continue
    x1, y1 = x_flat[i], y_flat[i]
    arrow_len = max(magnitude[i] * arrow_scale, min_arrow_len)
    angle = np.arctan2(V[i], U[i])
    x2 = x1 + arrow_len * np.cos(angle)
    y2 = y1 + arrow_len * np.sin(angle)
    head_size = arrow_len * head_ratio
    xl = x2 - head_size * np.cos(angle - head_angle)
    yl = y2 - head_size * np.sin(angle - head_angle)
    xr = x2 - head_size * np.cos(angle + head_angle)
    yr = y2 - head_size * np.sin(angle + head_angle)
    bin_idx = min(int(norm_mag[i] * num_bins), num_bins - 1)
    # Each arrow = shaft + two barb segments, each terminated with None
    arrow_bins[bin_idx].append([(x1, y1), (x2, y2), None, (x2, y2), (xl, yl), None, (x2, y2), (xr, yr), None])

# Shuffle arrow order within each bin to break the spatial row-order band patterns
# that make consecutive arrows appear visually connected even with None breaks
rng = np.random.RandomState(42)
arrow_series = []
for i in range(num_bins):
    arrows = arrow_bins[i][:]
    rng.shuffle(arrows)
    arrow_series.append(list(chain.from_iterable(arrows)))

# Style — sizes are the pygal canonical values for a 3200×1800 canvas
# (prompts/library/pygal.md "Sizing + Theme")
custom_style = Style(
    background=PAGE_BG,
    plot_background=PAGE_BG,
    foreground=INK,
    foreground_strong=INK,
    foreground_subtle=INK_MUTED,
    colors=bin_colors,
    title_font_size=66,
    label_font_size=56,
    major_label_font_size=44,
    legend_font_size=44,
    value_font_size=36,
    stroke_width=2.5,
)

# Plot — thin strokes + dot markers at each segment endpoint clearly
# distinguish 100 discrete arrow positions rather than sweeping bands
chart = pygal.XY(
    style=custom_style,
    width=3200,
    height=1800,
    stroke=True,
    stroke_style={"width": 7},
    show_dots=True,
    dot_size=3,
    show_legend=True,
    legend_at_bottom=True,
    legend_at_bottom_columns=3,
    title="quiver-basic · python · pygal · anyplot.ai",
    x_title="Longitude (degrees)",
    y_title="Latitude (degrees)",
    show_x_guides=True,
    show_y_guides=True,
    range=(-3.6, 3.6),
    xrange=(-3.6, 3.6),
)

for i in range(num_bins):
    if arrow_series[i]:
        chart.add(wind_labels[i], arrow_series[i], allow_interruptions=True)

# Save
chart.render_to_png(f"plot-{THEME}.png")
with open(f"plot-{THEME}.html", "wb") as f:
    f.write(chart.render())
Runnable source as JSON, for any HTTP client: https://api.anyplot.ai/specs/quiver-basic/pygal/code. Any spec id and library id listed in llms-full.txt fit the same URL shape; every URL below is complete and callable.
{
  "spec_id": "quiver-basic",
  "language": "python",
  "library": "pygal",
  "page": "https://anyplot.ai/quiver-basic/python/pygal",
  "hub": "https://anyplot.ai/quiver-basic",
  "code_json": "https://api.anyplot.ai/specs/quiver-basic/pygal/code",
  "spec_json": "https://api.anyplot.ai/specs/quiver-basic",
  "render_light_png": "https://storage.googleapis.com/anyplot-images/plots/quiver-basic/python/pygal/plot-light.png",
  "render_dark_png": "https://storage.googleapis.com/anyplot-images/plots/quiver-basic/python/pygal/plot-dark.png",
  "interactive_light_html": "https://storage.googleapis.com/anyplot-images/plots/quiver-basic/python/pygal/plot-light.html",
  "interactive_dark_html": "https://storage.googleapis.com/anyplot-images/plots/quiver-basic/python/pygal/plot-dark.html",
  "quality_score": 86.0,
  "license": "MIT",
  "guide": "https://anyplot.ai/llms.txt"
}
Part of Basic Quiver Plot on anyplot.ai.