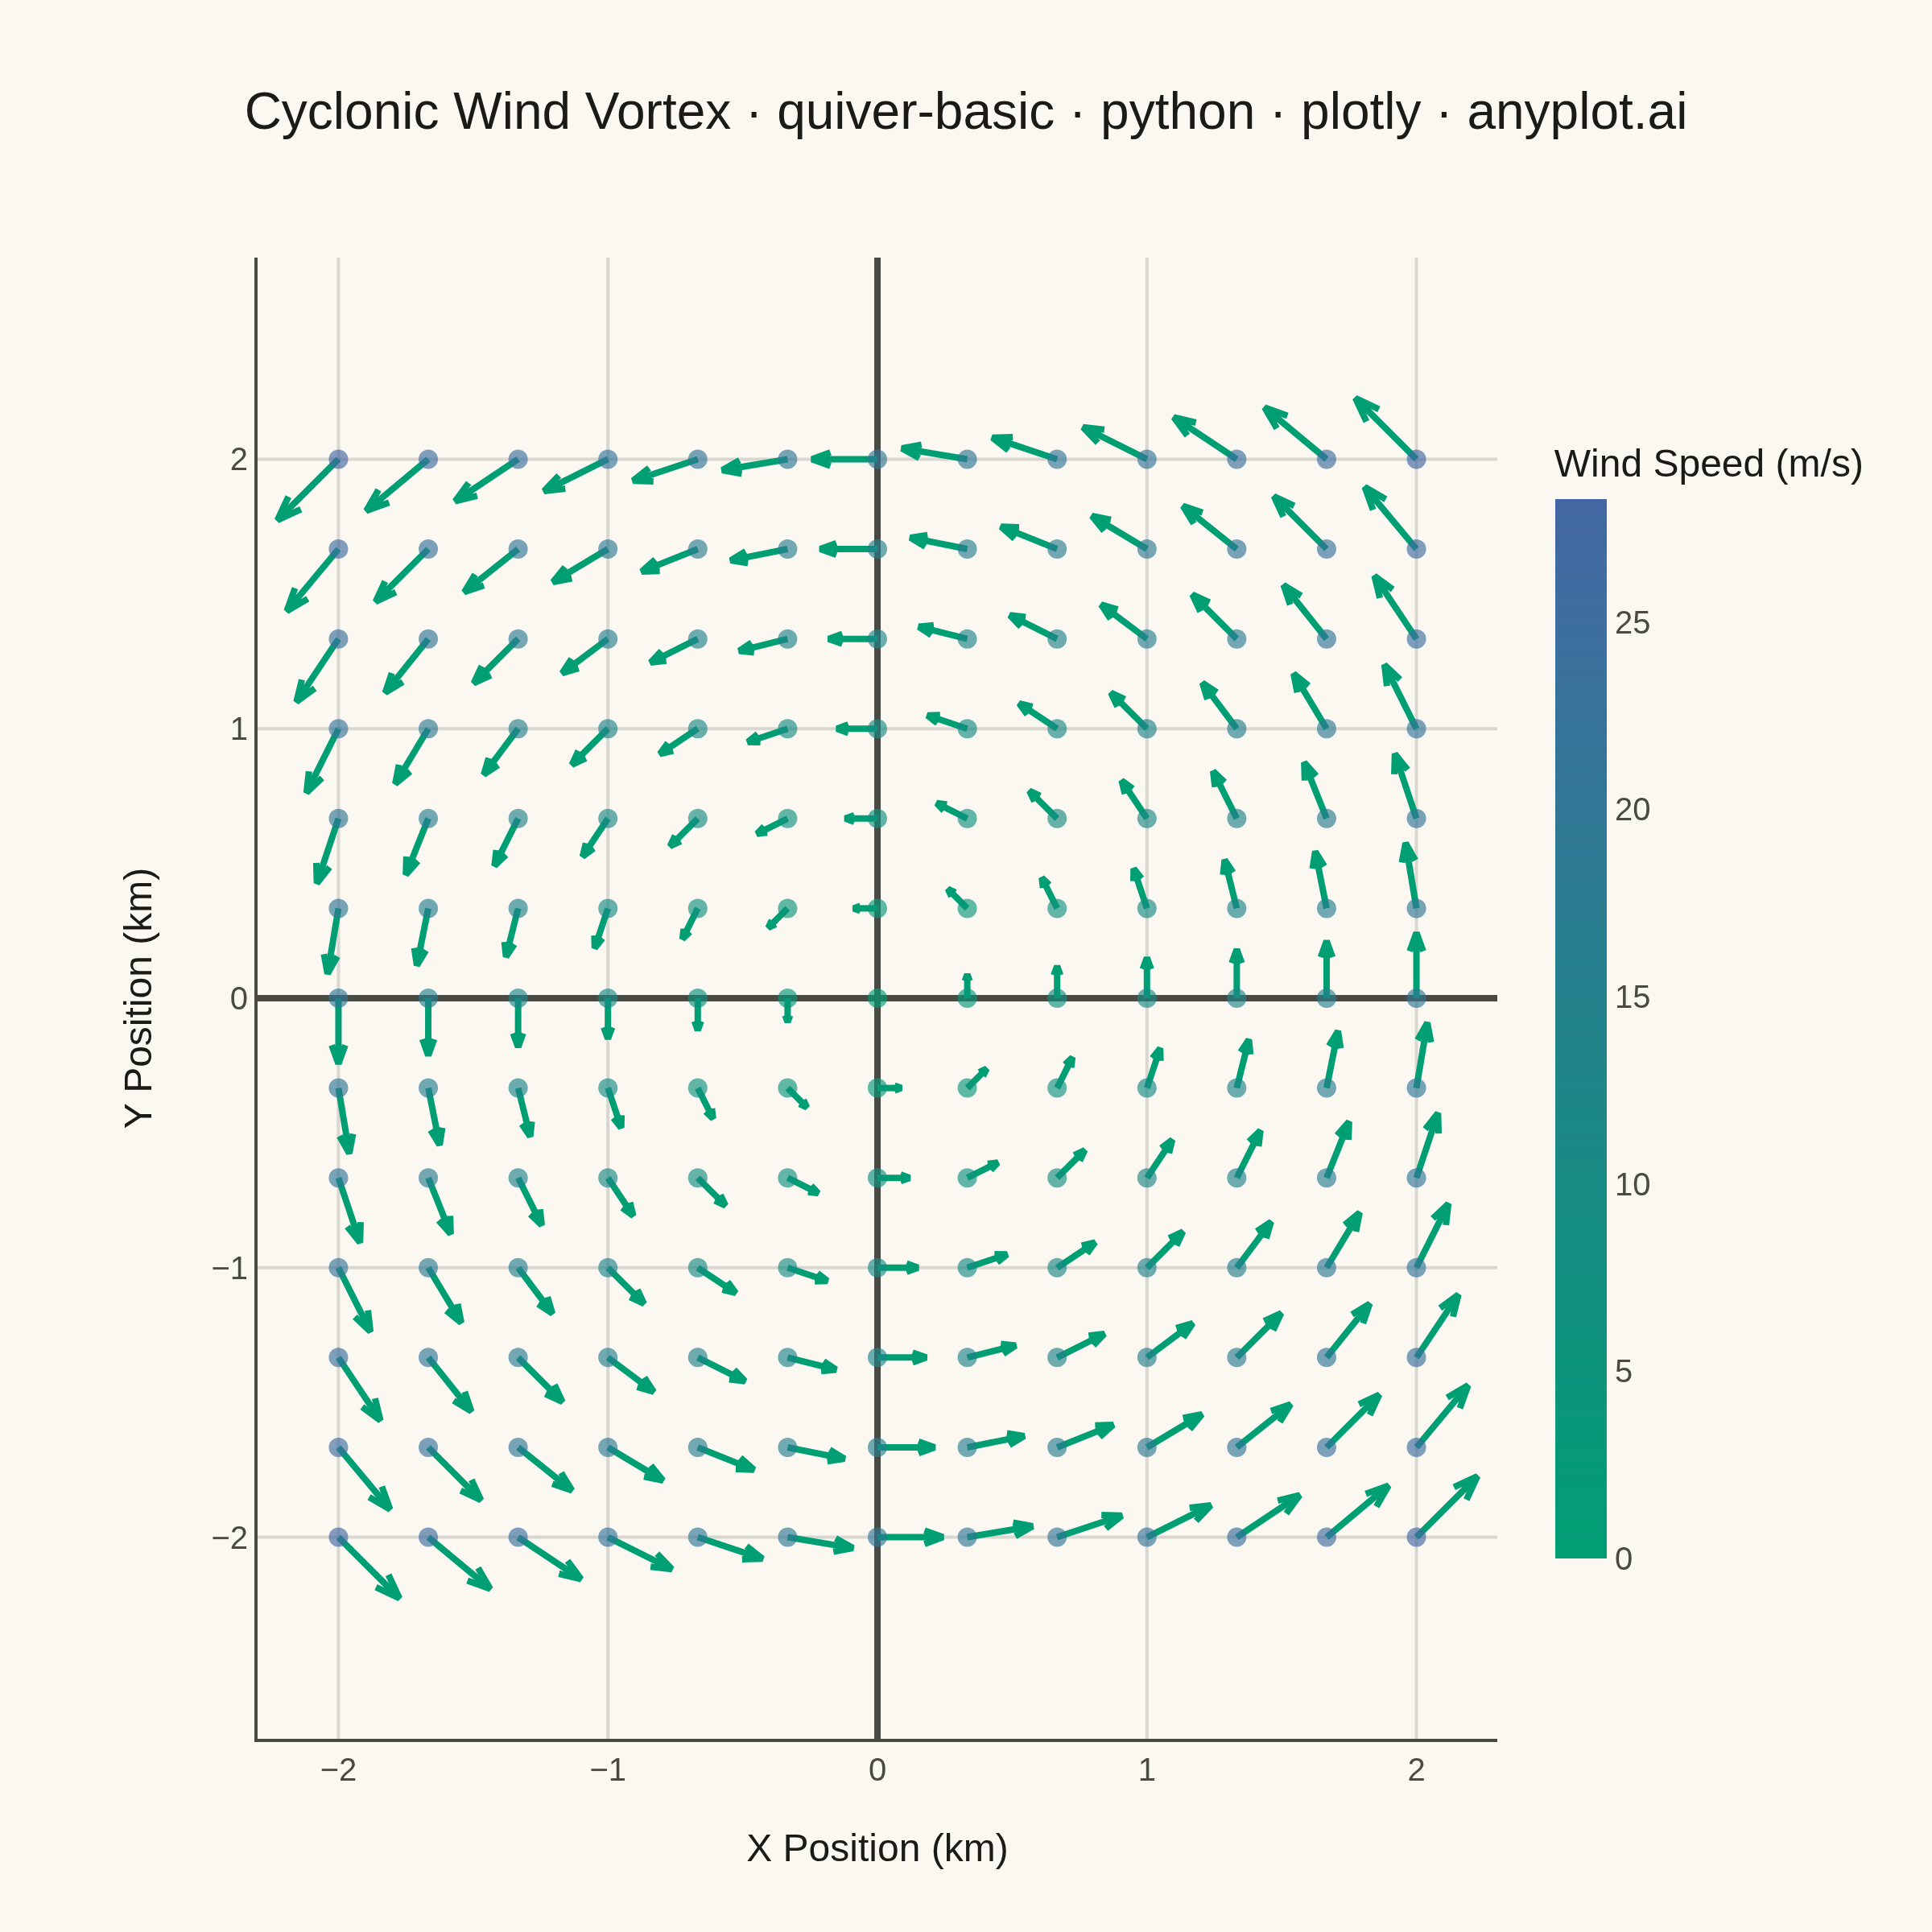
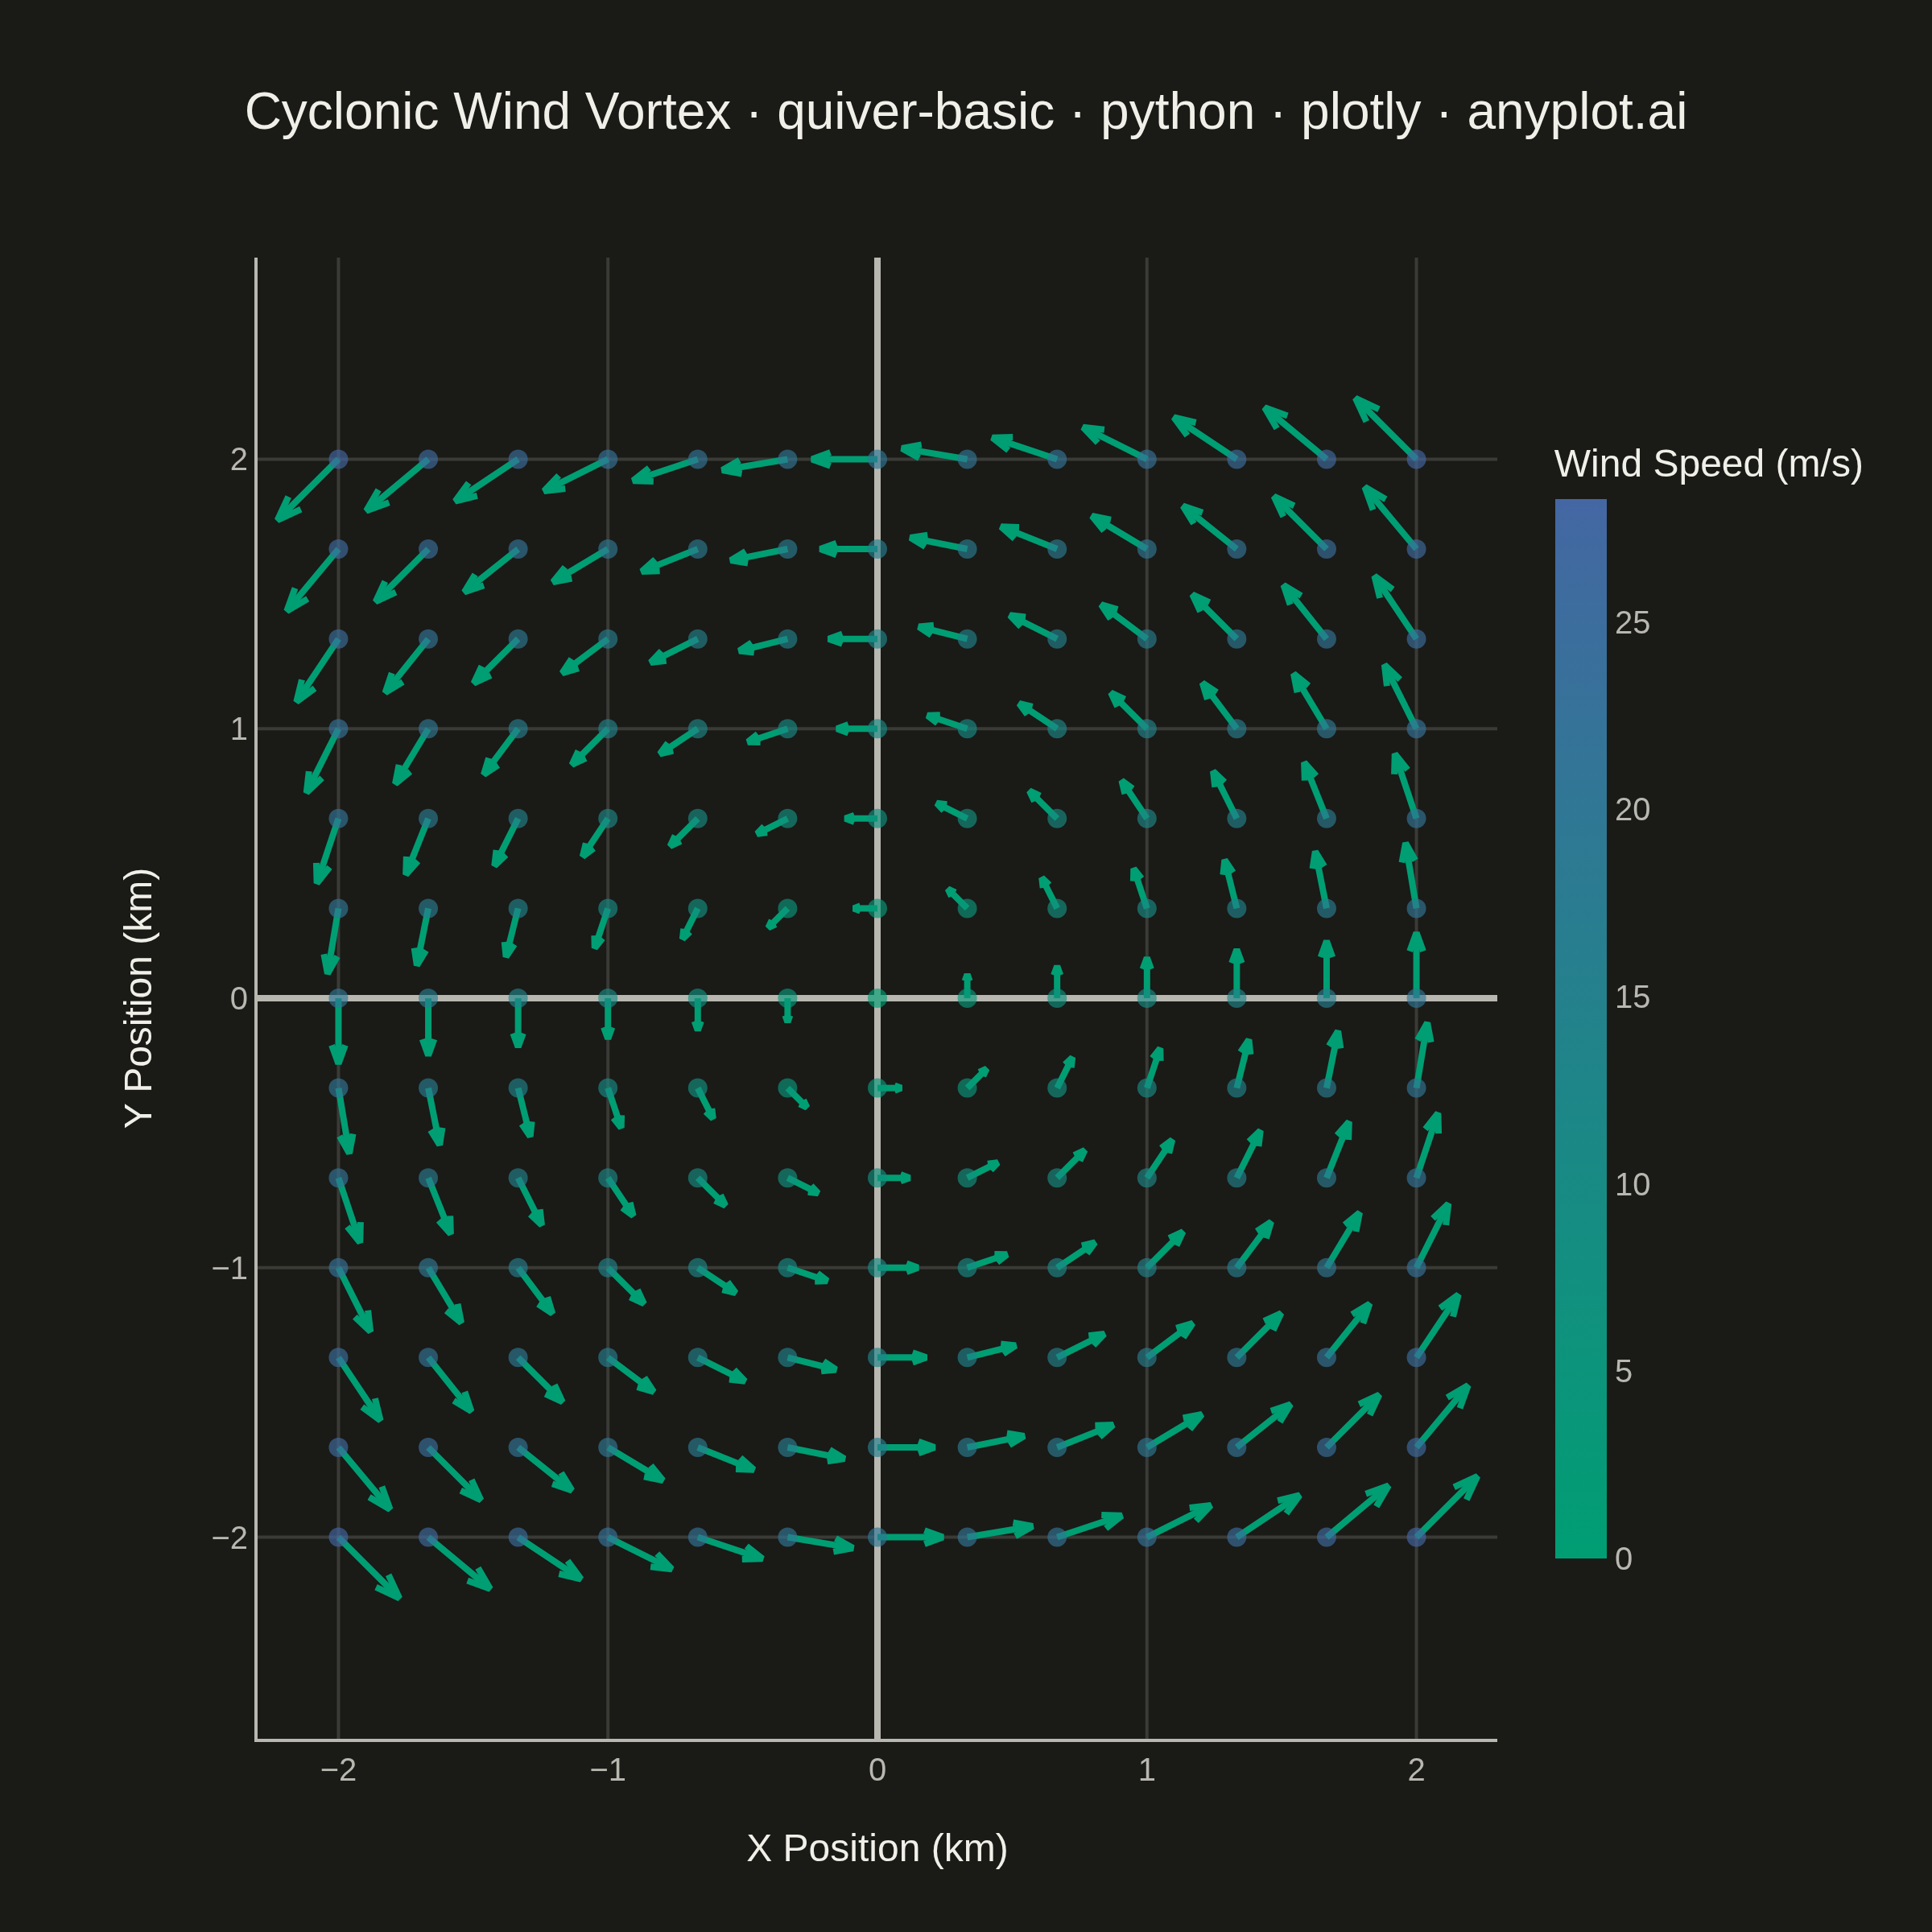
A quiver plot displays vector fields using arrows positioned at grid points. Each arrow represents a vector at that location, with direction indicating the vector's angle and length proportional to its magnitude. This visualization reveals flow patterns, gradients, and field structure in two-dimensional data.
""" anyplot.ai
quiver-basic: Basic Quiver Plot
Library: plotly 6.9.0 | Python 3.13.14
Quality: 85/100 | Updated: 2026-07-24
"""

import os
import sys


# Prevent this file from shadowing the installed plotly package
_this_dir = os.path.dirname(os.path.abspath(__file__))
sys.path = [p for p in sys.path if os.path.abspath(p) != _this_dir]

import numpy as np
import plotly.figure_factory as ff
import plotly.graph_objects as go


THEME = os.getenv("ANYPLOT_THEME", "light")
PAGE_BG = "#FAF8F1" if THEME == "light" else "#1A1A17"
INK = "#1A1A17" if THEME == "light" else "#F0EFE8"
INK_SOFT = "#4A4A44" if THEME == "light" else "#B8B7B0"
GRID = "rgba(26,26,23,0.15)" if THEME == "light" else "rgba(240,239,232,0.15)"

# Imprint palette — brand green is always the first (and here, only) series color
BRAND = "#009E73"
# Continuous magnitude is single-polarity (0 -> max), so the sequential Imprint cmap applies
imprint_seq = [[0.0, "#009E73"], [1.0, "#4467A3"]]

# Data - cyclonic wind vortex over a 4x4 km coastal grid (u = -y, v = x, m/s)
np.random.seed(42)
x_grid = np.linspace(-2, 2, 13)
y_grid = np.linspace(-2, 2, 13)
X, Y = np.meshgrid(x_grid, y_grid)

x = X.flatten()
y = Y.flatten()
# Cyclone-strength wind speeds (Beaufort ~5-30 m/s range) via a physical multiplier
WIND_SPEED_SCALE = 10.0
u = -Y.flatten() * WIND_SPEED_SCALE
v = X.flatten() * WIND_SPEED_SCALE

# True wind speed magnitude (0 at the eddy's calm centre, growing outward)
magnitude = np.sqrt(u**2 + v**2)
max_magnitude = magnitude.max()
safe_magnitude = np.where(magnitude == 0, 1e-6, magnitude)

# Arrow length scales with relative magnitude (proportional encoding), with a
# small floor so the calm-centre arrows stay visible instead of vanishing
scale_factor = 0.32
min_length_frac = 0.18
length_frac = min_length_frac + (1 - min_length_frac) * (magnitude / max_magnitude)
u_norm = (u / safe_magnitude) * length_frac * scale_factor
v_norm = (v / safe_magnitude) * length_frac * scale_factor

# Create quiver plot using figure_factory
fig = ff.create_quiver(x, y, u_norm, v_norm, scale=1, arrow_scale=0.3, line={"width": 2, "color": BRAND})

# Add scatter points at arrow bases for wind-speed coloring
fig.add_trace(
    go.Scatter(
        x=x,
        y=y,
        mode="markers",
        marker={
            "size": 6,
            "opacity": 0.65,
            "color": magnitude,
            "colorscale": imprint_seq,
            "colorbar": {
                "title": {"text": "Wind Speed (m/s)", "font": {"size": 12, "color": INK}},
                "tickfont": {"size": 10, "color": INK_SOFT},
                "thickness": 16,
                "outlinewidth": 0,
                "len": 0.8,
            },
            "showscale": True,
        },
        hovertemplate="x: %{x:.2f} km<br>y: %{y:.2f} km<br>speed: %{marker.color:.2f} m/s<extra></extra>",
    )
)

# Title fontsize scales linearly with length off the 67-char / 16px baseline
title = "Cyclonic Wind Vortex · quiver-basic · python · plotly · anyplot.ai"
ratio = 67 / len(title) if len(title) > 67 else 1.0
title_fontsize = max(11, round(16 * ratio))

# Layout for 2400x2400 px (Step 0 canonical square canvas — the vortex is
# radially symmetric with no preferred horizontal axis, and a square canvas
# avoids the wasted lateral space a 1:1 aspect-locked field would leave in a
# 16:9 frame)
fig.update_layout(
    autosize=False,
    width=600,
    height=600,
    title={"text": title, "font": {"size": title_fontsize, "color": INK}, "x": 0.5},
    xaxis={
        "title": {"text": "X Position (km)", "font": {"size": 12, "color": INK}},
        "tickfont": {"size": 10, "color": INK_SOFT},
        "range": [-2.3, 2.3],
        "showgrid": True,
        "gridcolor": GRID,
        "zeroline": True,
        "zerolinecolor": INK_SOFT,
        "linecolor": INK_SOFT,
    },
    yaxis={
        "title": {"text": "Y Position (km)", "font": {"size": 12, "color": INK}},
        "tickfont": {"size": 10, "color": INK_SOFT},
        "range": [-2.3, 2.3],
        "showgrid": True,
        "gridcolor": GRID,
        "zeroline": True,
        "zerolinecolor": INK_SOFT,
        "linecolor": INK_SOFT,
        "scaleanchor": "x",
        "scaleratio": 1,
    },
    paper_bgcolor=PAGE_BG,
    plot_bgcolor=PAGE_BG,
    font={"color": INK},
    showlegend=False,
    margin={"l": 80, "r": 70, "t": 80, "b": 60},
)

# Save as PNG (2400x2400 px)
fig.write_image(f"plot-{THEME}.png", width=600, height=600, scale=4)

# Save as HTML for interactivity
fig.write_html(f"plot-{THEME}.html", include_plotlyjs="cdn")
Runnable source as JSON, for any HTTP client: https://api.anyplot.ai/specs/quiver-basic/plotly/code. Any spec id and library id listed in llms-full.txt fit the same URL shape; every URL below is complete and callable.
{
  "spec_id": "quiver-basic",
  "language": "python",
  "library": "plotly",
  "page": "https://anyplot.ai/quiver-basic/python/plotly",
  "hub": "https://anyplot.ai/quiver-basic",
  "code_json": "https://api.anyplot.ai/specs/quiver-basic/plotly/code",
  "spec_json": "https://api.anyplot.ai/specs/quiver-basic",
  "render_light_png": "https://storage.googleapis.com/anyplot-images/plots/quiver-basic/python/plotly/plot-light.png",
  "render_dark_png": "https://storage.googleapis.com/anyplot-images/plots/quiver-basic/python/plotly/plot-dark.png",
  "interactive_light_html": "https://storage.googleapis.com/anyplot-images/plots/quiver-basic/python/plotly/plot-light.html",
  "interactive_dark_html": "https://storage.googleapis.com/anyplot-images/plots/quiver-basic/python/plotly/plot-dark.html",
  "quality_score": 85.0,
  "license": "MIT",
  "guide": "https://anyplot.ai/llms.txt"
}
Part of Basic Quiver Plot on anyplot.ai.