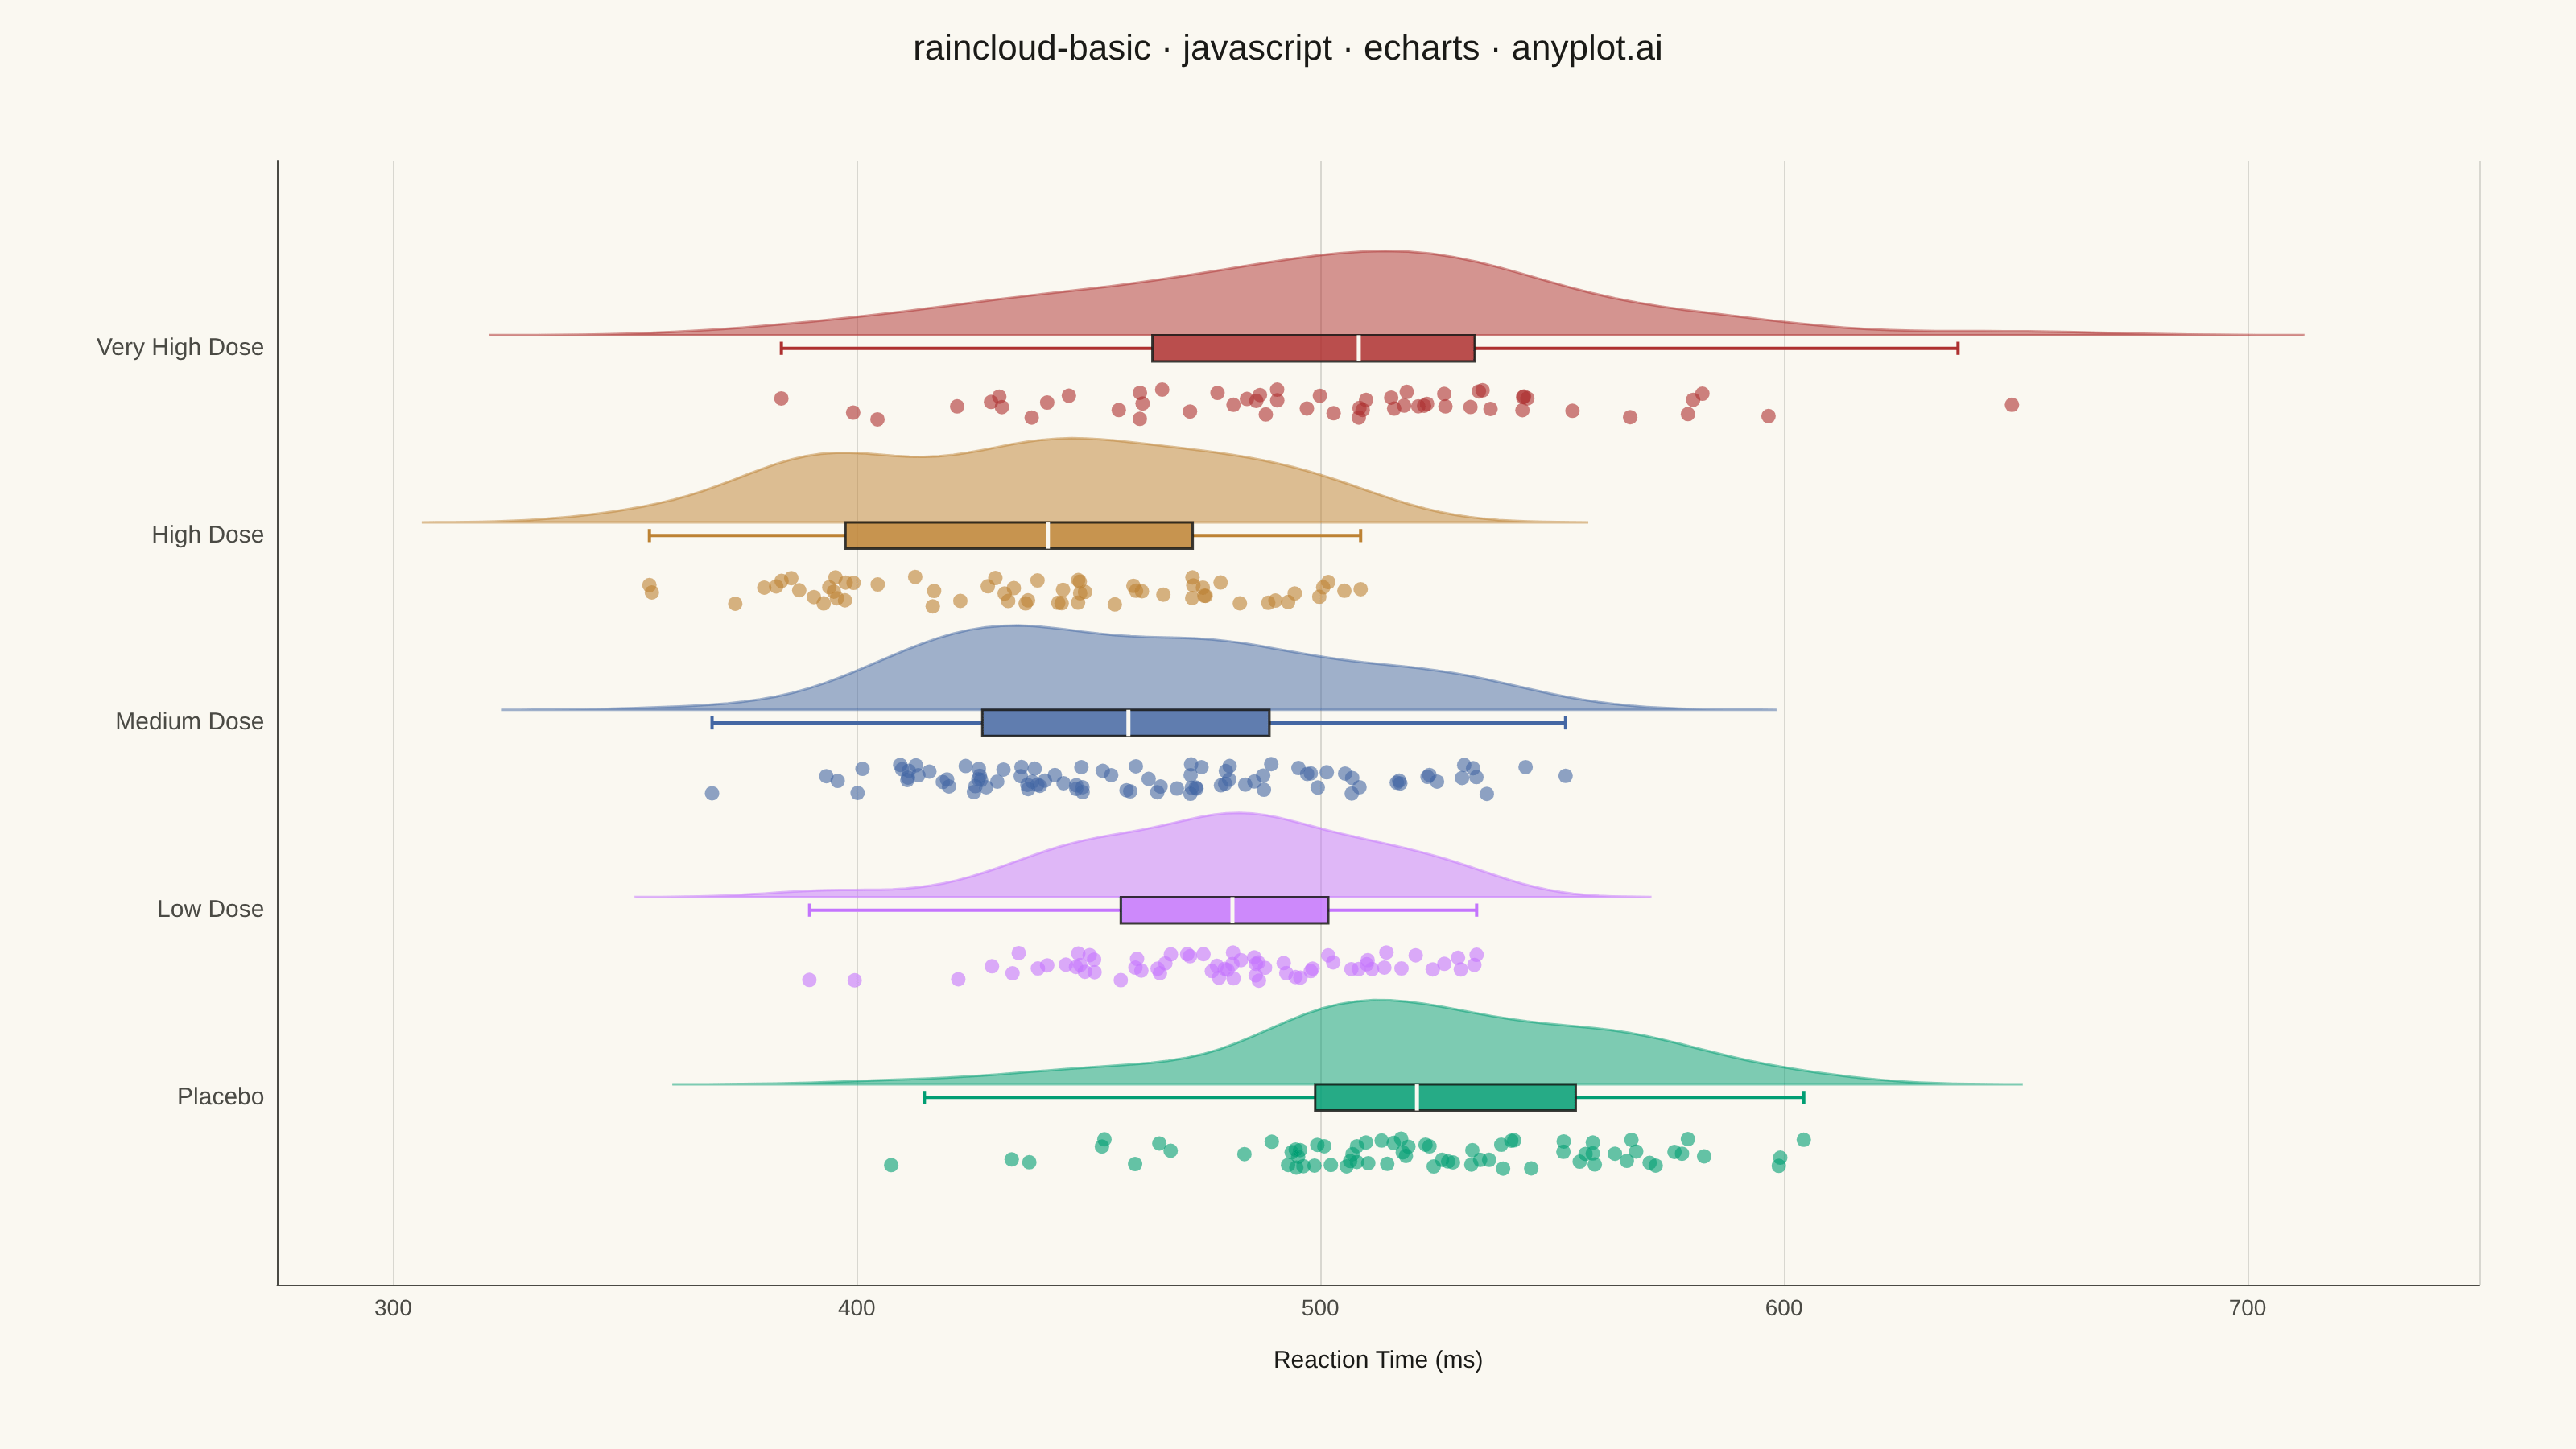
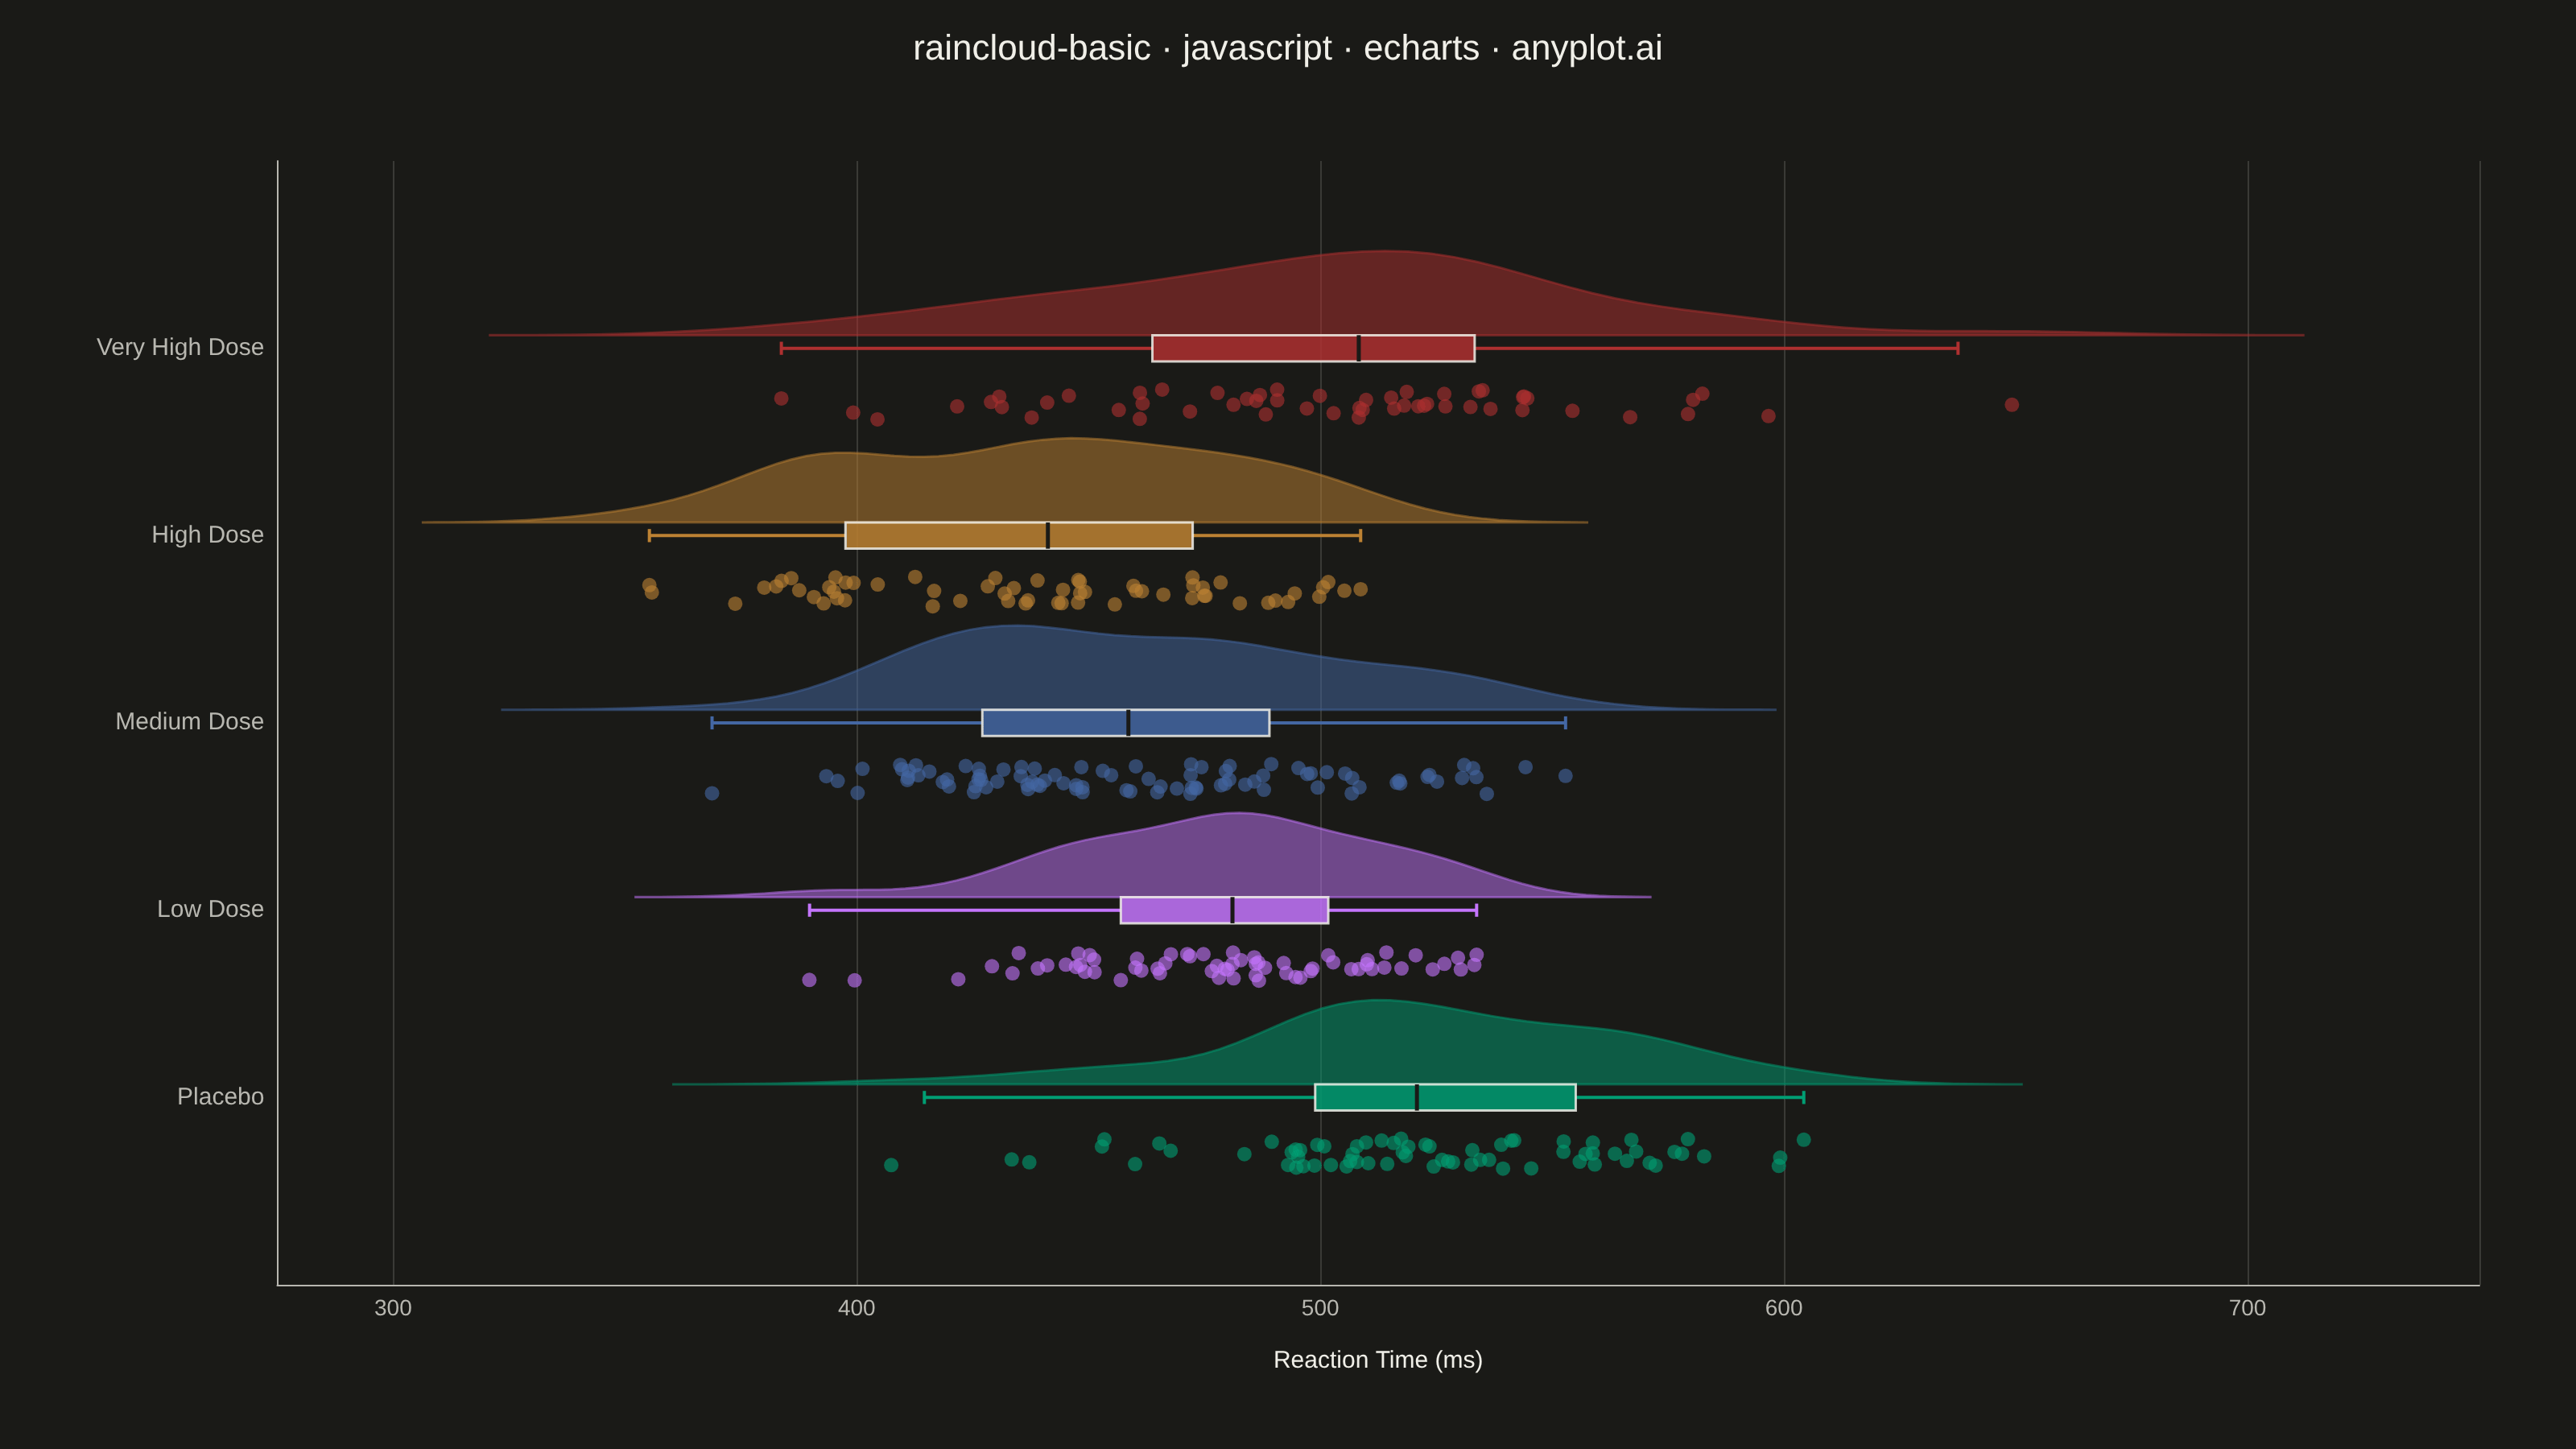
A raincloud plot combines three visualization elements—a half-violin (the "cloud"), jittered strip points (the "rain"), and a box plot—to provide a comprehensive view of data distribution. This hybrid approach shows distribution shape, summary statistics, and individual observations simultaneously, addressing the limitation of box plots that can hide multimodal distributions. Often called the "gold standard" for transparent statistical visualization in scientific publications.
Preview render from the Apache ECharts implementation.