The same plot in 14 other libraries — JavaScript: D3.js, Apache ECharts, Highcharts, MUI X Charts; Python: Altair, Bokeh, lets-plot, Matplotlib, Plotly, plotnine, Pygal, Seaborn; R: ggplot2; Julia: Makie.jl. Compare all 15 side by side: Basic Raincloud Plot in Python, R, Julia and JavaScript.
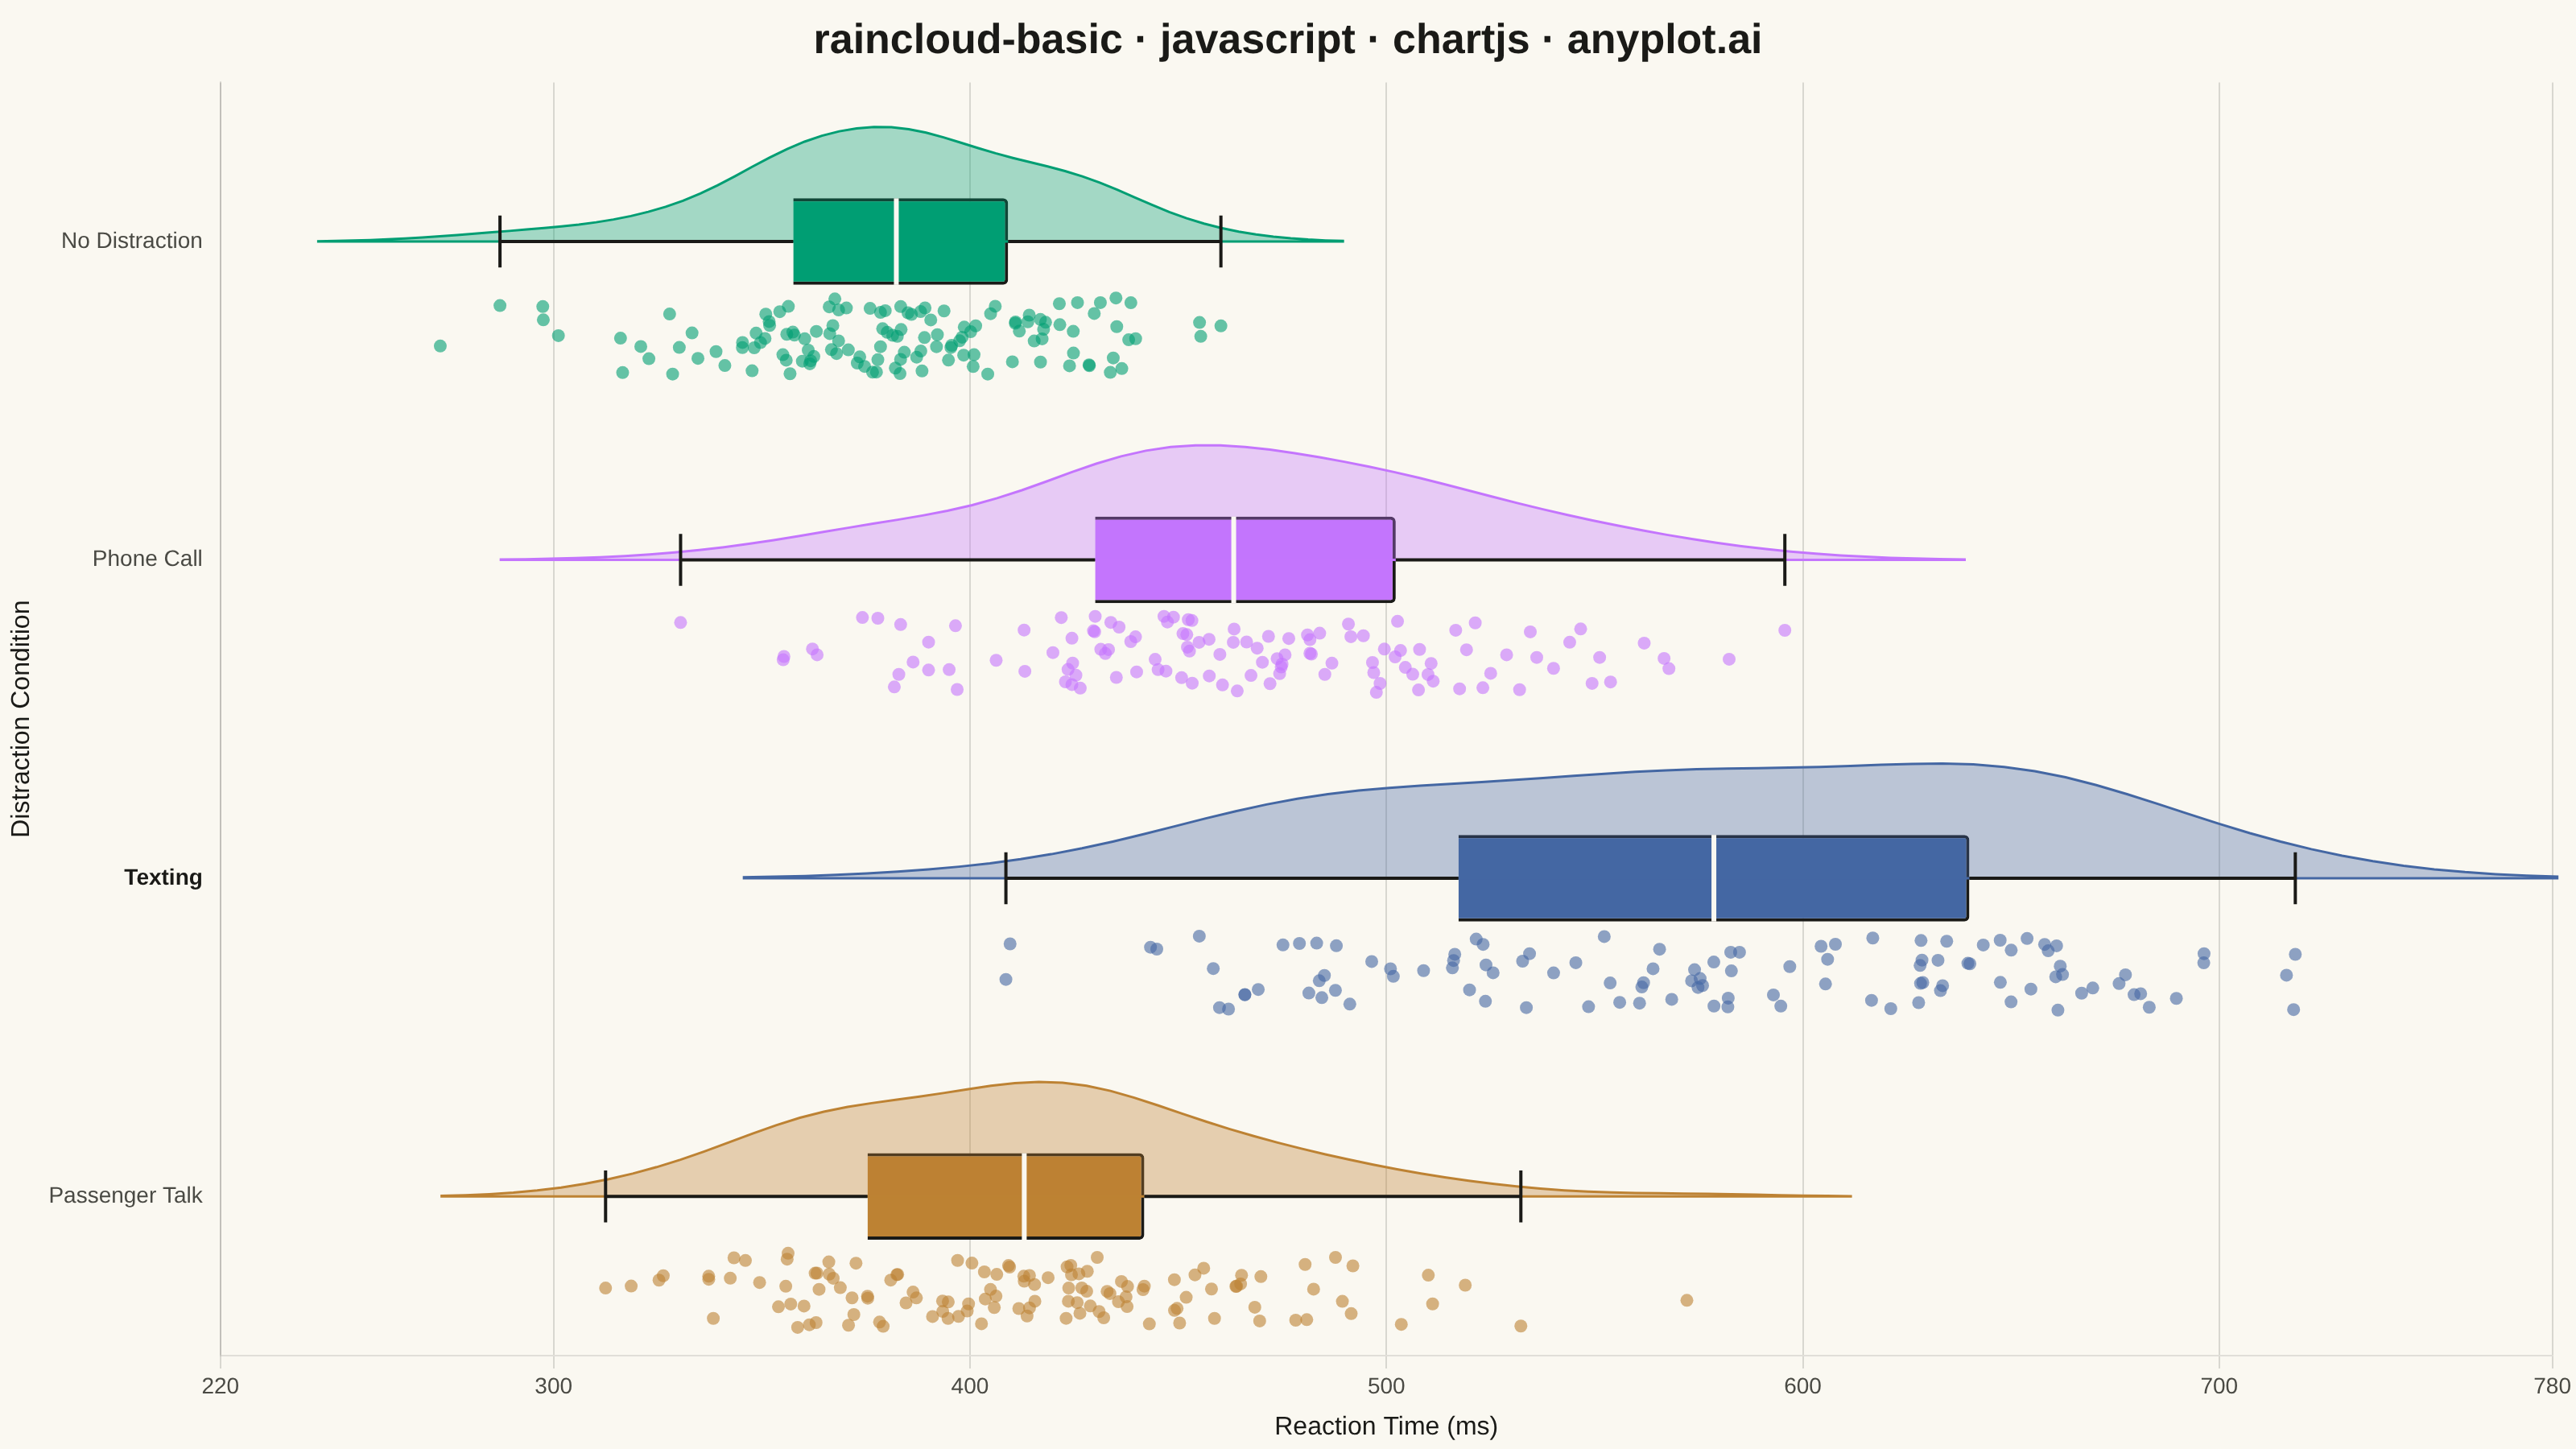
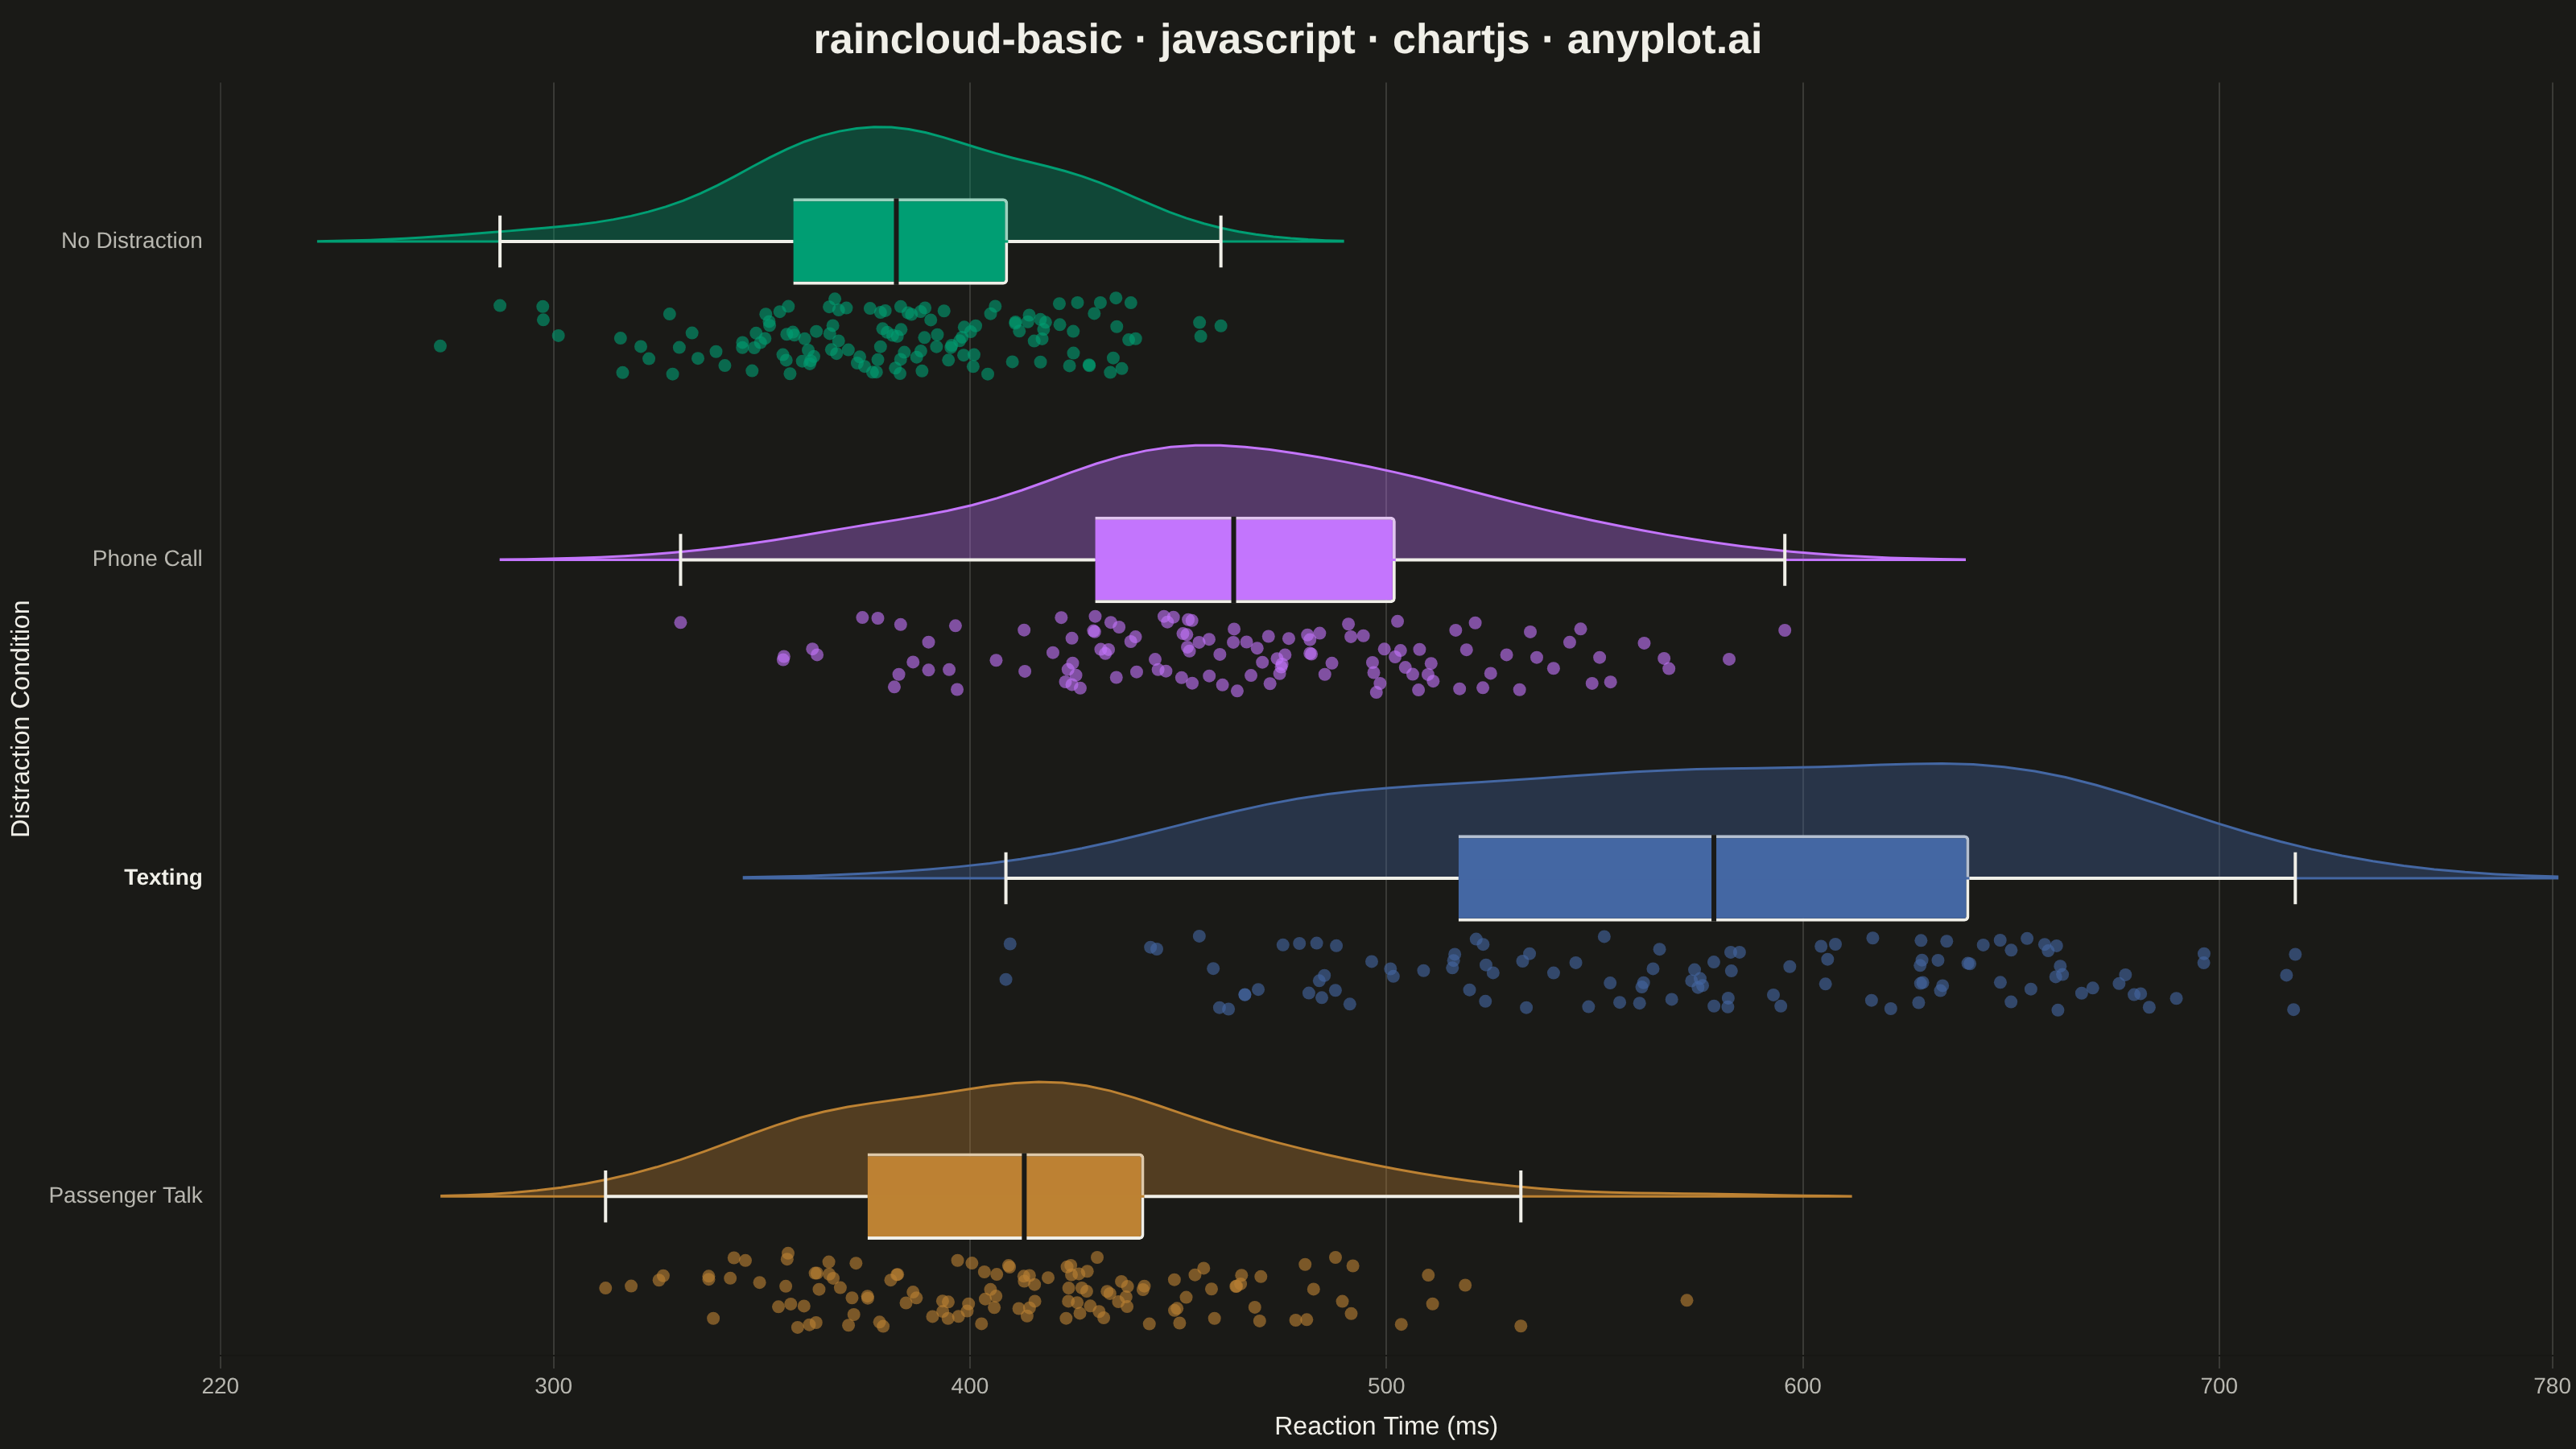
A raincloud plot combines three visualization elements—a half-violin (the "cloud"), jittered strip points (the "rain"), and a box plot—to provide a comprehensive view of data distribution. This hybrid approach shows distribution shape, summary statistics, and individual observations simultaneously, addressing the limitation of box plots that can hide multimodal distributions. Often called the "gold standard" for transparent statistical visualization in scientific publications.
// anyplot.ai
// raincloud-basic: Basic Raincloud Plot
// Library: chartjs 4.4.7 | JavaScript 22.23.2
// Quality: 92/100 | Created: 2026-08-26

const t = window.ANYPLOT_TOKENS;

// --- Deterministic PRNG (LCG) + Box-Muller normal sampling ------------------
let seed = 42;
function lcg() {
  seed = (seed * 1664525 + 1013904223) % 4294967296;
  return seed / 4294967296;
}
function randNormal(mean, sd) {
  const u1 = Math.max(lcg(), 1e-9);
  const u2 = lcg();
  const z = Math.sqrt(-2 * Math.log(u1)) * Math.cos(2 * Math.PI * u2);
  return mean + z * sd;
}
function quantile(sorted, q) {
  const pos = (sorted.length - 1) * q;
  const base = Math.floor(pos);
  const rest = pos - base;
  return sorted[base + 1] !== undefined
    ? sorted[base] + rest * (sorted[base + 1] - sorted[base])
    : sorted[base];
}
function stdDev(values) {
  const mean = values.reduce((a, b) => a + b, 0) / values.length;
  const variance =
    values.reduce((a, b) => a + (b - mean) ** 2, 0) / values.length;
  return Math.sqrt(variance);
}
function kde(values, evalPoints, bandwidth) {
  const norm = 1 / (values.length * bandwidth * Math.sqrt(2 * Math.PI));
  return evalPoints.map((x) => {
    let sum = 0;
    for (const v of values) {
      const z = (x - v) / bandwidth;
      sum += Math.exp(-0.5 * z * z);
    }
    return sum * norm;
  });
}

// --- Data: reaction time (ms) in a driving-simulator task by distraction ---
const conditionSpecs = [
  { label: "No Distraction", mean: 380, sd: 40, n: 130 },
  { label: "Phone Call", mean: 460, sd: 55, n: 120 },
  { label: "Texting", mean: 590, sd: 90, n: 110 },
  { label: "Passenger Talk", mean: 415, sd: 45, n: 125 },
];

const categories = conditionSpecs.map((spec) => {
  const values = Array.from({ length: spec.n }, () =>
    Math.max(180, randNormal(spec.mean, spec.sd))
  );
  const sorted = [...values].sort((a, b) => a - b);
  const q1 = quantile(sorted, 0.25);
  const median = quantile(sorted, 0.5);
  const q3 = quantile(sorted, 0.75);
  const iqr = q3 - q1;
  const lowerFence = q1 - 1.5 * iqr;
  const upperFence = q3 + 1.5 * iqr;
  const inRange = sorted.filter((v) => v >= lowerFence && v <= upperFence);
  const bandwidth = 1.06 * stdDev(values) * Math.pow(values.length, -0.2);
  const evalMin = sorted[0] - 2 * bandwidth;
  const evalMax = sorted[sorted.length - 1] + 2 * bandwidth;
  const evalPoints = Array.from(
    { length: 60 },
    (_, i) => evalMin + (i / 59) * (evalMax - evalMin)
  );
  const densities = kde(values, evalPoints, bandwidth);
  const maxDensity = Math.max(...densities);

  return {
    label: spec.label,
    values,
    q1,
    median,
    q3,
    whiskerMin: inRange[0],
    whiskerMax: inRange[inRange.length - 1],
    evalPoints,
    densities,
    maxDensity,
  };
});

const allValues = categories.flatMap((c) => c.values);
const dataMin = Math.min(...allValues);
const dataMax = Math.max(...allValues);
const pad = (dataMax - dataMin) * 0.1;
const xMin = Math.floor((dataMin - pad) / 20) * 20;
const xMax = Math.ceil((dataMax + pad) / 20) * 20;

// Standout category (most notable right-shift) — the highest median gets a
// bold, ink-colored y-axis label so the story stands out without touching
// the Imprint data colors.
const standoutIndex = categories.reduce(
  (best, cat, idx) => (cat.median > categories[best].median ? idx : best),
  0
);

// --- Custom plugin: half-violin cloud, jittered rain, whiskers, median -----
const raincloudExtras = {
  id: "raincloudExtras",
  afterDatasetsDraw(chart) {
    const { ctx } = chart;
    const meta = chart.getDatasetMeta(0);
    const xScale = chart.scales.x;
    ctx.save();

    const rowHeight =
      categories.length > 1
        ? Math.abs(meta.data[1].y - meta.data[0].y)
        : chart.chartArea.height * 0.7;
    const cloudMaxHeight = rowHeight * 0.36;
    const rainBandHeight = rowHeight * 0.24;

    categories.forEach((cat, i) => {
      const bar = meta.data[i];
      if (!bar) return;
      const centerY = bar.y;
      const color = t.palette[i % t.palette.length];

      // Cloud — half-violin (KDE curve) rising ABOVE the baseline
      ctx.beginPath();
      cat.evalPoints.forEach((value, j) => {
        const x = xScale.getPixelForValue(value);
        const y =
          centerY - (cat.densities[j] / cat.maxDensity) * cloudMaxHeight;
        if (j === 0) ctx.moveTo(x, centerY);
        ctx.lineTo(x, y);
      });
      ctx.lineTo(
        xScale.getPixelForValue(cat.evalPoints[cat.evalPoints.length - 1]),
        centerY
      );
      ctx.closePath();
      ctx.fillStyle = color;
      ctx.globalAlpha = 0.35;
      ctx.fill();
      ctx.globalAlpha = 1;
      ctx.lineWidth = 1.5;
      ctx.strokeStyle = color;
      ctx.stroke();

      // Rain — jittered points falling BELOW the baseline
      const rainStart = bar.height / 2 + 8;
      ctx.fillStyle = color;
      ctx.globalAlpha = 0.6;
      cat.values.forEach((value) => {
        const x = xScale.getPixelForValue(value);
        const y = centerY + rainStart + lcg() * rainBandHeight;
        ctx.beginPath();
        ctx.arc(x, y, 4, 0, Math.PI * 2);
        ctx.fill();
      });
      ctx.globalAlpha = 1;

      // Box — whiskers, caps, median line (drawn on the baseline)
      const capHalf = bar.height * 0.3;
      const xWhiskerMin = xScale.getPixelForValue(cat.whiskerMin);
      const xWhiskerMax = xScale.getPixelForValue(cat.whiskerMax);
      const xQ1 = xScale.getPixelForValue(cat.q1);
      const xQ3 = xScale.getPixelForValue(cat.q3);
      const xMedian = xScale.getPixelForValue(cat.median);

      ctx.strokeStyle = t.ink;
      ctx.lineWidth = 2;
      ctx.beginPath();
      ctx.moveTo(xWhiskerMin, centerY);
      ctx.lineTo(xQ1, centerY);
      ctx.moveTo(xQ3, centerY);
      ctx.lineTo(xWhiskerMax, centerY);
      ctx.moveTo(xWhiskerMin, centerY - capHalf);
      ctx.lineTo(xWhiskerMin, centerY + capHalf);
      ctx.moveTo(xWhiskerMax, centerY - capHalf);
      ctx.lineTo(xWhiskerMax, centerY + capHalf);
      ctx.stroke();

      ctx.strokeStyle = t.pageBg;
      ctx.lineWidth = 3;
      ctx.beginPath();
      ctx.moveTo(xMedian, centerY - bar.height / 2);
      ctx.lineTo(xMedian, centerY + bar.height / 2);
      ctx.stroke();
    });

    ctx.restore();
  },
};

// --- Mount -------------------------------------------------------------------
const canvas = document.createElement("canvas");
document.getElementById("container").appendChild(canvas);

// --- Chart: horizontal floating bars for Q1-Q3, custom plugin for the rest -
new Chart(canvas, {
  type: "bar",
  data: {
    labels: categories.map((c) => c.label),
    datasets: [
      {
        label: "Interquartile range",
        data: categories.map((c) => [c.q1, c.q3]),
        backgroundColor: categories.map((_, i) => t.palette[i % t.palette.length]),
        borderColor: t.ink,
        borderWidth: 2,
        borderRadius: 3,
        barPercentage: 0.32,
        categoryPercentage: 0.85,
      },
    ],
  },
  plugins: [raincloudExtras],
  options: {
    indexAxis: "y",
    responsive: true,
    maintainAspectRatio: false,
    animation: false,
    plugins: {
      title: {
        display: true,
        text: "raincloud-basic · javascript · chartjs · anyplot.ai",
        color: t.ink,
        font: { size: 26 },
      },
      legend: { display: false },
    },
    scales: {
      x: {
        min: xMin,
        max: xMax,
        title: {
          display: true,
          text: "Reaction Time (ms)",
          color: t.ink,
          font: { size: 16 },
        },
        ticks: { color: t.inkSoft, font: { size: 14 } },
        grid: { color: t.grid },
      },
      y: {
        title: {
          display: true,
          text: "Distraction Condition",
          color: t.ink,
          font: { size: 16 },
        },
        ticks: {
          color: (ctx) => (ctx.index === standoutIndex ? t.ink : t.inkSoft),
          font: (ctx) => ({
            size: 14,
            weight: ctx.index === standoutIndex ? "bold" : "normal",
          }),
        },
        grid: { display: false },
      },
    },
  },
});
Runnable source as JSON, for any HTTP client: https://api.anyplot.ai/specs/raincloud-basic/chartjs/code. Any spec id and library id listed in llms-full.txt fit the same URL shape; every URL below is complete and callable.
{
  "spec_id": "raincloud-basic",
  "language": "javascript",
  "library": "chartjs",
  "page": "https://anyplot.ai/raincloud-basic/javascript/chartjs",
  "hub": "https://anyplot.ai/raincloud-basic",
  "code_json": "https://api.anyplot.ai/specs/raincloud-basic/chartjs/code",
  "spec_json": "https://api.anyplot.ai/specs/raincloud-basic",
  "render_light_png": "https://storage.googleapis.com/anyplot-images/plots/raincloud-basic/javascript/chartjs/plot-light.png",
  "render_dark_png": "https://storage.googleapis.com/anyplot-images/plots/raincloud-basic/javascript/chartjs/plot-dark.png",
  "interactive_light_html": "https://storage.googleapis.com/anyplot-images/plots/raincloud-basic/javascript/chartjs/plot-light.html",
  "interactive_dark_html": "https://storage.googleapis.com/anyplot-images/plots/raincloud-basic/javascript/chartjs/plot-dark.html",
  "quality_score": 92.0,
  "license": "MIT",
  "guide": "https://anyplot.ai/llms.txt"
}
Part of Basic Raincloud Plot on anyplot.ai.