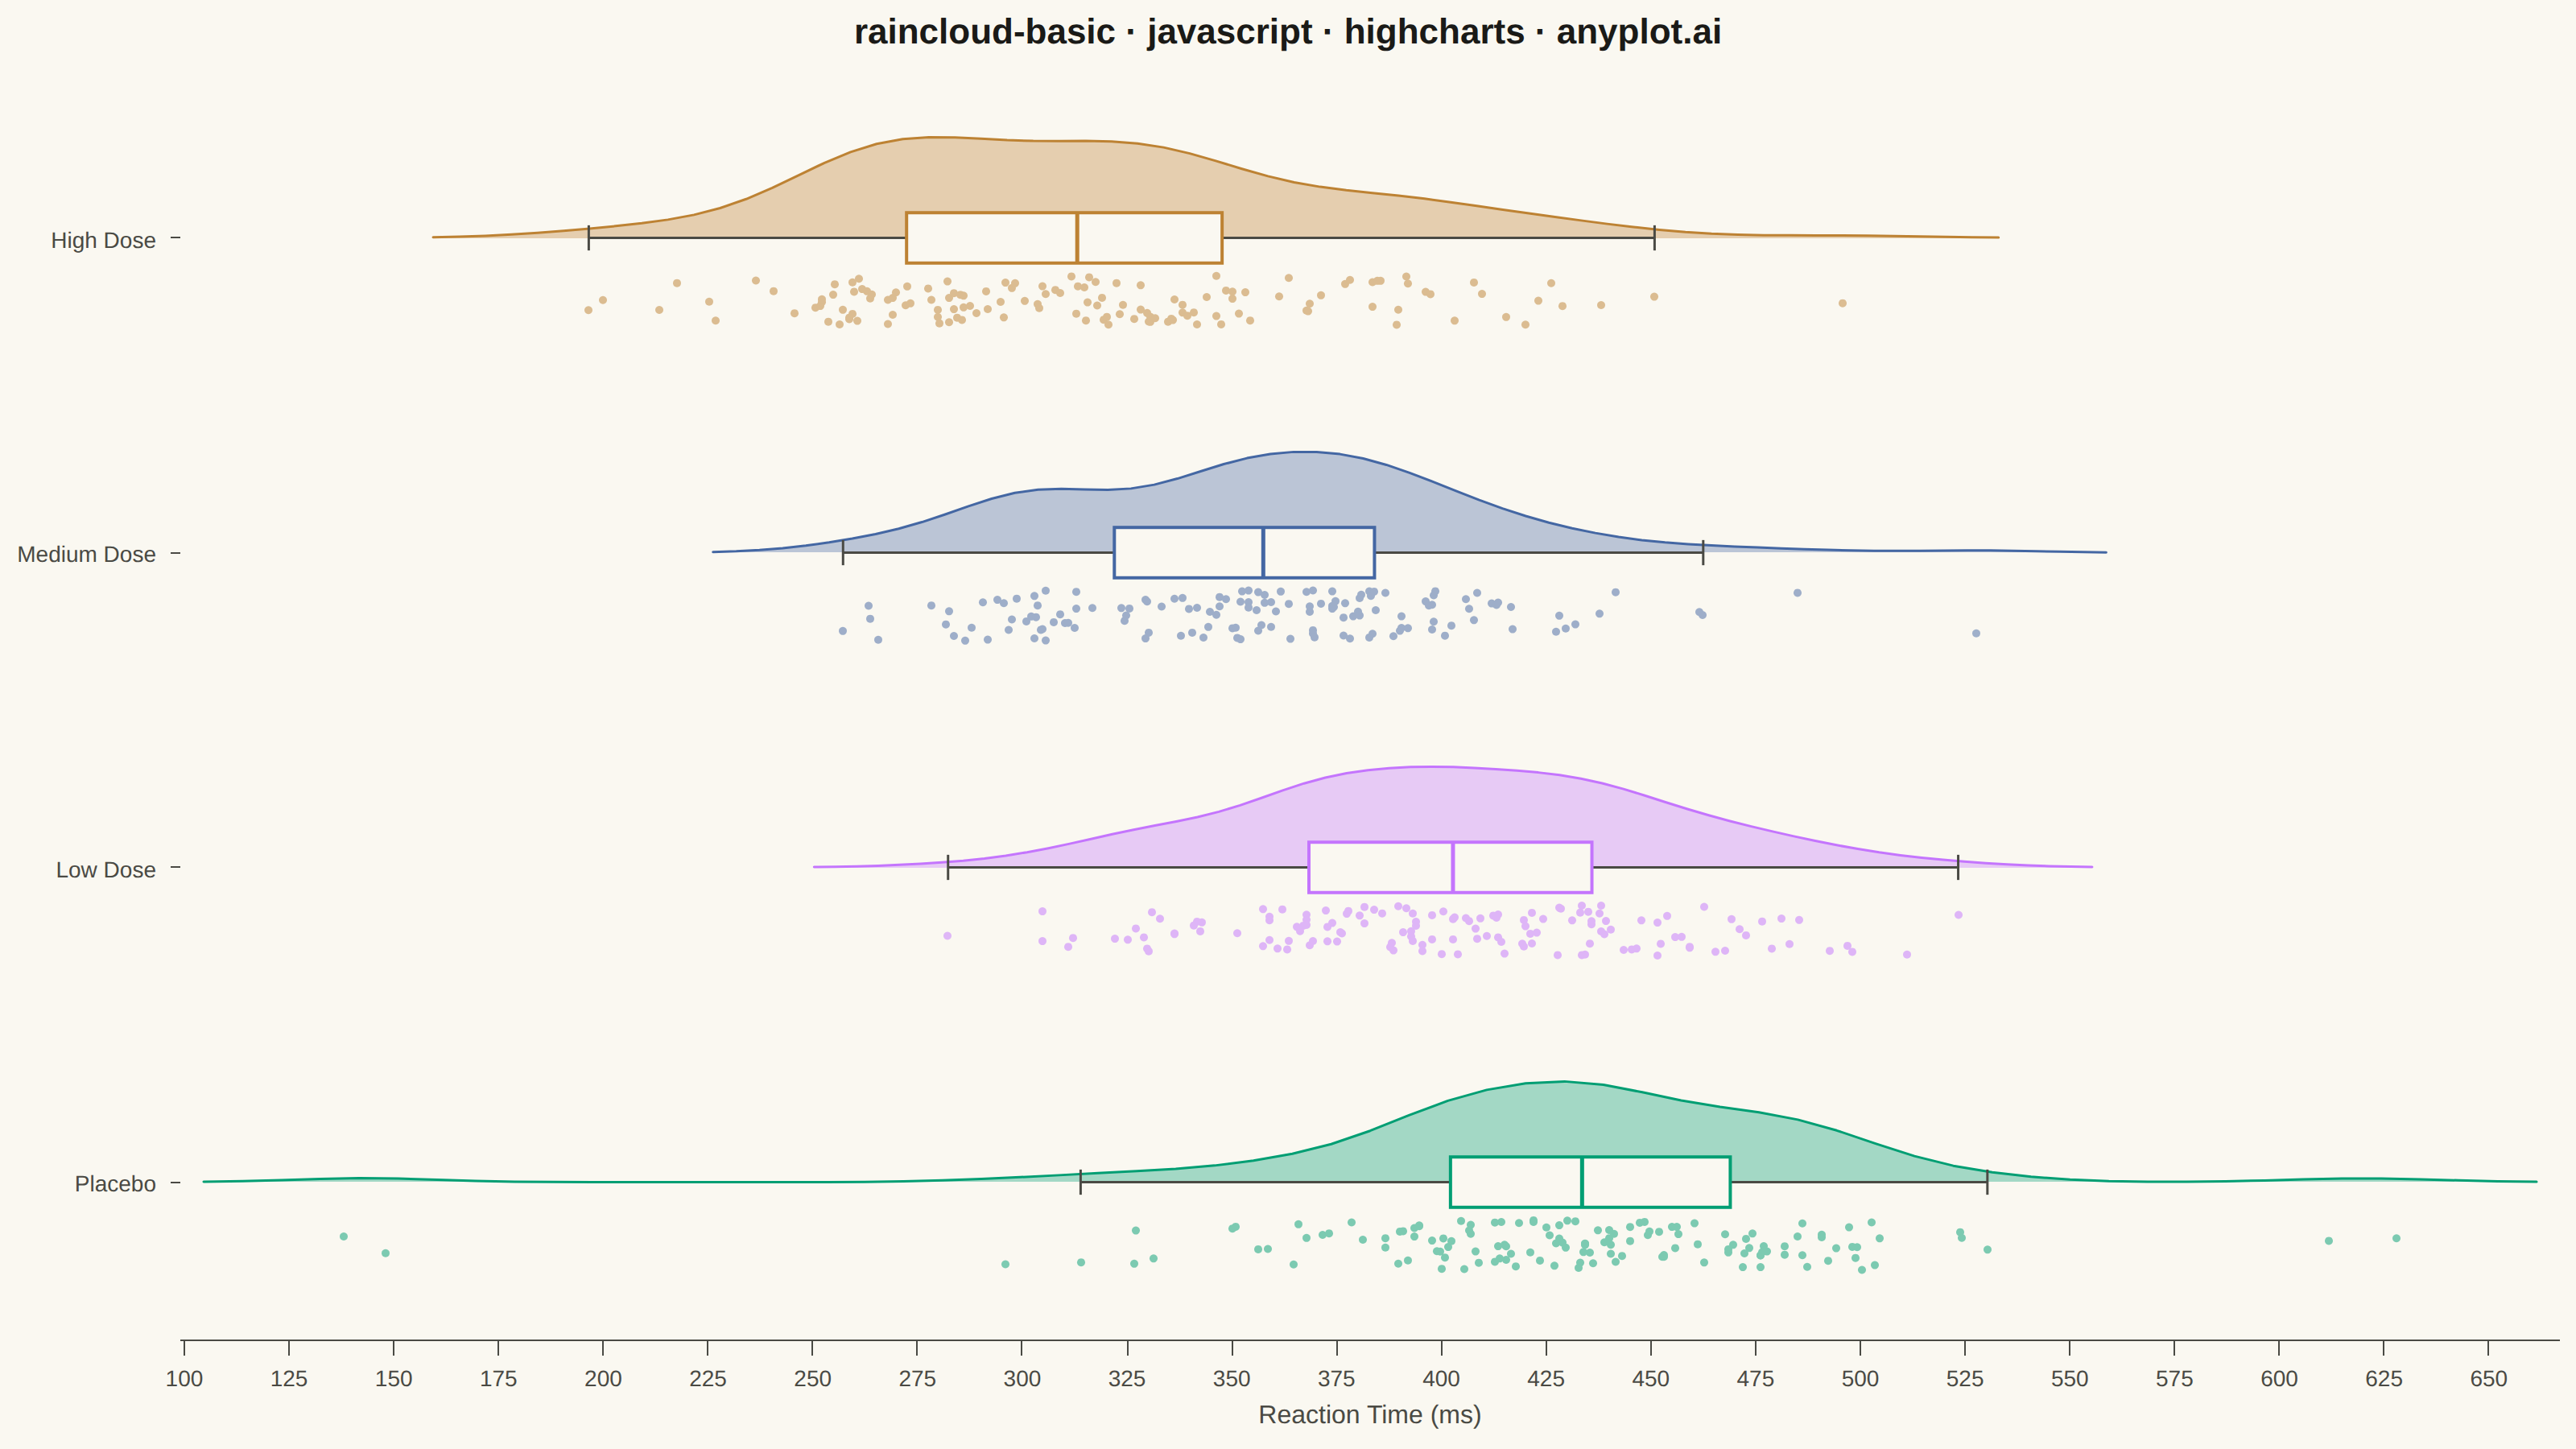
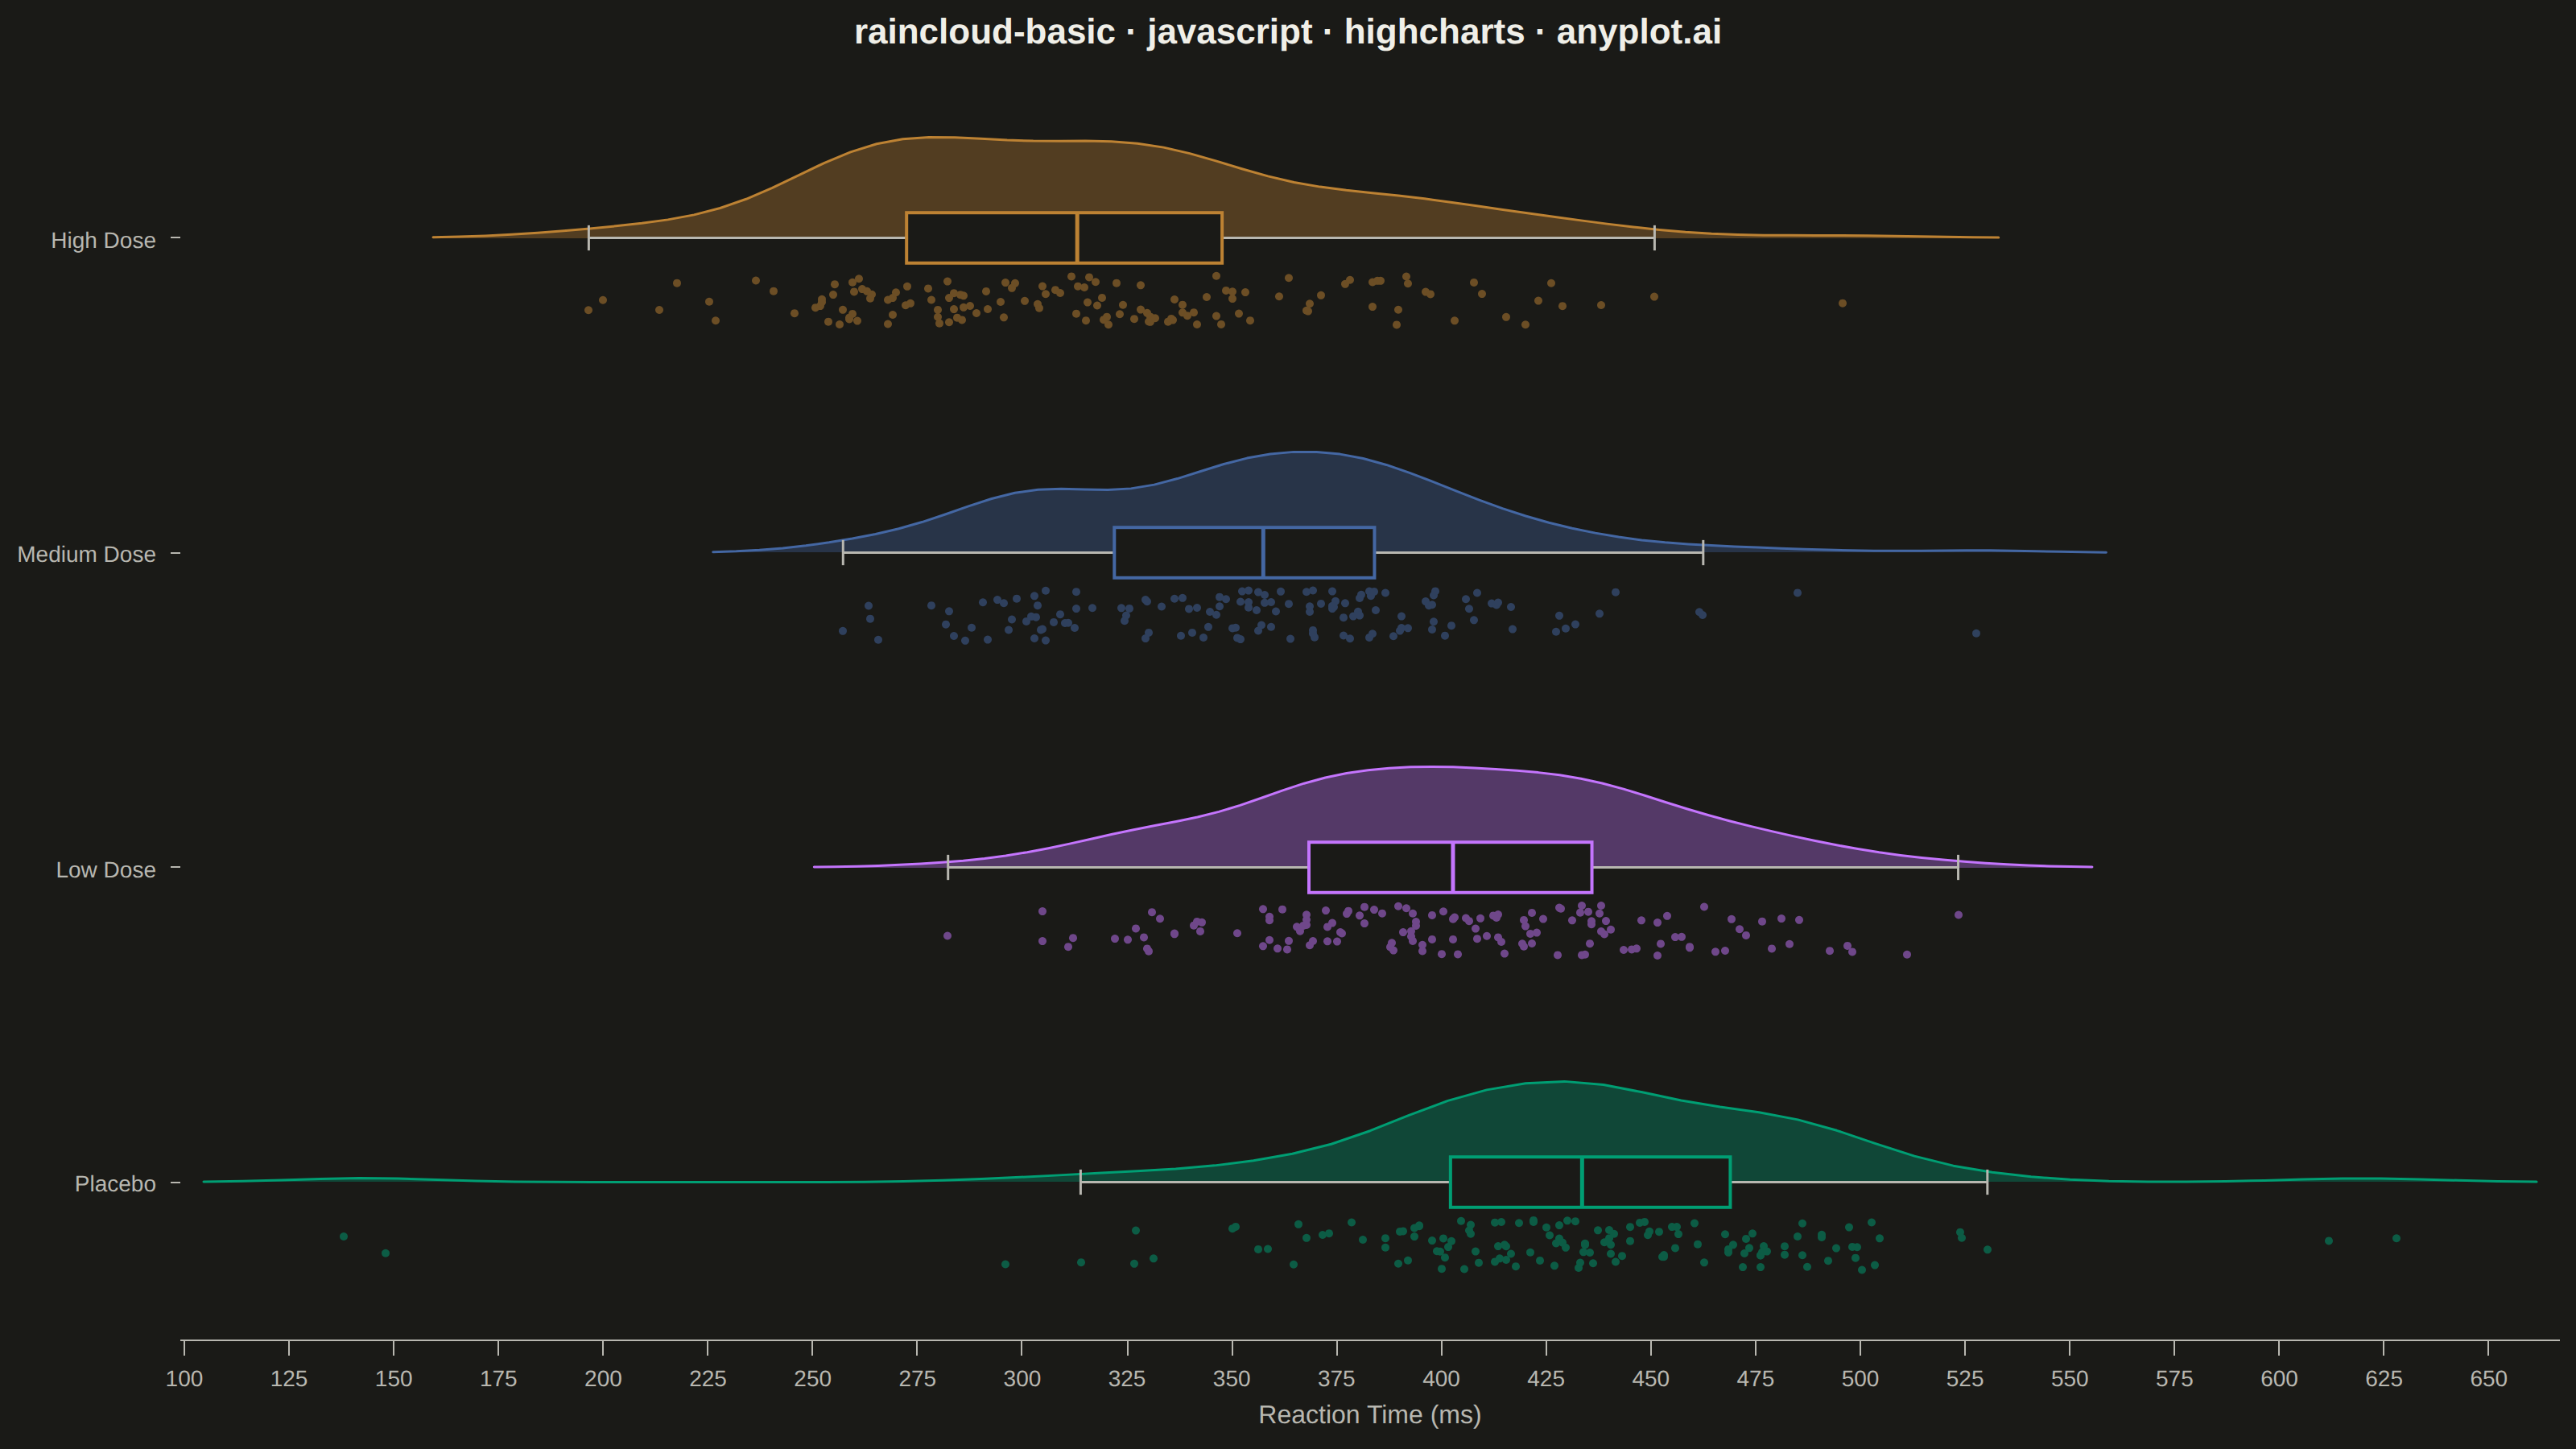
The same plot in 14 other libraries — JavaScript: Chart.js, D3.js, Apache ECharts, MUI X Charts; Python: Altair, Bokeh, lets-plot, Matplotlib, Plotly, plotnine, Pygal, Seaborn; R: ggplot2; Julia: Makie.jl. Compare all 15 side by side: Basic Raincloud Plot in Python, R, Julia and JavaScript.
A raincloud plot combines three visualization elements—a half-violin (the "cloud"), jittered strip points (the "rain"), and a box plot—to provide a comprehensive view of data distribution. This hybrid approach shows distribution shape, summary statistics, and individual observations simultaneously, addressing the limitation of box plots that can hide multimodal distributions. Often called the "gold standard" for transparent statistical visualization in scientific publications.
// anyplot.ai
// raincloud-basic: Basic Raincloud Plot
// Library: highcharts 12.6.0 | JavaScript 22.23.2
// Quality: 90/100 | Created: 2026-08-26

const t = window.ANYPLOT_TOKENS;

// --- Data: reaction times (ms) across a 4-arm dosage trial -----------------
function makeLcg(seed) {
  let state = seed >>> 0;
  return function random() {
    state = (Math.imul(state, 1664525) + 1013904223) >>> 0;
    return state / 4294967296;
  };
}
const random = makeLcg(42);

function randomNormal(mean, std) {
  const u1 = Math.max(random(), 1e-9);
  const u2 = random();
  const z = Math.sqrt(-2 * Math.log(u1)) * Math.cos(2 * Math.PI * u2);
  return mean + z * std;
}

const groups = [
  // A few attention-lapse (slow) and anticipatory (fast) trials beyond the
  // whisker fences, as seen in real reaction-time data.
  { name: "Placebo", mean: 430, std: 50, n: 136, outliers: [138, 148, 612, 628] },
  { name: "Low Dose", mean: 400, std: 50, n: 140 },
  { name: "Medium Dose", mean: 360, std: 48, n: 140 },
  // ~18% of subjects are non-responders whose reaction time stays near the
  // placebo level, producing a genuinely bimodal distribution.
  { name: "High Dose", mean: 305, std: 40, n: 140, mixture: { weight: 0.18, mean: 415, std: 35 } },
];

const categories = groups.map((group, index) => {
  const generated = Array.from({ length: group.n }, () => {
    const raw =
      group.mixture && random() < group.mixture.weight
        ? randomNormal(group.mixture.mean, group.mixture.std)
        : randomNormal(group.mean, group.std);
    return Math.max(120, raw);
  });
  const values = generated.concat(group.outliers ?? []).sort((a, b) => a - b);
  return { name: group.name, index, values };
});

// --- Statistics helpers ------------------------------------------------------
function quantile(sortedValues, q) {
  const pos = (sortedValues.length - 1) * q;
  const base = Math.floor(pos);
  const rest = pos - base;
  return sortedValues[base + 1] !== undefined
    ? sortedValues[base] + rest * (sortedValues[base + 1] - sortedValues[base])
    : sortedValues[base];
}

function gaussianKde(values, gridPoints, bandwidth) {
  const norm = values.length * bandwidth * Math.sqrt(2 * Math.PI);
  return gridPoints.map((x) => {
    let sum = 0;
    for (const v of values) {
      const u = (x - v) / bandwidth;
      sum += Math.exp(-0.5 * u * u);
    }
    return sum / norm;
  });
}

// --- Cloud (half-violin) and rain (jittered strip) series ------------------
const CLOUD_HEIGHT = 0.32;
const RAIN_CENTER = 0.2;
const RAIN_JITTER = 0.08;
const BOX_HALF_HEIGHT = 0.08;

const cloudSeries = categories.map((cat) => {
  const q1 = quantile(cat.values, 0.25);
  const q3 = quantile(cat.values, 0.75);
  const mean = cat.values.reduce((sum, v) => sum + v, 0) / cat.values.length;
  const std = Math.sqrt(cat.values.reduce((sum, v) => sum + (v - mean) ** 2, 0) / cat.values.length);
  const bandwidth = 0.9 * Math.min(std, (q3 - q1) / 1.34) * cat.values.length ** -0.2;
  const min = cat.values[0] - 2 * bandwidth;
  const max = cat.values[cat.values.length - 1] + 2 * bandwidth;
  const steps = 60;
  const grid = Array.from({ length: steps + 1 }, (_, i) => min + ((max - min) * i) / steps);
  const density = gaussianKde(cat.values, grid, bandwidth);
  const maxDensity = Math.max(...density);
  return {
    type: "area",
    name: `${cat.name} distribution`,
    data: grid.map((x, i) => [x, cat.index + (density[i] / maxDensity) * CLOUD_HEIGHT]),
    threshold: cat.index,
    color: t.palette[cat.index % t.palette.length],
    fillOpacity: 0.35,
    lineWidth: 1.5,
    marker: { enabled: false },
    enableMouseTracking: false,
    showInLegend: false,
    zIndex: 1,
  };
});

const rainSeries = categories.map((cat) => ({
  type: "scatter",
  name: `${cat.name} observations`,
  data: cat.values.map((v) => [v, cat.index - RAIN_CENTER + (random() - 0.5) * 2 * RAIN_JITTER]),
  color: t.palette[cat.index % t.palette.length],
  opacity: 0.5,
  marker: { radius: 2.5, symbol: "circle", lineWidth: 0 },
  enableMouseTracking: false,
  showInLegend: false,
  zIndex: 2,
}));

// --- Chart -------------------------------------------------------------------
Highcharts.chart("container", {
  chart: {
    backgroundColor: "transparent",
    animation: false,
    style: { fontFamily: "inherit" },
    events: {
      load: function drawBoxPlots() {
        const chart = this;
        const xAxis = chart.xAxis[0];
        const yAxis = chart.yAxis[0];
        const capHalf = BOX_HALF_HEIGHT * 0.5;

        categories.forEach((cat) => {
          const values = cat.values;
          const q1 = quantile(values, 0.25);
          const median = quantile(values, 0.5);
          const q3 = quantile(values, 0.75);
          const iqr = q3 - q1;
          const lowerFence = q1 - 1.5 * iqr;
          const upperFence = q3 + 1.5 * iqr;
          const withinFence = values.filter((v) => v >= lowerFence && v <= upperFence);
          const whiskerMin = withinFence[0];
          const whiskerMax = withinFence[withinFence.length - 1];
          const color = t.palette[cat.index % t.palette.length];

          const yMid = yAxis.toPixels(cat.index);
          const yTop = yAxis.toPixels(cat.index + BOX_HALF_HEIGHT);
          const yBottom = yAxis.toPixels(cat.index - BOX_HALF_HEIGHT);
          const yCapTop = yAxis.toPixels(cat.index + capHalf);
          const yCapBottom = yAxis.toPixels(cat.index - capHalf);
          const xQ1 = xAxis.toPixels(q1);
          const xQ3 = xAxis.toPixels(q3);
          const xMedian = xAxis.toPixels(median);
          const xWhiskerMin = xAxis.toPixels(whiskerMin);
          const xWhiskerMax = xAxis.toPixels(whiskerMax);

          chart.renderer
            .path(["M", xWhiskerMin, yMid, "L", xQ1, yMid])
            .attr({ stroke: t.inkSoft, "stroke-width": 1.5, zIndex: 3 })
            .add();
          chart.renderer
            .path(["M", xQ3, yMid, "L", xWhiskerMax, yMid])
            .attr({ stroke: t.inkSoft, "stroke-width": 1.5, zIndex: 3 })
            .add();
          chart.renderer
            .path(["M", xWhiskerMin, yCapTop, "L", xWhiskerMin, yCapBottom])
            .attr({ stroke: t.inkSoft, "stroke-width": 1.5, zIndex: 3 })
            .add();
          chart.renderer
            .path(["M", xWhiskerMax, yCapTop, "L", xWhiskerMax, yCapBottom])
            .attr({ stroke: t.inkSoft, "stroke-width": 1.5, zIndex: 3 })
            .add();
          chart.renderer
            .rect(Math.min(xQ1, xQ3), yTop, Math.abs(xQ3 - xQ1), yBottom - yTop)
            .attr({ fill: t.pageBg, stroke: color, "stroke-width": 2, zIndex: 4 })
            .add();
          chart.renderer
            .path(["M", xMedian, yTop, "L", xMedian, yBottom])
            .attr({ stroke: color, "stroke-width": 2.5, zIndex: 5 })
            .add();
        });
      },
    },
  },
  credits: { enabled: false },
  colors: t.palette,
  title: {
    text: "raincloud-basic · javascript · highcharts · anyplot.ai",
    style: { color: t.ink, fontSize: "22px", fontWeight: "600" },
  },
  xAxis: {
    title: { text: "Reaction Time (ms)", style: { color: t.inkSoft, fontSize: "16px" } },
    lineColor: t.inkSoft,
    tickColor: t.inkSoft,
    gridLineColor: t.grid,
    labels: { style: { color: t.inkSoft, fontSize: "14px" } },
  },
  yAxis: {
    title: { text: null },
    min: -0.5,
    max: categories.length - 1 + 0.5,
    startOnTick: false,
    endOnTick: false,
    tickPositions: categories.map((cat) => cat.index),
    gridLineWidth: 0,
    lineColor: t.inkSoft,
    tickColor: t.inkSoft,
    tickWidth: 1,
    tickLength: 6,
    labels: {
      style: { color: t.inkSoft, fontSize: "14px" },
      formatter: function formatCategoryLabel() {
        return categories[this.value] ? categories[this.value].name : "";
      },
    },
  },
  legend: { enabled: false },
  plotOptions: { series: { animation: false } },
  series: [...cloudSeries, ...rainSeries],
});
Runnable source as JSON, for any HTTP client: https://api.anyplot.ai/specs/raincloud-basic/highcharts/code. Any spec id and library id listed in llms-full.txt fit the same URL shape; every URL below is complete and callable.
{
  "spec_id": "raincloud-basic",
  "language": "javascript",
  "library": "highcharts",
  "page": "https://anyplot.ai/raincloud-basic/javascript/highcharts",
  "hub": "https://anyplot.ai/raincloud-basic",
  "code_json": "https://api.anyplot.ai/specs/raincloud-basic/highcharts/code",
  "spec_json": "https://api.anyplot.ai/specs/raincloud-basic",
  "render_light_png": "https://storage.googleapis.com/anyplot-images/plots/raincloud-basic/javascript/highcharts/plot-light.png",
  "render_dark_png": "https://storage.googleapis.com/anyplot-images/plots/raincloud-basic/javascript/highcharts/plot-dark.png",
  "interactive_light_html": "https://storage.googleapis.com/anyplot-images/plots/raincloud-basic/javascript/highcharts/plot-light.html",
  "interactive_dark_html": "https://storage.googleapis.com/anyplot-images/plots/raincloud-basic/javascript/highcharts/plot-dark.html",
  "quality_score": 90.0,
  "license": "MIT",
  "guide": "https://anyplot.ai/llms.txt"
}
Part of Basic Raincloud Plot on anyplot.ai.