The same plot in 14 other libraries — Python: Altair, Bokeh, lets-plot, Matplotlib, Plotly, plotnine, Pygal, Seaborn; Julia: Makie.jl; JavaScript: Chart.js, D3.js, Apache ECharts, Highcharts, MUI X Charts. Compare all 15 side by side: Basic Raincloud Plot in Python, R, Julia and JavaScript.
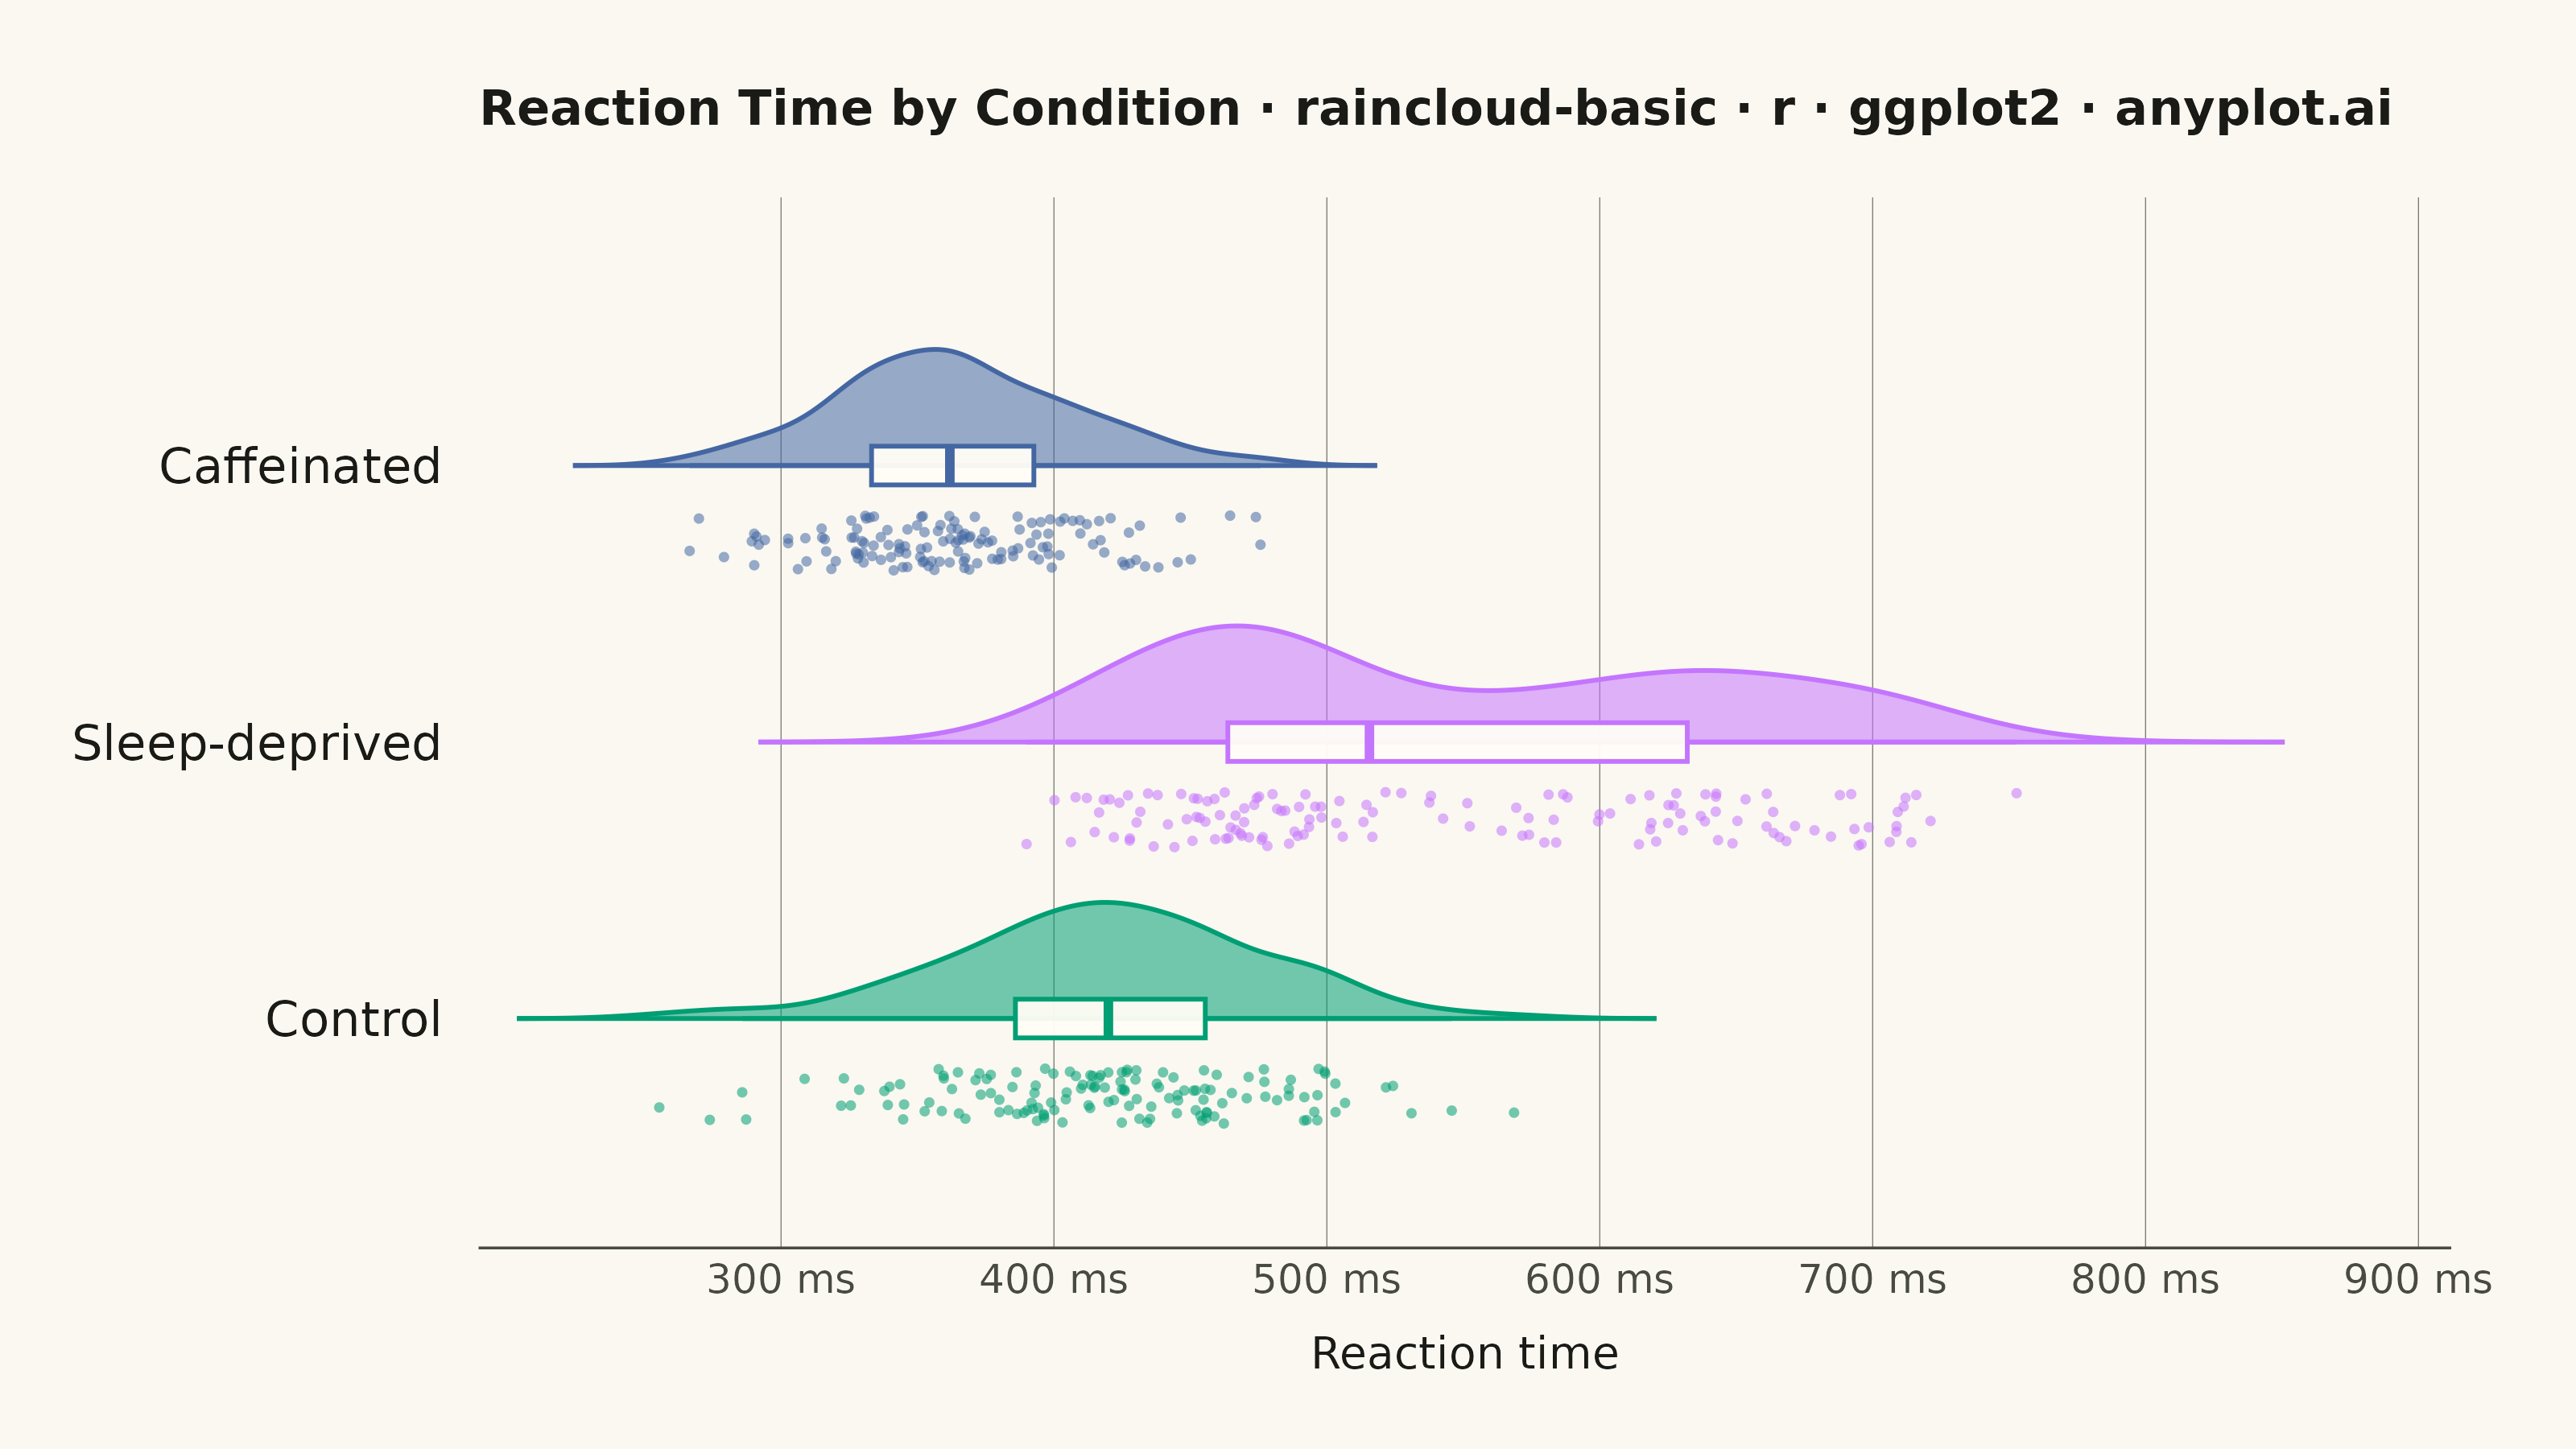
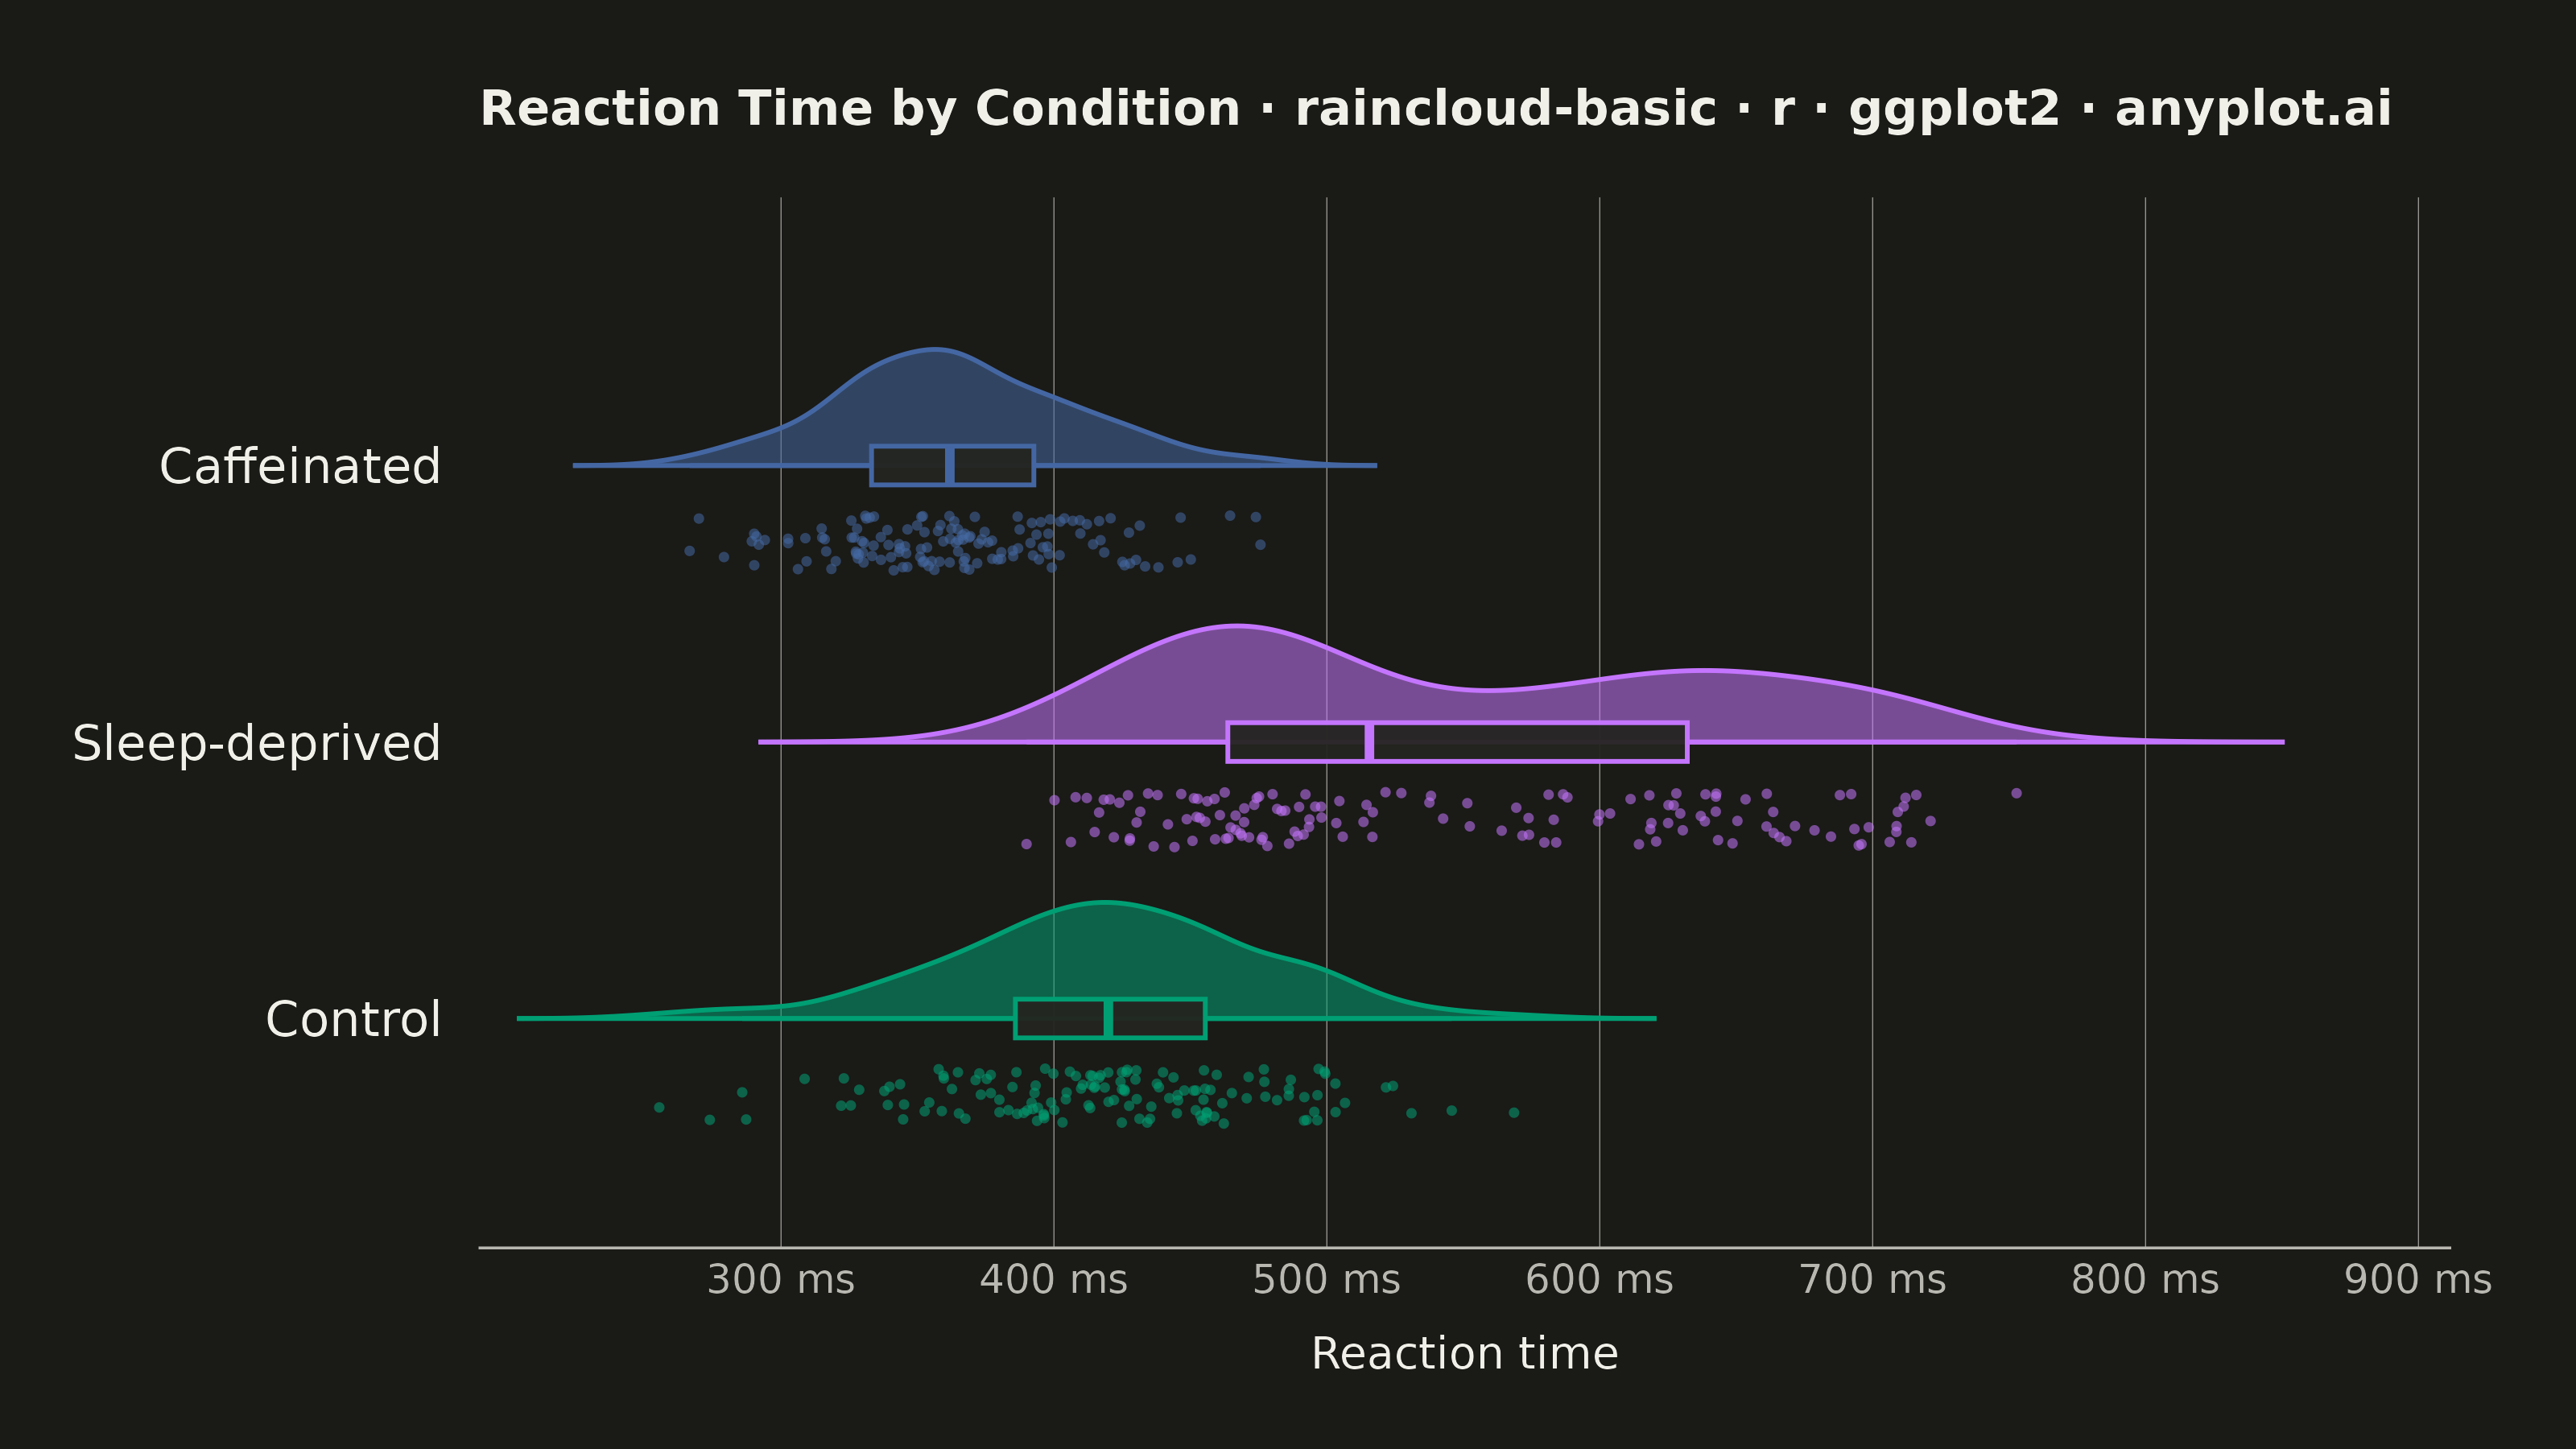
A raincloud plot combines three visualization elements—a half-violin (the "cloud"), jittered strip points (the "rain"), and a box plot—to provide a comprehensive view of data distribution. This hybrid approach shows distribution shape, summary statistics, and individual observations simultaneously, addressing the limitation of box plots that can hide multimodal distributions. Often called the "gold standard" for transparent statistical visualization in scientific publications.
#' anyplot.ai
#' raincloud-basic: Basic Raincloud Plot
#' Library: ggplot2 3.5.1 | R 4.4.1
#' Quality: 92/100 | Created: 2026-05-27

library(ggplot2)
library(dplyr)
library(tibble)
library(ragg)

set.seed(42)

# Theme tokens
THEME       <- Sys.getenv("ANYPLOT_THEME", "light")
PAGE_BG     <- if (THEME == "light") "#FAF8F1" else "#1A1A17"
INK         <- if (THEME == "light") "#1A1A17" else "#F0EFE8"
INK_SOFT    <- if (THEME == "light") "#4A4A44" else "#B8B7B0"
INK_MUTED   <- if (THEME == "light") "#6B6A63" else "#A8A79F"
GRID        <- if (THEME == "light") "#6B6A63" else "#A8A79F"
BOX_FILL    <- if (THEME == "light") "#FFFDF6" else "#242420"

IMPRINT_PALETTE <- c("#009E73", "#C475FD", "#4467A3", "#BD8233",
                     "#AE3030", "#2ABCCD", "#954477", "#99B314")

# Data — psychology reaction-time experiment across three sleep conditions.
# Sleep-deprived group is bimodal: a fast subgroup that stayed alert and a
# slow subgroup whose responses degraded — exactly the kind of structure a
# box plot alone would hide, which is the canonical raincloud use-case.
groups <- c("Control", "Sleep-deprived", "Caffeinated")
n_per  <- 140

rt <- tibble(
    category = factor(rep(groups, each = n_per), levels = groups),
    value = c(
        rnorm(n_per, mean = 420, sd = 55),
        c(
            rnorm(round(n_per * 0.55), mean = 470, sd = 40),
            rnorm(n_per - round(n_per * 0.55), mean = 640, sd = 55)
        ),
        rnorm(n_per, mean = 365, sd = 45)
    )
)

# Cloud — half-violin built from a per-group KDE drawn as a ribbon that rises
# above each category baseline. Pure ggplot2 has no half-violin geom, so the
# density is computed manually and clipped to the [baseline, baseline+height]
# band so it never crosses into the row above.
cloud_height <- 0.42
cloud_data <- rt %>%
    group_by(category) %>%
    group_modify(~ {
        d <- density(.x$value, adjust = 1.0, n = 256)
        tibble(value = d$x, dens = d$y / max(d$y) * cloud_height)
    }) %>%
    ungroup() %>%
    mutate(cat_pos = as.numeric(category))

# Rain — jittered points placed below each category baseline.
rain_data <- rt %>%
    mutate(
        cat_pos = as.numeric(category),
        y_pos   = cat_pos - 0.18 - runif(n(), 0, 0.20)
    )

box_data <- rt %>%
    mutate(cat_pos = as.numeric(category))

# Plot
p <- ggplot() +
    geom_ribbon(
        data = cloud_data,
        aes(x = value, ymin = cat_pos, ymax = cat_pos + dens,
            fill = category, color = category),
        alpha = 0.55, linewidth = 0.5
    ) +
    geom_boxplot(
        data = box_data,
        aes(x = value, y = cat_pos, group = category, color = category),
        width = 0.14, fill = BOX_FILL, alpha = 0.95,
        outlier.shape = NA, linewidth = 0.5,
        orientation = "y"
    ) +
    geom_point(
        data = rain_data,
        aes(x = value, y = y_pos, color = category),
        size = 1.1, alpha = 0.55, stroke = 0
    ) +
    scale_fill_manual(values = IMPRINT_PALETTE[1:3]) +
    scale_color_manual(values = IMPRINT_PALETTE[1:3]) +
    scale_y_continuous(
        breaks = seq_along(groups),
        labels = groups,
        expand = expansion(add = c(0.45, 0.55))
    ) +
    scale_x_continuous(
        breaks = seq(300, 900, by = 100),
        labels = function(x) paste0(x, " ms"),
        limits = c(NA, 905),
        expand = expansion(mult = c(0.02, 0.01))
    ) +
    labs(
        title = "Reaction Time by Condition · raincloud-basic · r · ggplot2 · anyplot.ai",
        x = "Reaction time",
        y = NULL
    ) +
    guides(fill = "none", color = "none") +
    theme_minimal(base_size = 8) +
    theme(
        plot.background    = element_rect(fill = PAGE_BG, color = PAGE_BG),
        panel.background   = element_rect(fill = PAGE_BG, color = NA),
        panel.grid.major.x = element_line(color = GRID, linewidth = 0.1),
        panel.grid.major.y = element_blank(),
        panel.grid.minor   = element_blank(),
        axis.title.x       = element_text(color = INK, size = 10,
                                          margin = margin(t = 8)),
        axis.text.x        = element_text(color = INK_SOFT, size = 9),
        axis.text.y        = element_text(color = INK, size = 11,
                                          margin = margin(r = 6)),
        axis.line.x        = element_line(color = INK_SOFT, linewidth = 0.3),
        axis.ticks         = element_blank(),
        plot.title         = element_text(color = INK, size = 11,
                                          margin = margin(b = 14),
                                          face = "bold"),
        plot.margin        = margin(20, 28, 16, 16)
    )

ggsave(
    filename = sprintf("plot-%s.png", THEME),
    plot     = p,
    device   = ragg::agg_png,
    width    = 8,
    height   = 4.5,
    units    = "in",
    dpi      = 400
)
Runnable source as JSON, for any HTTP client: https://api.anyplot.ai/specs/raincloud-basic/ggplot2/code. Any spec id and library id listed in llms-full.txt fit the same URL shape; every URL below is complete and callable.
{
  "spec_id": "raincloud-basic",
  "language": "r",
  "library": "ggplot2",
  "page": "https://anyplot.ai/raincloud-basic/r/ggplot2",
  "hub": "https://anyplot.ai/raincloud-basic",
  "code_json": "https://api.anyplot.ai/specs/raincloud-basic/ggplot2/code",
  "spec_json": "https://api.anyplot.ai/specs/raincloud-basic",
  "render_light_png": "https://storage.googleapis.com/anyplot-images/plots/raincloud-basic/r/ggplot2/plot-light.png",
  "render_dark_png": "https://storage.googleapis.com/anyplot-images/plots/raincloud-basic/r/ggplot2/plot-dark.png",
  "quality_score": 92.0,
  "license": "MIT",
  "guide": "https://anyplot.ai/llms.txt"
}
Part of Basic Raincloud Plot on anyplot.ai.