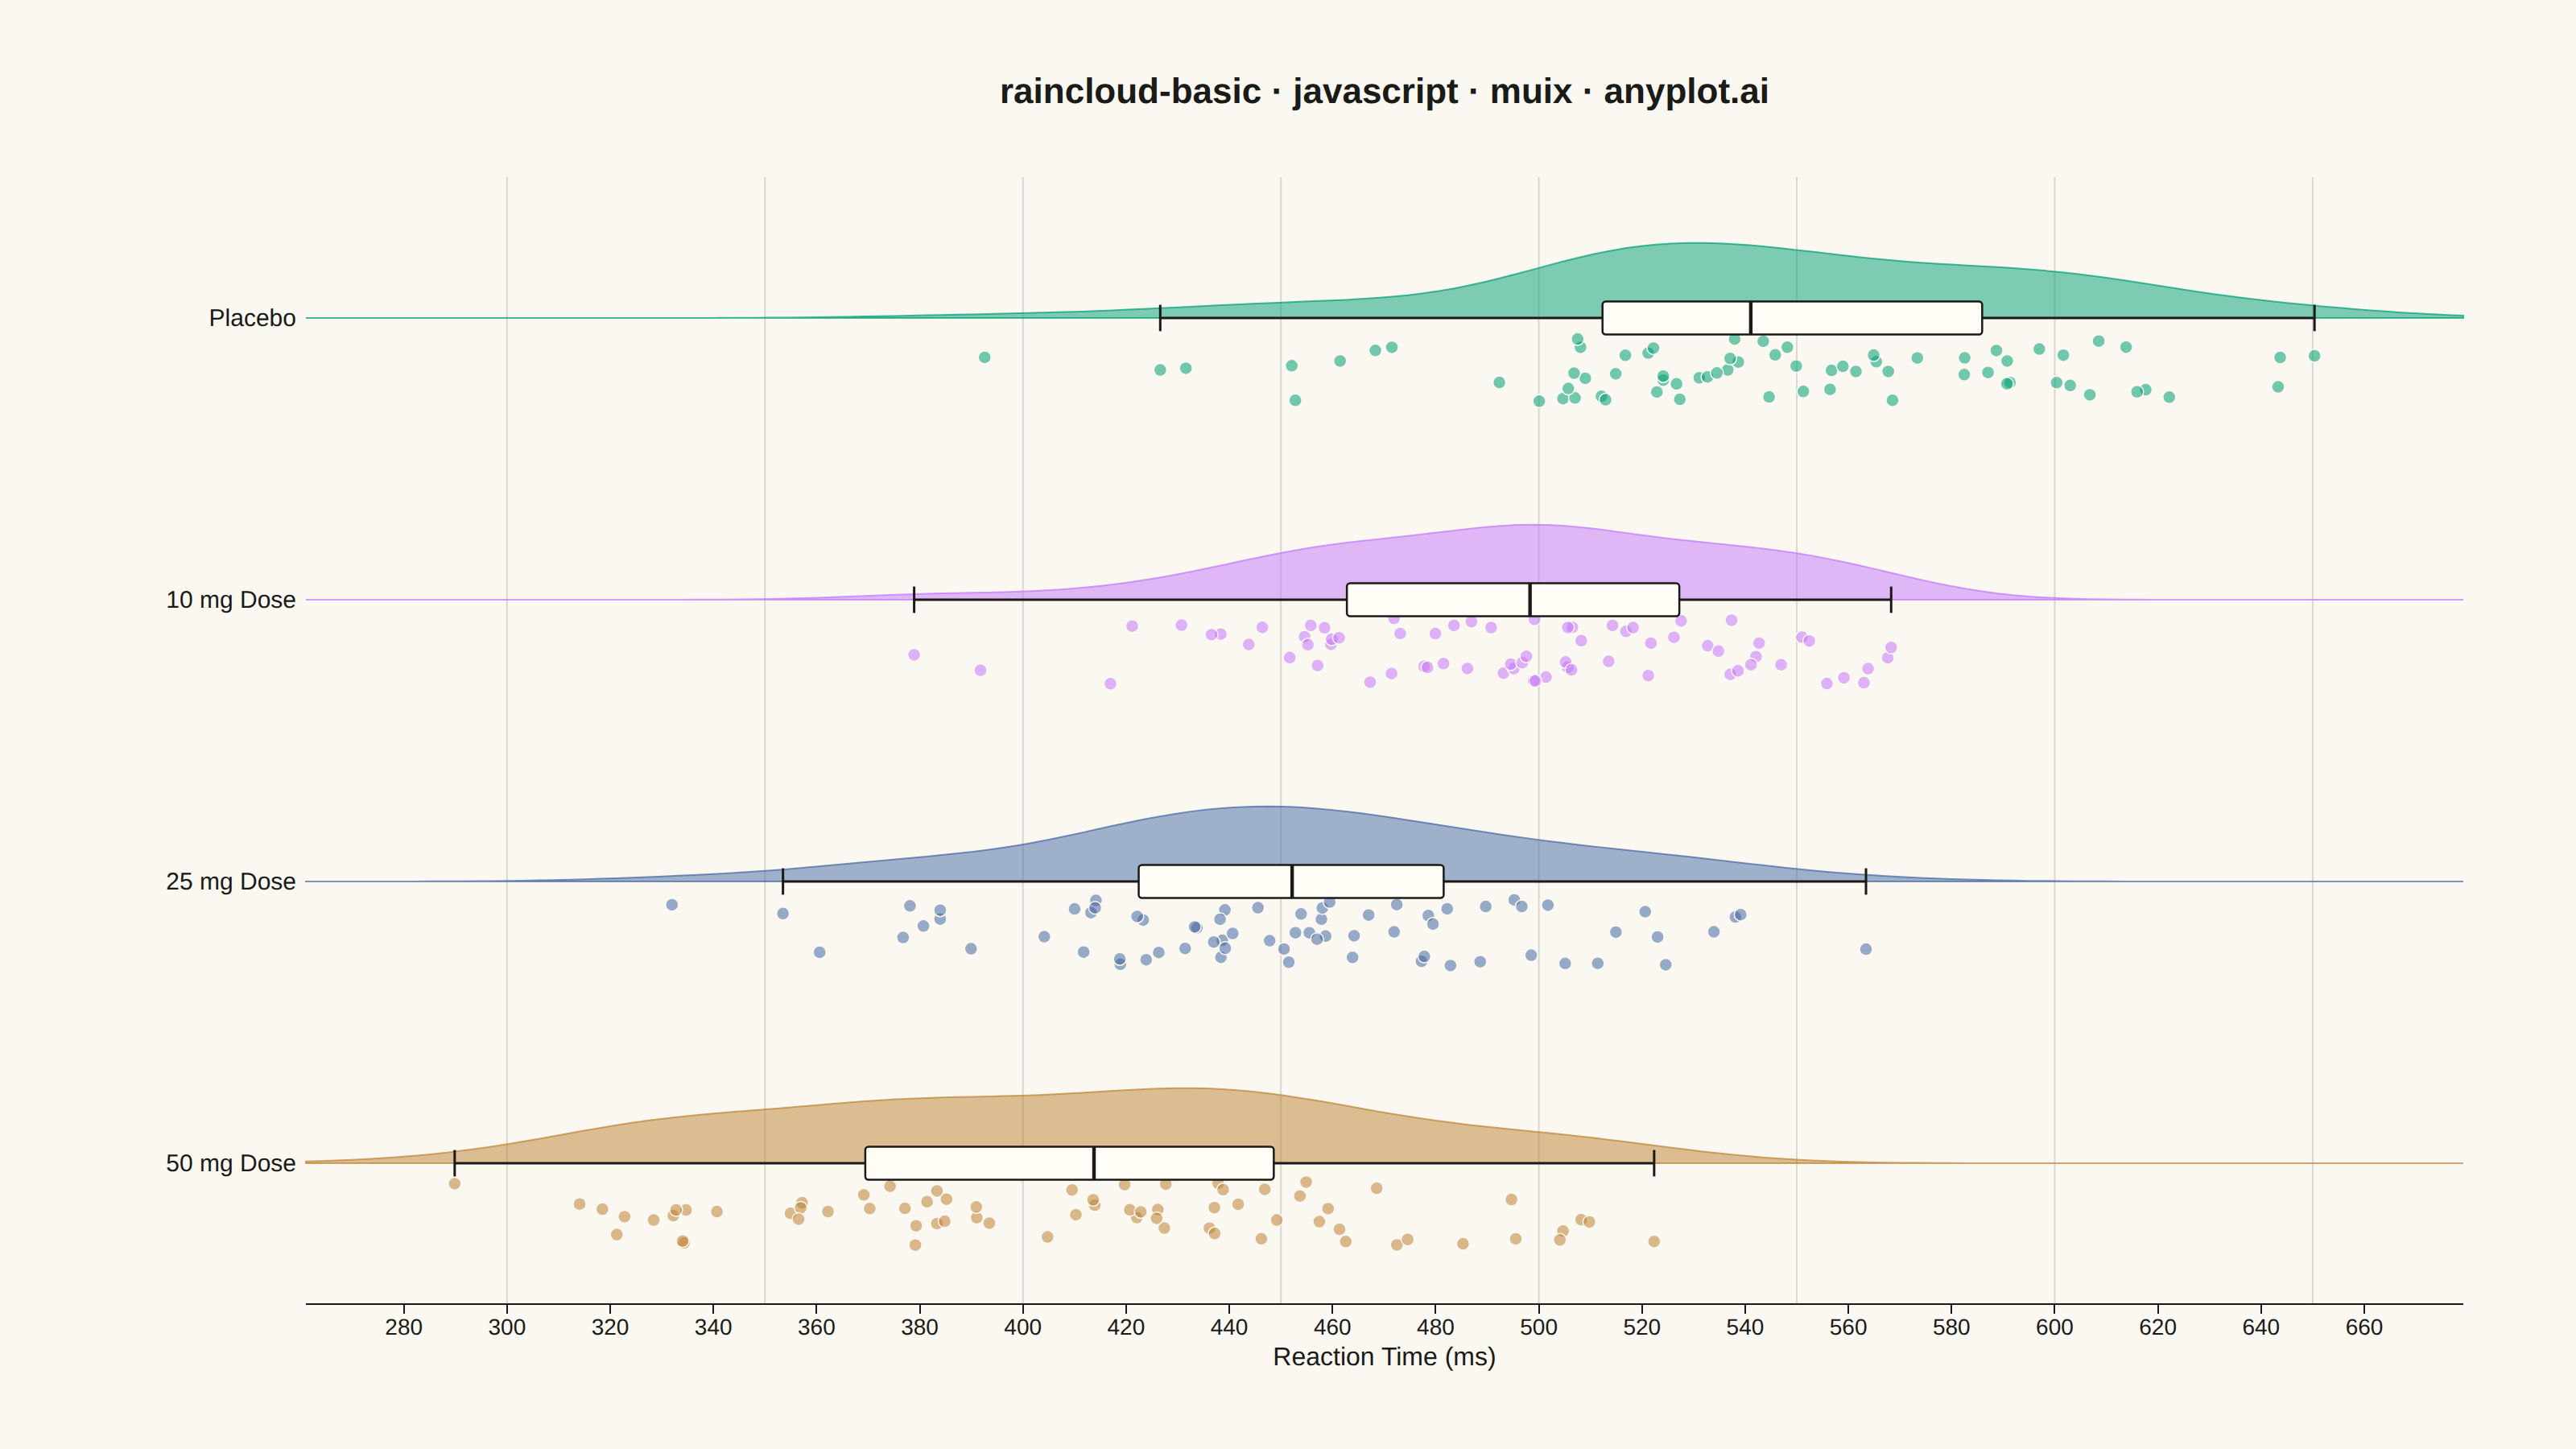
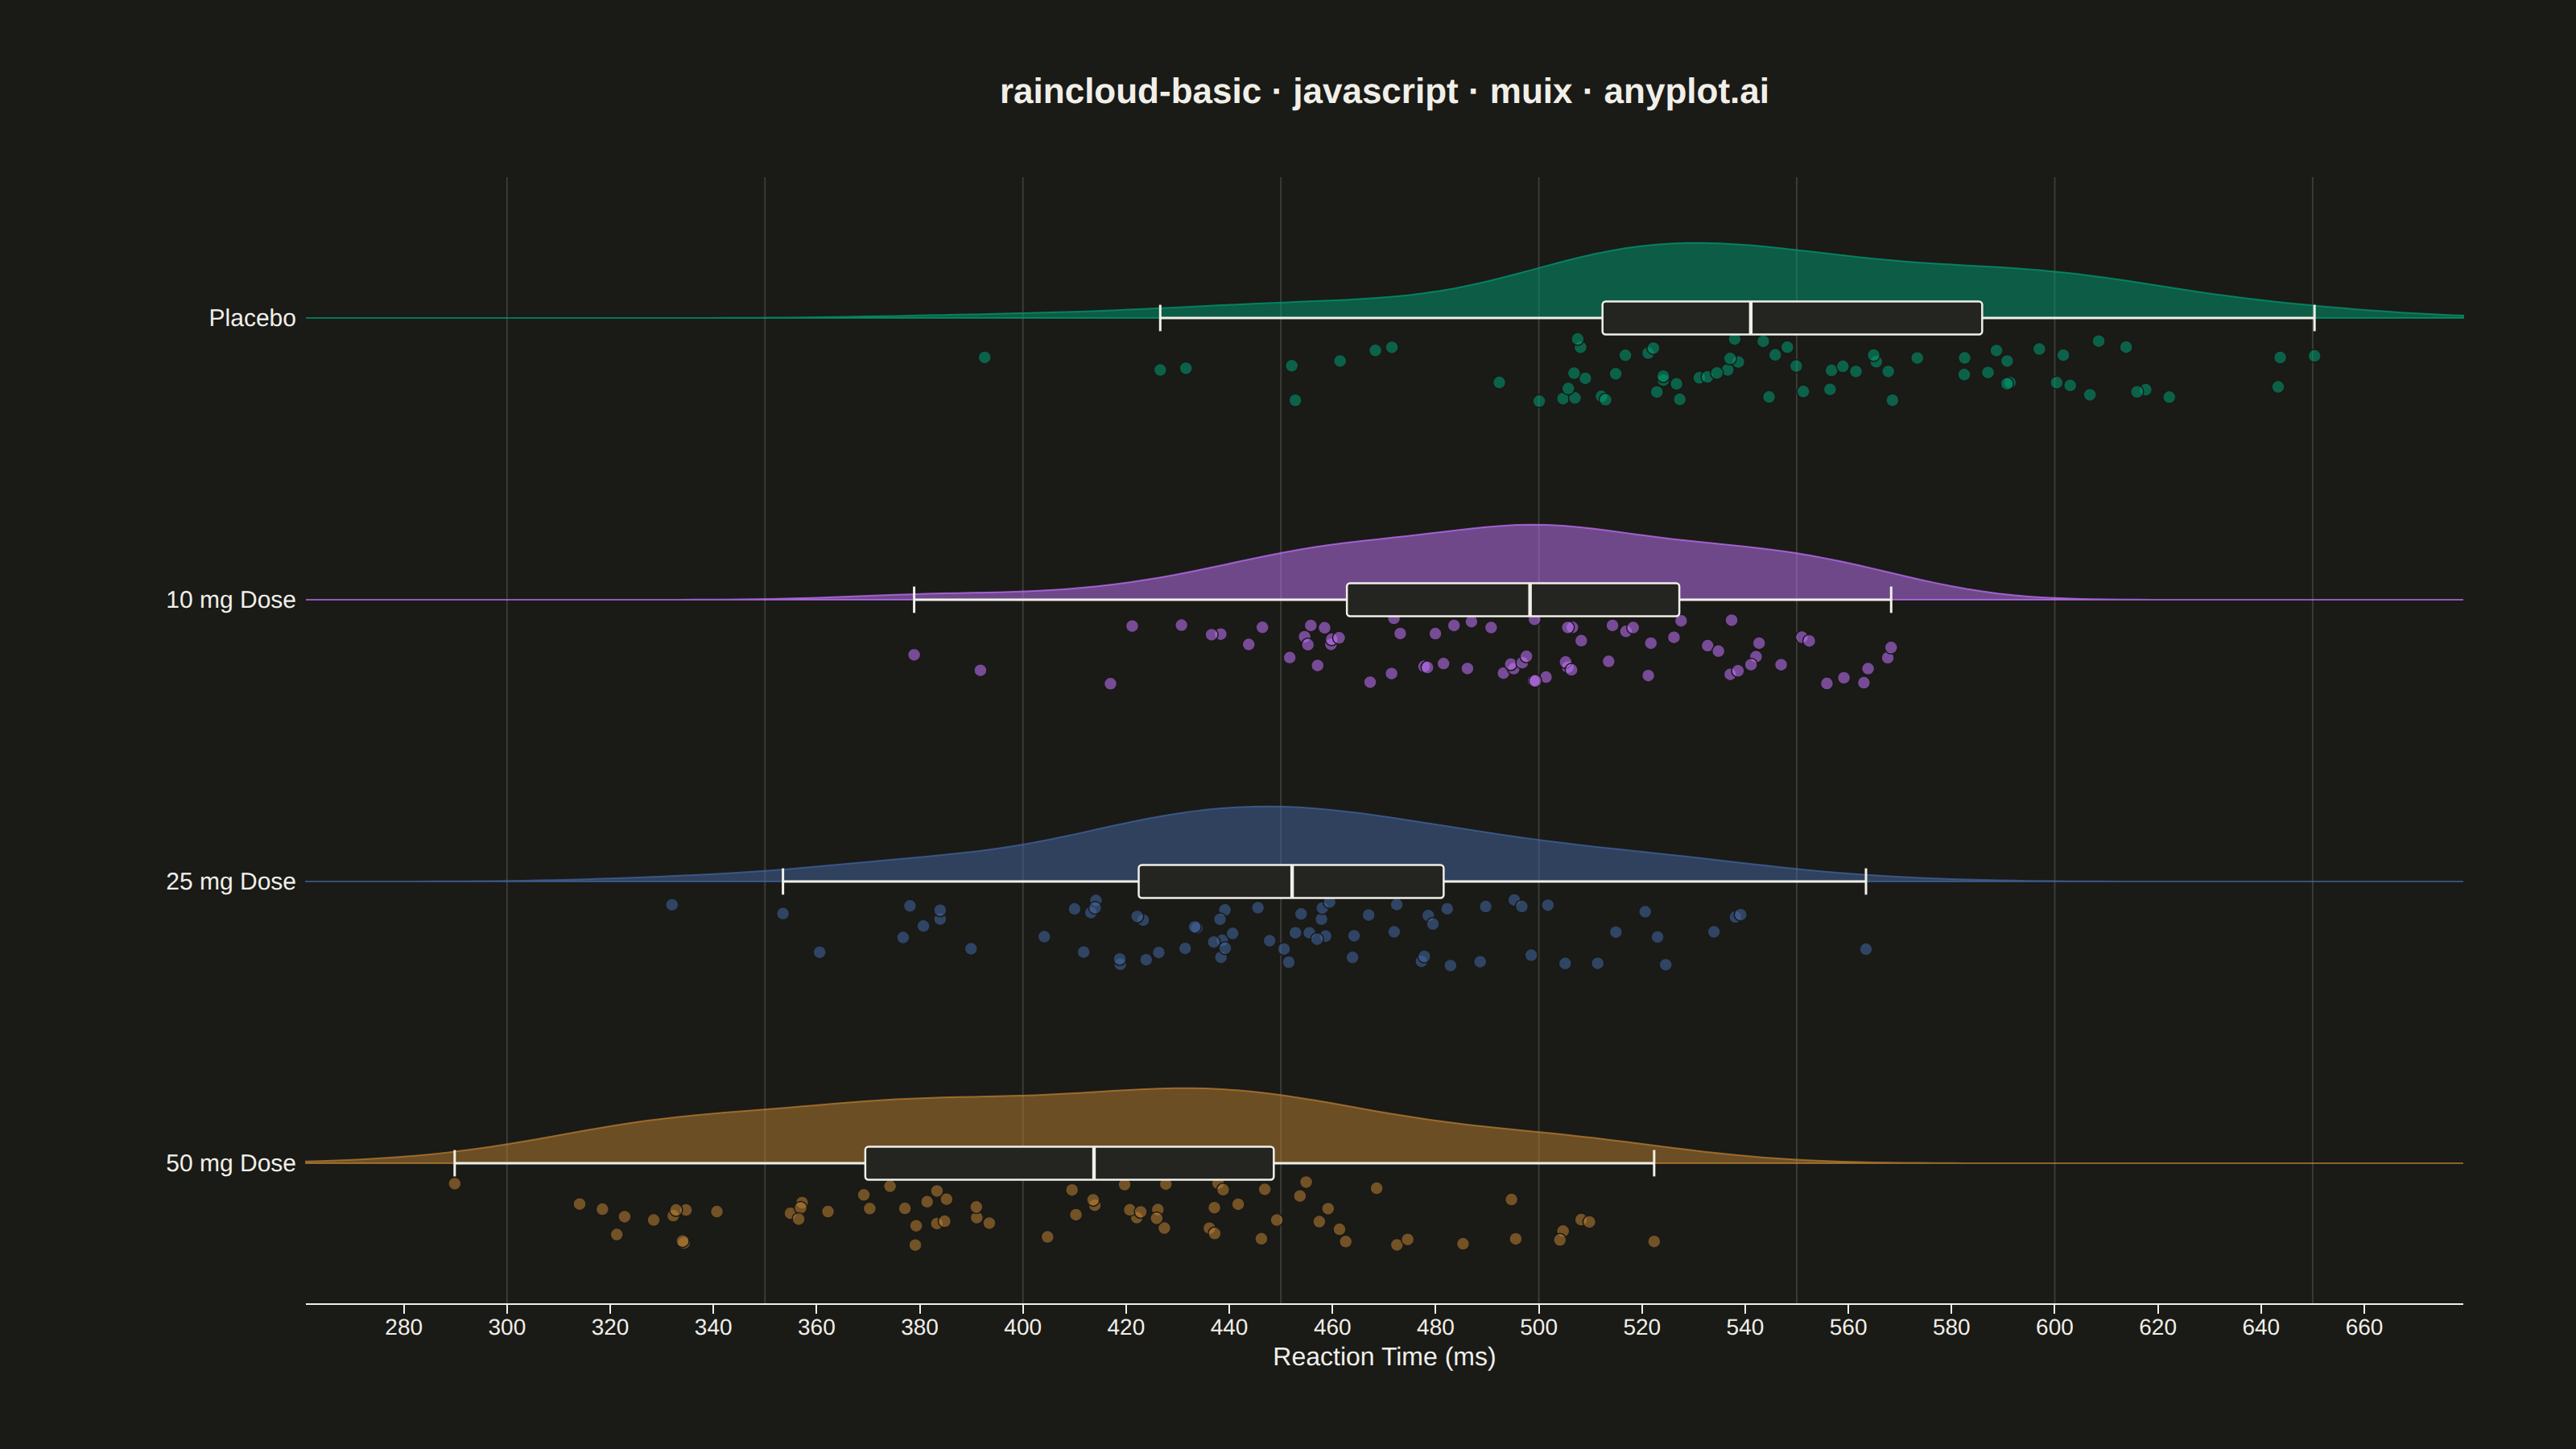
The same plot in 14 other libraries — JavaScript: Chart.js, D3.js, Apache ECharts, Highcharts; Python: Altair, Bokeh, lets-plot, Matplotlib, Plotly, plotnine, Pygal, Seaborn; R: ggplot2; Julia: Makie.jl. Compare all 15 side by side: Basic Raincloud Plot in Python, R, Julia and JavaScript.
A raincloud plot combines three visualization elements—a half-violin (the "cloud"), jittered strip points (the "rain"), and a box plot—to provide a comprehensive view of data distribution. This hybrid approach shows distribution shape, summary statistics, and individual observations simultaneously, addressing the limitation of box plots that can hide multimodal distributions. Often called the "gold standard" for transparent statistical visualization in scientific publications.
// anyplot.ai
// raincloud-basic: Basic Raincloud Plot
// Library: muix 7.29.1 | JavaScript 22.23.2
// Quality: 89/100 | Created: 2026-08-26

import { ChartContainer } from "@mui/x-charts/ChartContainer";
import { ChartsXAxis } from "@mui/x-charts/ChartsXAxis";
import { ChartsYAxis } from "@mui/x-charts/ChartsYAxis";
import { useXScale, useYScale, useDrawingArea } from "@mui/x-charts/hooks";

const t = window.ANYPLOT_TOKENS;
const FONT = "-apple-system, BlinkMacSystemFont, 'Segoe UI', Roboto, Helvetica, Arial, sans-serif";

// --- Data: reaction times (ms) across a 4-arm drug trial ---------------------
// Deterministic LCG so the sampled distributions (and their KDEs) are stable
// across renders — the browser has no seeded Math.random().
function makeLcg(seed) {
  let state = seed >>> 0;
  return function next() {
    state = (state * 1664525 + 1013904223) >>> 0;
    return state / 4294967296;
  };
}
const rand = makeLcg(42);
function gaussianSample() {
  const u1 = Math.max(rand(), 1e-9);
  const u2 = rand();
  return Math.sqrt(-2 * Math.log(u1)) * Math.cos(2 * Math.PI * u2);
}

const CATEGORIES = ["Placebo", "10 mg Dose", "25 mg Dose", "50 mg Dose"];
const N_PER_GROUP = 70;

// The 50 mg arm is deliberately bimodal (fast responders vs. non-responders)
// — exactly the shape a plain box plot would hide and a raincloud reveals.
const valuesByCategory = [
  Array.from({ length: N_PER_GROUP }, () => 540 + 55 * gaussianSample()),
  Array.from({ length: N_PER_GROUP }, () => 495 + 50 * gaussianSample()),
  Array.from({ length: N_PER_GROUP }, () => 445 + 48 * gaussianSample()),
  Array.from({ length: N_PER_GROUP }, () =>
    rand() < 0.55 ? 360 + 35 * gaussianSample() : 470 + 40 * gaussianSample()
  ),
];
// Jitter fractions for the "rain", drawn from the same deterministic stream
// right after the data so the whole script's randomness stays reproducible.
const jittersByCategory = valuesByCategory.map((values) => values.map(() => rand()));

const allValues = valuesByCategory.flat();
const dataMin = Math.min(...allValues);
const dataMax = Math.max(...allValues);
const xPad = (dataMax - dataMin) * 0.08;
const X_MIN = dataMin - xPad;
const X_MAX = dataMax + xPad;

// --- Box-plot summary stats (Tukey whiskers, 1.5×IQR) ------------------------
function quantile(sorted, q) {
  const pos = (sorted.length - 1) * q;
  const base = Math.floor(pos);
  const rest = pos - base;
  return sorted[base + 1] !== undefined ? sorted[base] + rest * (sorted[base + 1] - sorted[base]) : sorted[base];
}
function boxStats(values) {
  const sorted = [...values].sort((a, b) => a - b);
  const q1 = quantile(sorted, 0.25);
  const median = quantile(sorted, 0.5);
  const q3 = quantile(sorted, 0.75);
  const iqr = q3 - q1;
  const lowerFence = q1 - 1.5 * iqr;
  const upperFence = q3 + 1.5 * iqr;
  const lowerWhisker = sorted.find((v) => v >= lowerFence) ?? sorted[0];
  const upperWhisker = [...sorted].reverse().find((v) => v <= upperFence) ?? sorted[sorted.length - 1];
  return { q1, median, q3, lowerWhisker, upperWhisker };
}
const statsByCategory = valuesByCategory.map(boxStats);

// --- Gaussian KDE per group, Silverman bandwidth, normalized to its own peak
// so the "cloud" shows shape (including the 50 mg arm's two humps), not raw n.
const GRID_N = 140;
const grid = Array.from({ length: GRID_N }, (_, k) => X_MIN + (k * (X_MAX - X_MIN)) / (GRID_N - 1));
function stdOf(values) {
  const m = values.reduce((a, b) => a + b, 0) / values.length;
  const variance = values.reduce((a, b) => a + (b - m) ** 2, 0) / (values.length - 1);
  return Math.sqrt(variance);
}
function kde(values) {
  const n = values.length;
  const bandwidth = 0.9 * stdOf(values) * Math.pow(n, -0.2);
  const raw = grid.map((gx) => values.reduce((sum, v) => sum + Math.exp(-0.5 * ((gx - v) / bandwidth) ** 2), 0));
  const peak = Math.max(...raw);
  return raw.map((v) => v / peak);
}
const densityByCategory = valuesByCategory.map(kde);

// --- Cloud (half-violin, upward) + rain (jittered points, downward) + box ---
// drawn with raw SVG positioned by the chart's own scales — MUI X's documented
// composition API for chart types the community package has no built-in for.
function CloudRainBox() {
  const xScale = useXScale("value");
  const yScale = useYScale("category");

  return (
    <g>
      {CATEGORIES.map((cat, i) => {
        const color = t.palette[i % t.palette.length];
        const bandWidth = yScale.bandwidth();
        const baselineY = yScale(cat) + bandWidth / 2;
        const halfBand = bandWidth / 2;
        const cloudPeakPx = halfBand * 0.82;
        const rainNear = halfBand * 0.2;
        const rainFar = halfBand * 0.92;
        const boxHalfHeight = Math.min(11, halfBand * 0.18);

        const density = densityByCategory[i];
        const cloudPoints = grid.map((gx, k) => `${xScale(gx)},${baselineY - density[k] * cloudPeakPx}`);
        const cloudPath = `M${xScale(grid[0])},${baselineY} L${cloudPoints.join(" L")} L${xScale(grid[GRID_N - 1])},${baselineY} Z`;

        const { q1, median, q3, lowerWhisker, upperWhisker } = statsByCategory[i];
        const boxTop = baselineY - boxHalfHeight;
        const boxBottom = baselineY + boxHalfHeight;

        return (
          <g key={cat}>
            <path d={cloudPath} fill={color} fillOpacity={0.5} stroke={color} strokeOpacity={0.7} strokeWidth={1} />
            {valuesByCategory[i].map((v, j) => (
              <circle
                key={j}
                cx={xScale(v)}
                cy={baselineY + rainNear + jittersByCategory[i][j] * (rainFar - rainNear)}
                r={4}
                fill={color}
                fillOpacity={0.55}
                stroke={t.pageBg}
                strokeWidth={0.75}
              />
            ))}
            <line x1={xScale(lowerWhisker)} x2={xScale(upperWhisker)} y1={baselineY} y2={baselineY} stroke={t.ink} strokeWidth={1.5} />
            <line
              x1={xScale(lowerWhisker)}
              x2={xScale(lowerWhisker)}
              y1={baselineY - boxHalfHeight * 0.8}
              y2={baselineY + boxHalfHeight * 0.8}
              stroke={t.ink}
              strokeWidth={1.5}
            />
            <line
              x1={xScale(upperWhisker)}
              x2={xScale(upperWhisker)}
              y1={baselineY - boxHalfHeight * 0.8}
              y2={baselineY + boxHalfHeight * 0.8}
              stroke={t.ink}
              strokeWidth={1.5}
            />
            <rect
              x={xScale(q1)}
              y={boxTop}
              width={xScale(q3) - xScale(q1)}
              height={boxHalfHeight * 2}
              fill={t.elevatedBg}
              stroke={t.ink}
              strokeWidth={1.25}
              rx={2}
            />
            <line x1={xScale(median)} x2={xScale(median)} y1={boxTop} y2={boxBottom} stroke={t.ink} strokeWidth={2.2} />
          </g>
        );
      })}
    </g>
  );
}

// Subtle vertical gridlines (15%-opacity ink, per style guide) aligned with
// the x-axis ticks, so exact reaction-time values are easier to compare
// across the four category rows.
function Gridlines() {
  const xScale = useXScale("value");
  const { top, height } = useDrawingArea();
  const ticks = xScale.ticks ? xScale.ticks(8) : [];

  return (
    <g>
      {ticks.map((tick) => (
        <line key={tick} x1={xScale(tick)} x2={xScale(tick)} y1={top} y2={top + height} stroke={t.grid} strokeWidth={1} />
      ))}
    </g>
  );
}

function ChartTitle({ text, fontSize }) {
  const { left, top, width: drawW } = useDrawingArea();
  return (
    <text x={left + drawW / 2} y={top - 46} textAnchor="middle" fontSize={fontSize} fontWeight={600} fill={t.ink} fontFamily={FONT}>
      {text}
    </text>
  );
}

export default function Chart() {
  const W = window.ANYPLOT_SIZE.width;
  const H = window.ANYPLOT_SIZE.height;

  const title = "raincloud-basic · javascript · muix · anyplot.ai";
  const titleSize = title.length > 67 ? Math.round(22 * (67 / title.length)) : 22;

  return (
    <ChartContainer
      width={W}
      height={H}
      skipAnimation
      series={[]}
      xAxis={[
        {
          id: "value",
          scaleType: "linear",
          min: X_MIN,
          max: X_MAX,
          label: "Reaction Time (ms)",
          labelStyle: { fontSize: 16 },
          tickLabelStyle: { fontSize: 14 },
        },
      ]}
      yAxis={[
        {
          id: "category",
          scaleType: "band",
          data: CATEGORIES,
          categoryGapRatio: 0.35,
          tickLabelStyle: { fontSize: 15 },
        },
      ]}
      margin={{ top: 110, right: 70, bottom: 90, left: 190 }}
    >
      <ChartTitle text={title} fontSize={titleSize} />
      <Gridlines />
      <CloudRainBox />
      <ChartsXAxis axisId="value" position="bottom" />
      <ChartsYAxis axisId="category" position="left" disableTicks disableLine />
    </ChartContainer>
  );
}
Runnable source as JSON, for any HTTP client: https://api.anyplot.ai/specs/raincloud-basic/muix/code. Any spec id and library id listed in llms-full.txt fit the same URL shape; every URL below is complete and callable.
{
  "spec_id": "raincloud-basic",
  "language": "javascript",
  "library": "muix",
  "page": "https://anyplot.ai/raincloud-basic/javascript/muix",
  "hub": "https://anyplot.ai/raincloud-basic",
  "code_json": "https://api.anyplot.ai/specs/raincloud-basic/muix/code",
  "spec_json": "https://api.anyplot.ai/specs/raincloud-basic",
  "render_light_png": "https://storage.googleapis.com/anyplot-images/plots/raincloud-basic/javascript/muix/plot-light.png",
  "render_dark_png": "https://storage.googleapis.com/anyplot-images/plots/raincloud-basic/javascript/muix/plot-dark.png",
  "interactive_light_html": "https://storage.googleapis.com/anyplot-images/plots/raincloud-basic/javascript/muix/plot-light.html",
  "interactive_dark_html": "https://storage.googleapis.com/anyplot-images/plots/raincloud-basic/javascript/muix/plot-dark.html",
  "quality_score": 89.0,
  "license": "MIT",
  "guide": "https://anyplot.ai/llms.txt"
}
Part of Basic Raincloud Plot on anyplot.ai.