The same plot in 14 other libraries — JavaScript: Chart.js, D3.js, Highcharts, MUI X Charts; Python: Altair, Bokeh, lets-plot, Matplotlib, Plotly, plotnine, Pygal, Seaborn; R: ggplot2; Julia: Makie.jl. Compare all 15 side by side: Basic Raincloud Plot in Python, R, Julia and JavaScript.
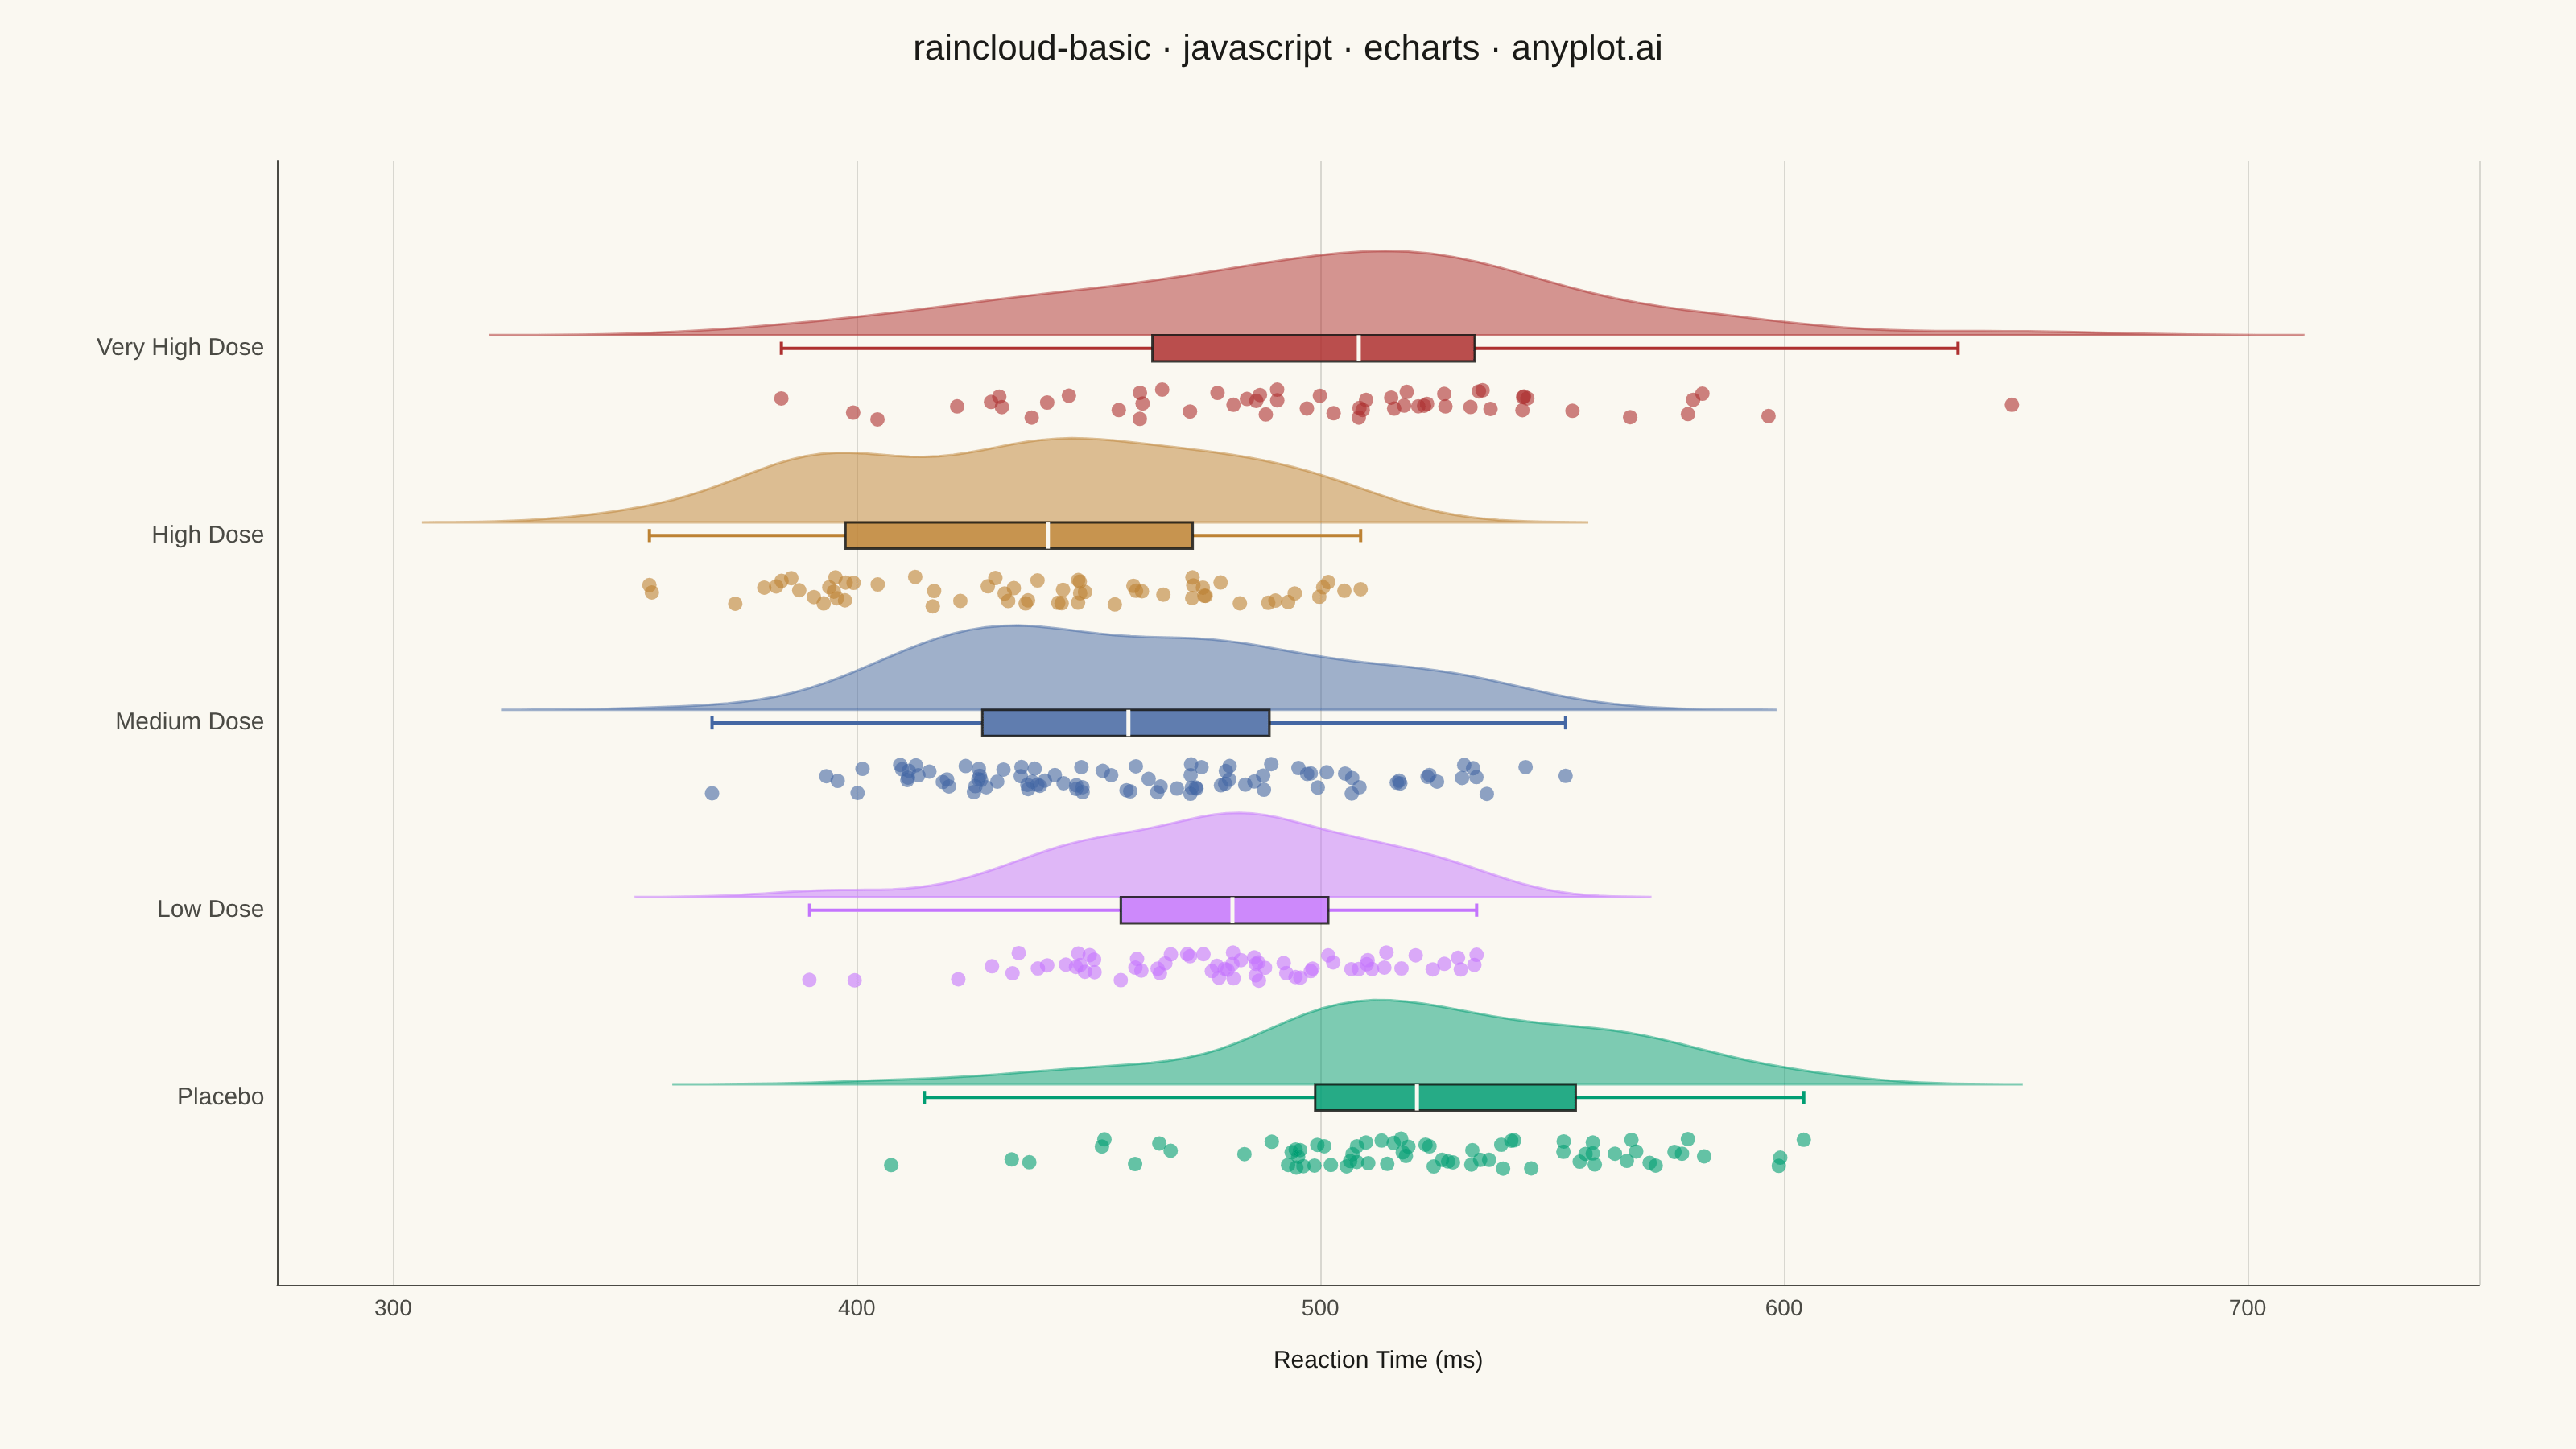
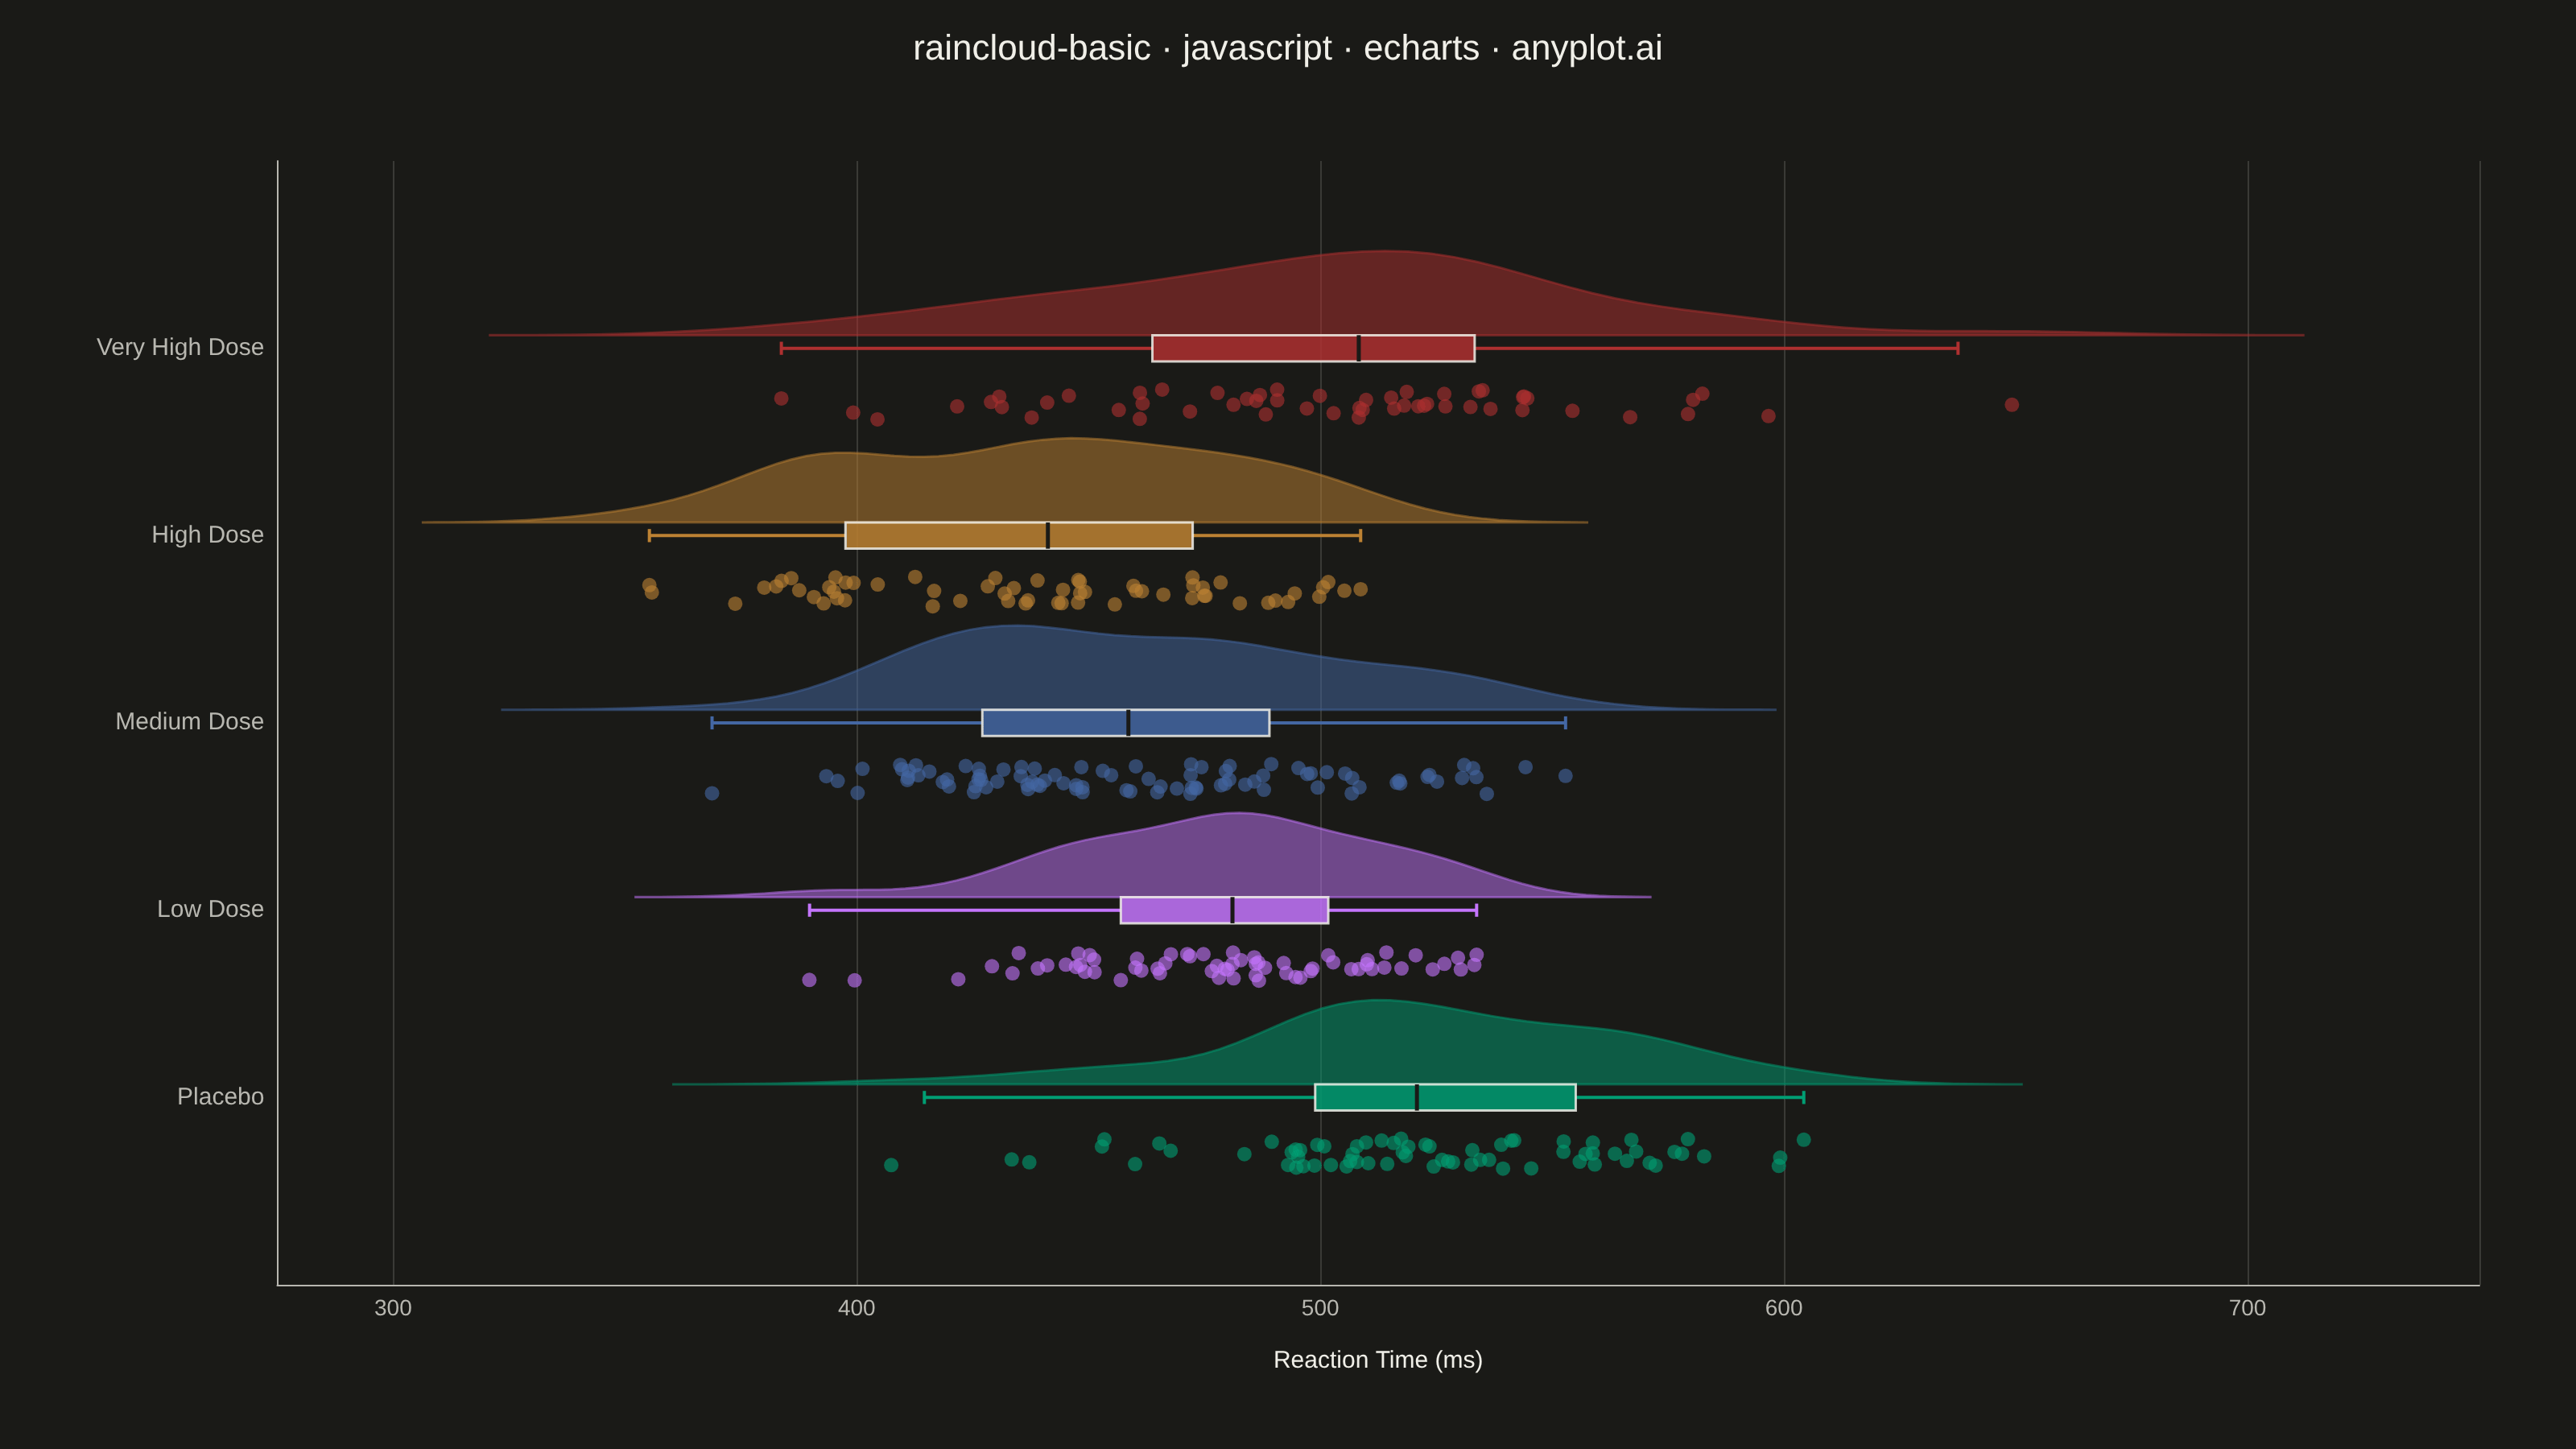
A raincloud plot combines three visualization elements—a half-violin (the "cloud"), jittered strip points (the "rain"), and a box plot—to provide a comprehensive view of data distribution. This hybrid approach shows distribution shape, summary statistics, and individual observations simultaneously, addressing the limitation of box plots that can hide multimodal distributions. Often called the "gold standard" for transparent statistical visualization in scientific publications.
// anyplot.ai
// raincloud-basic: Basic Raincloud Plot
// Library: echarts 6.1.0 | JavaScript 22.23.2
// Quality: 96/100 | Created: 2026-08-26

const t = window.ANYPLOT_TOKENS;

// --- Data (in-memory, deterministic LCG) ------------------------------------
// Reaction time (ms) in a cognitive task, measured under increasing caffeine
// dosage. "Medium Dose" is a deliberate two-component mixture (responders vs.
// non-responders) to demonstrate why the cloud (KDE) catches shapes a plain
// box plot would hide.
function makeLcg(seed) {
  let state = seed >>> 0;
  return () => {
    state = (state * 1664525 + 1013904223) >>> 0;
    return state / 4294967296;
  };
}
const rand = makeLcg(42);

function randNormal(mean, std) {
  const u1 = Math.max(rand(), 1e-9);
  const u2 = rand();
  const z = Math.sqrt(-2 * Math.log(u1)) * Math.cos(2 * Math.PI * u2);
  return mean + z * std;
}

const categories = ["Placebo", "Low Dose", "Medium Dose", "High Dose", "Very High Dose"];
const sampleSizes = [70, 65, 90, 60, 55];

const rawData = [
  Array.from({ length: sampleSizes[0] }, () => randNormal(520, 42)),
  Array.from({ length: sampleSizes[1] }, () => randNormal(478, 38)),
  Array.from({ length: sampleSizes[2] }, () =>
    rand() < 0.55 ? randNormal(430, 26) : randNormal(505, 30)
  ),
  Array.from({ length: sampleSizes[3] }, () => randNormal(452, 48)),
  Array.from({ length: sampleSizes[4] }, () => randNormal(498, 58)),
];

// --- Statistics helpers -------------------------------------------------
function quantile(sorted, p) {
  const idx = p * (sorted.length - 1);
  const lo = Math.floor(idx);
  const hi = Math.ceil(idx);
  if (lo === hi) return sorted[lo];
  return sorted[lo] + (sorted[hi] - sorted[lo]) * (idx - lo);
}

function stdDev(arr) {
  const mean = arr.reduce((a, b) => a + b, 0) / arr.length;
  const variance = arr.reduce((a, b) => a + (b - mean) ** 2, 0) / (arr.length - 1);
  return Math.sqrt(variance);
}

const GRID_SIZE = 80;
const CLOUD_HEIGHT = 0.45;
const BOX_HALF_HEIGHT = 0.07;
const RAIN_CENTER_OFFSET = 0.3;
const RAIN_JITTER_HALF_WIDTH = 0.08;

const boxStats = [];
const violinData = [];
const rainPoints = [];
let globalMin = Infinity;
let globalMax = -Infinity;

rawData.forEach((data, i) => {
  const sorted = [...data].sort((a, b) => a - b);
  const q1 = quantile(sorted, 0.25);
  const median = quantile(sorted, 0.5);
  const q3 = quantile(sorted, 0.75);
  const iqr = q3 - q1;
  const whiskerLow = Math.max(sorted[0], q1 - 1.5 * iqr);
  const whiskerHigh = Math.min(sorted[sorted.length - 1], q3 + 1.5 * iqr);
  boxStats.push({ whiskerLow, q1, median, q3, whiskerHigh });

  const bw = 0.9 * Math.min(stdDev(data), iqr / 1.34) * Math.pow(data.length, -0.2);
  const gridMin = sorted[0] - 3 * bw;
  const gridMax = sorted[sorted.length - 1] + 3 * bw;
  const grid = Array.from(
    { length: GRID_SIZE },
    (_, k) => gridMin + ((gridMax - gridMin) * k) / (GRID_SIZE - 1)
  );
  const density = grid.map((gx) => {
    let sum = 0;
    for (const xi of data) {
      const u = (gx - xi) / bw;
      sum += Math.exp(-0.5 * u * u);
    }
    return sum / (data.length * bw * Math.sqrt(2 * Math.PI));
  });
  const maxDensity = Math.max(...density);
  violinData.push(grid.map((gx, k) => [gx, density[k] / maxDensity]));

  const jittered = data.map((value) => [
    value,
    i - RAIN_CENTER_OFFSET + (rand() * 2 - 1) * RAIN_JITTER_HALF_WIDTH,
  ]);
  rainPoints.push(jittered);

  globalMin = Math.min(globalMin, gridMin);
  globalMax = Math.max(globalMax, gridMax);
});

const xPad = (globalMax - globalMin) * 0.04;
const xMin = Math.floor((globalMin - xPad) / 25) * 25;
const xMax = Math.ceil((globalMax + xPad) / 25) * 25;
// Integer bounds so the yAxis interval:1 ticks land exactly on category rows.
const yMin = -1;
const yMax = categories.length;

// --- Init ---------------------------------------------------------------
const chart = echarts.init(document.getElementById("container"));

// --- Series builders ------------------------------------------------------
const cloudSeries = {
  name: "cloud",
  type: "custom",
  coordinateSystem: "cartesian2d",
  data: categories.map((_, i) => i),
  renderItem: (params, api) => {
    const i = params.dataIndex;
    const base = i + BOX_HALF_HEIGHT;
    const topPoints = violinData[i].map(([gx, d]) => api.coord([gx, base + d * CLOUD_HEIGHT]));
    const basePoints = violinData[i].map(([gx]) => api.coord([gx, base])).reverse();
    const color = t.palette[i % t.palette.length];
    return {
      type: "polygon",
      shape: { points: topPoints.concat(basePoints) },
      style: { fill: color, opacity: 0.5, stroke: color, lineWidth: 1.5 },
    };
  },
  z: 2,
};

const boxSeries = {
  name: "box",
  type: "custom",
  coordinateSystem: "cartesian2d",
  data: categories.map((_, i) => i),
  renderItem: (params, api) => {
    const i = params.dataIndex;
    const s = boxStats[i];
    const color = t.palette[i % t.palette.length];
    const top = i + BOX_HALF_HEIGHT;
    const bottom = i - BOX_HALF_HEIGHT;
    const q1Top = api.coord([s.q1, top]);
    const q3Bottom = api.coord([s.q3, bottom]);
    const whiskerLowStart = api.coord([s.whiskerLow, i]);
    const whiskerLowEnd = api.coord([s.q1, i]);
    const whiskerHighStart = api.coord([s.q3, i]);
    const whiskerHighEnd = api.coord([s.whiskerHigh, i]);
    const capLowTop = api.coord([s.whiskerLow, i + BOX_HALF_HEIGHT * 0.5]);
    const capLowBottom = api.coord([s.whiskerLow, i - BOX_HALF_HEIGHT * 0.5]);
    const capHighTop = api.coord([s.whiskerHigh, i + BOX_HALF_HEIGHT * 0.5]);
    const capHighBottom = api.coord([s.whiskerHigh, i - BOX_HALF_HEIGHT * 0.5]);
    const medianTop = api.coord([s.median, top]);
    const medianBottom = api.coord([s.median, bottom]);
    const line = (p1, p2) => ({
      type: "line",
      shape: { x1: p1[0], y1: p1[1], x2: p2[0], y2: p2[1] },
      style: { stroke: color, lineWidth: 2 },
    });
    return {
      type: "group",
      children: [
        line(whiskerLowStart, whiskerLowEnd),
        line(whiskerHighStart, whiskerHighEnd),
        line(capLowTop, capLowBottom),
        line(capHighTop, capHighBottom),
        {
          type: "rect",
          shape: {
            x: q1Top[0],
            y: q1Top[1],
            width: q3Bottom[0] - q1Top[0],
            height: q3Bottom[1] - q1Top[1],
          },
          style: { fill: color, opacity: 0.85, stroke: t.ink, lineWidth: 1.5 },
        },
        {
          type: "line",
          shape: { x1: medianTop[0], y1: medianTop[1], x2: medianBottom[0], y2: medianBottom[1] },
          style: { stroke: t.pageBg, lineWidth: 2.5 },
        },
      ],
    };
  },
  z: 3,
};

const rainSeries = categories.map((_, i) => ({
  name: `rain-${i}`,
  type: "scatter",
  data: rainPoints[i],
  symbolSize: 9,
  itemStyle: { color: t.palette[i % t.palette.length], opacity: 0.6 },
  z: 4,
}));

// --- Option ---------------------------------------------------------------
chart.setOption({
  animation: false,
  backgroundColor: "transparent",
  title: {
    text: "raincloud-basic · javascript · echarts · anyplot.ai",
    left: "center",
    textStyle: { color: t.ink, fontSize: 22, fontWeight: 500 },
  },
  grid: { left: 60, right: 60, top: 100, bottom: 80, containLabel: true },
  xAxis: {
    type: "value",
    name: "Reaction Time (ms)",
    nameLocation: "middle",
    nameGap: 40,
    nameTextStyle: { color: t.ink, fontSize: 15 },
    min: xMin,
    max: xMax,
    axisLabel: { color: t.inkSoft, fontSize: 14, showMinLabel: false, showMaxLabel: false },
    axisLine: { onZero: false, lineStyle: { color: t.inkSoft } },
    axisTick: { show: false },
    splitLine: { lineStyle: { color: t.grid } },
  },
  yAxis: {
    type: "value",
    min: yMin,
    max: yMax,
    interval: 1,
    axisLabel: {
      color: t.inkSoft,
      fontSize: 15,
      formatter: (val) =>
        Math.abs(val - Math.round(val)) < 1e-6 && categories[Math.round(val)]
          ? categories[Math.round(val)]
          : "",
    },
    axisLine: { onZero: false, lineStyle: { color: t.inkSoft } },
    axisTick: { show: false },
    splitLine: { show: false },
  },
  series: [cloudSeries, boxSeries, ...rainSeries],
});
Runnable source as JSON, for any HTTP client: https://api.anyplot.ai/specs/raincloud-basic/echarts/code. Any spec id and library id listed in llms-full.txt fit the same URL shape; every URL below is complete and callable.
{
  "spec_id": "raincloud-basic",
  "language": "javascript",
  "library": "echarts",
  "page": "https://anyplot.ai/raincloud-basic/javascript/echarts",
  "hub": "https://anyplot.ai/raincloud-basic",
  "code_json": "https://api.anyplot.ai/specs/raincloud-basic/echarts/code",
  "spec_json": "https://api.anyplot.ai/specs/raincloud-basic",
  "render_light_png": "https://storage.googleapis.com/anyplot-images/plots/raincloud-basic/javascript/echarts/plot-light.png",
  "render_dark_png": "https://storage.googleapis.com/anyplot-images/plots/raincloud-basic/javascript/echarts/plot-dark.png",
  "interactive_light_html": "https://storage.googleapis.com/anyplot-images/plots/raincloud-basic/javascript/echarts/plot-light.html",
  "interactive_dark_html": "https://storage.googleapis.com/anyplot-images/plots/raincloud-basic/javascript/echarts/plot-dark.html",
  "quality_score": 96.0,
  "license": "MIT",
  "guide": "https://anyplot.ai/llms.txt"
}
Part of Basic Raincloud Plot on anyplot.ai.