The same plot in 14 other libraries — Python: Altair, Bokeh, lets-plot, Matplotlib, Plotly, plotnine, Pygal, Seaborn; R: ggplot2; JavaScript: Chart.js, D3.js, Apache ECharts, Highcharts, MUI X Charts. Compare all 15 side by side: Basic Raincloud Plot in Python, R, Julia and JavaScript.
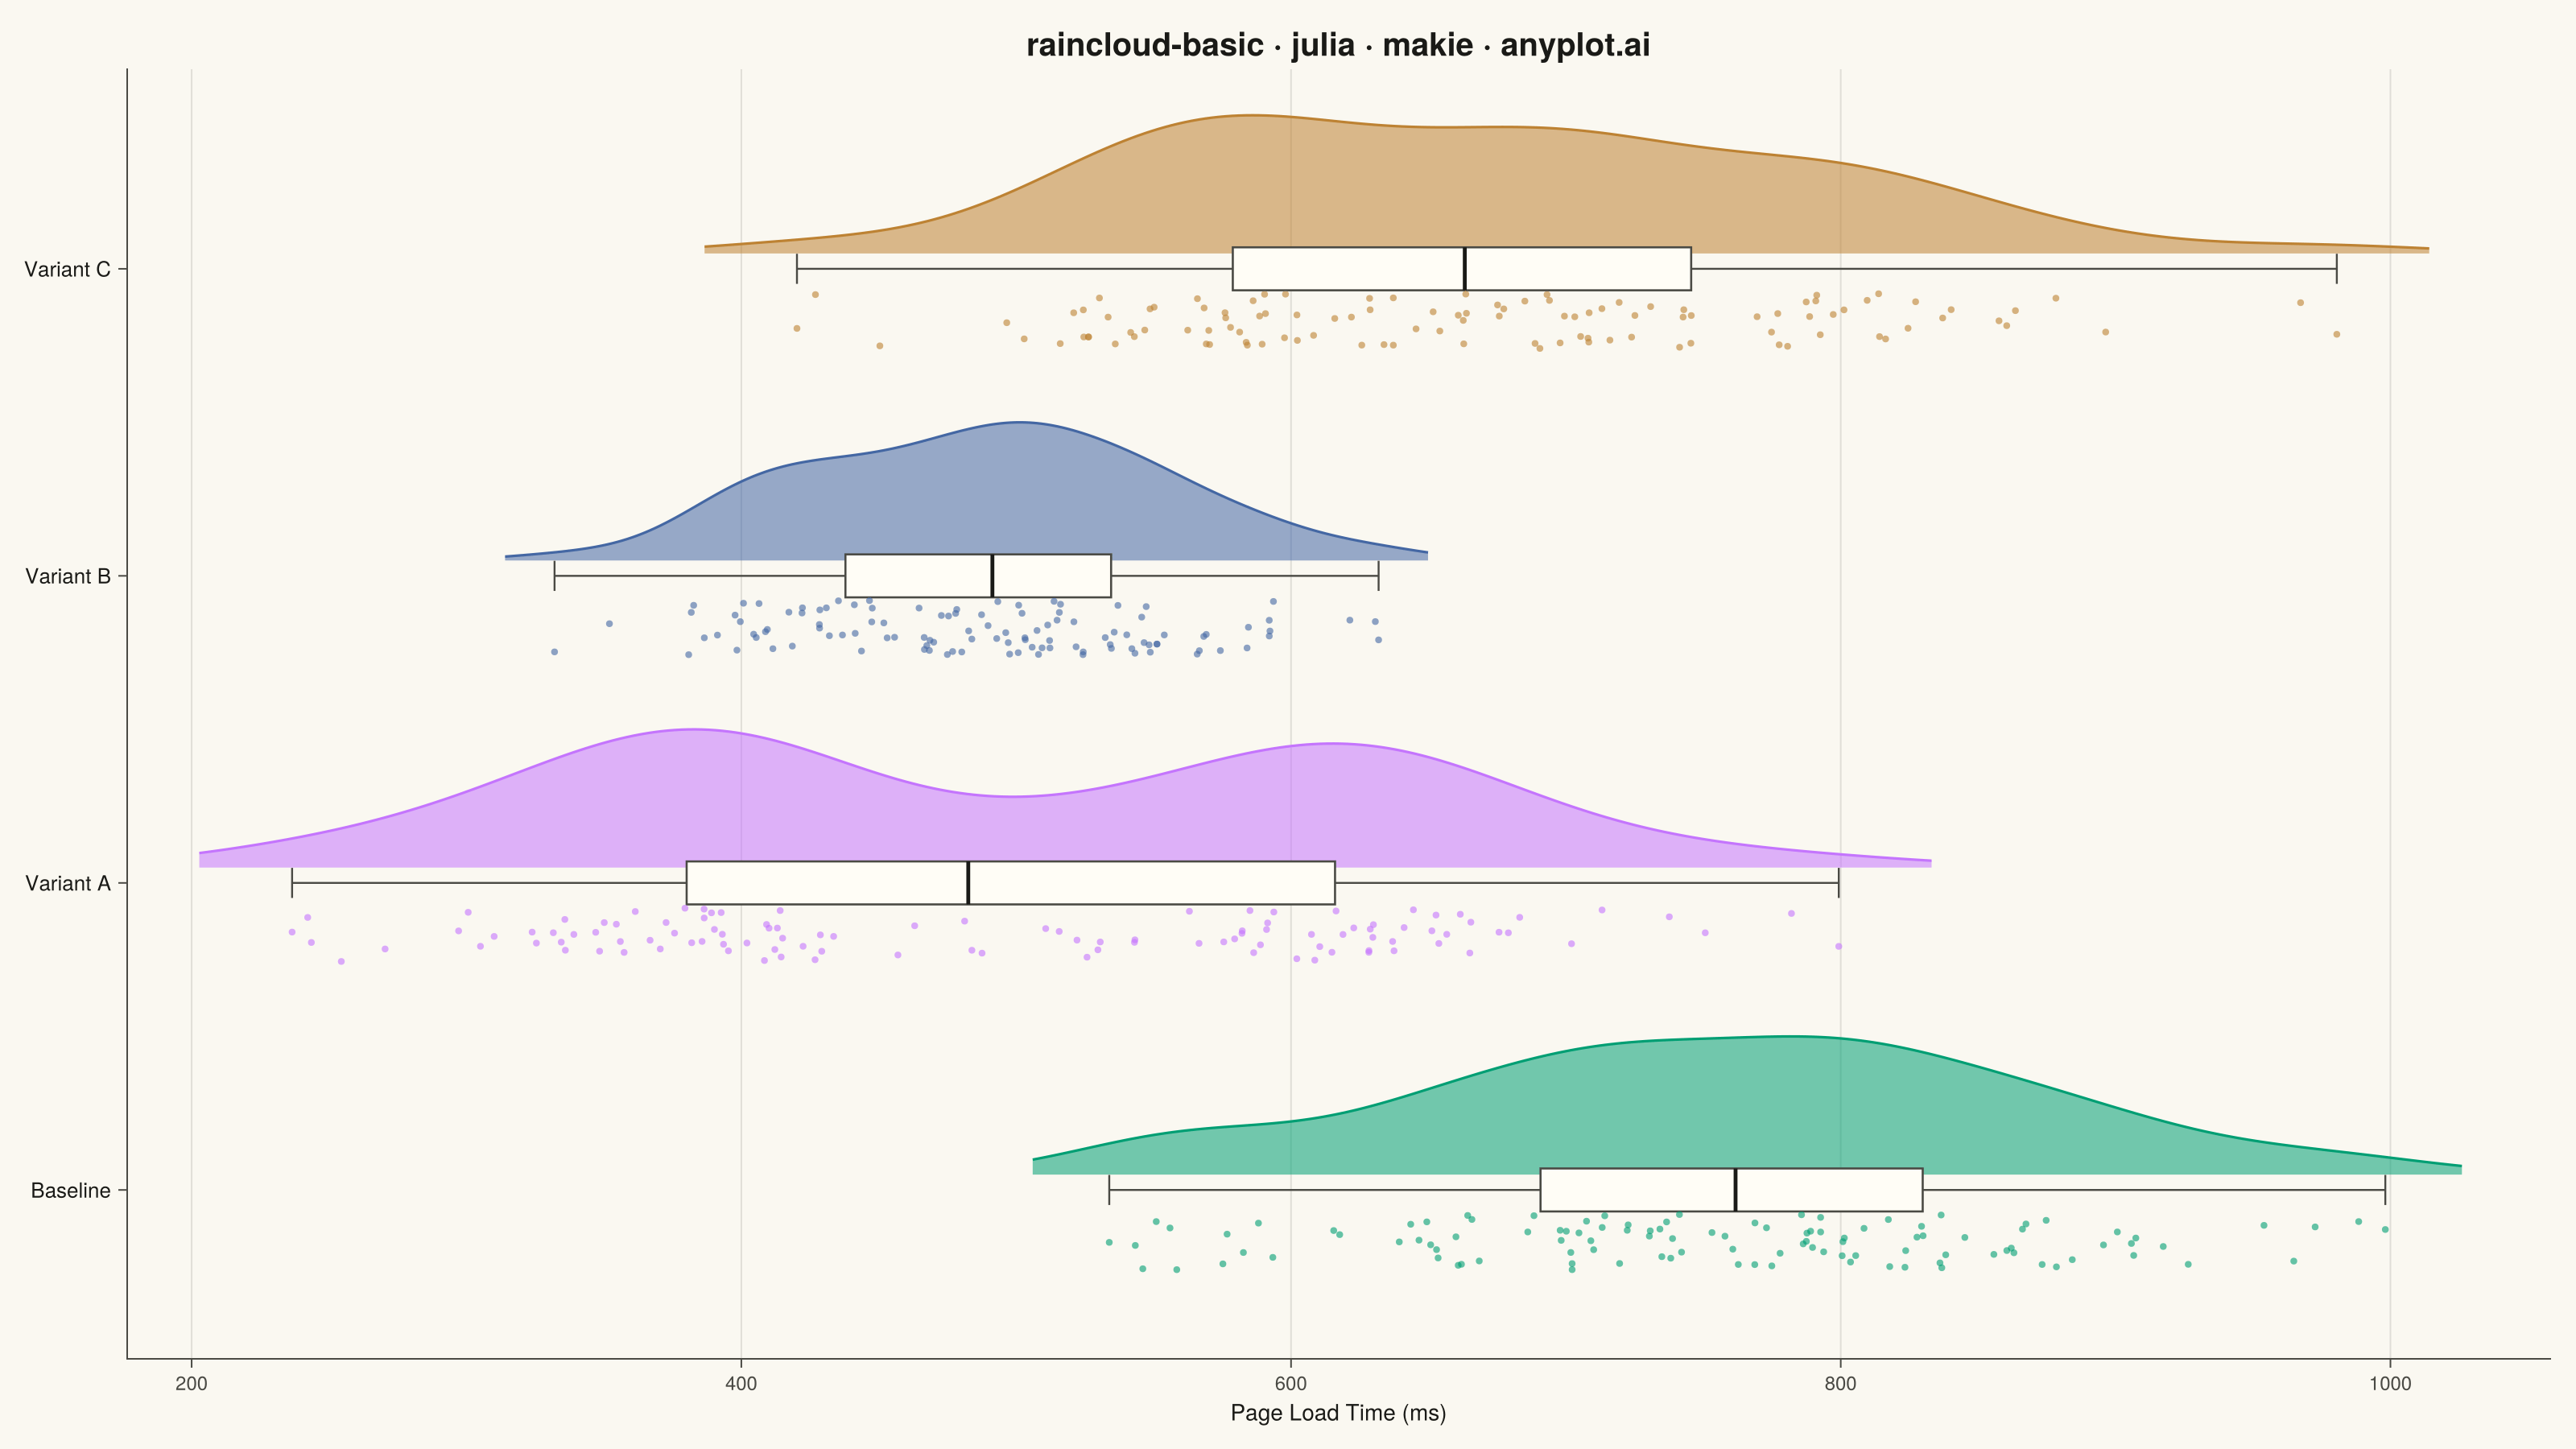
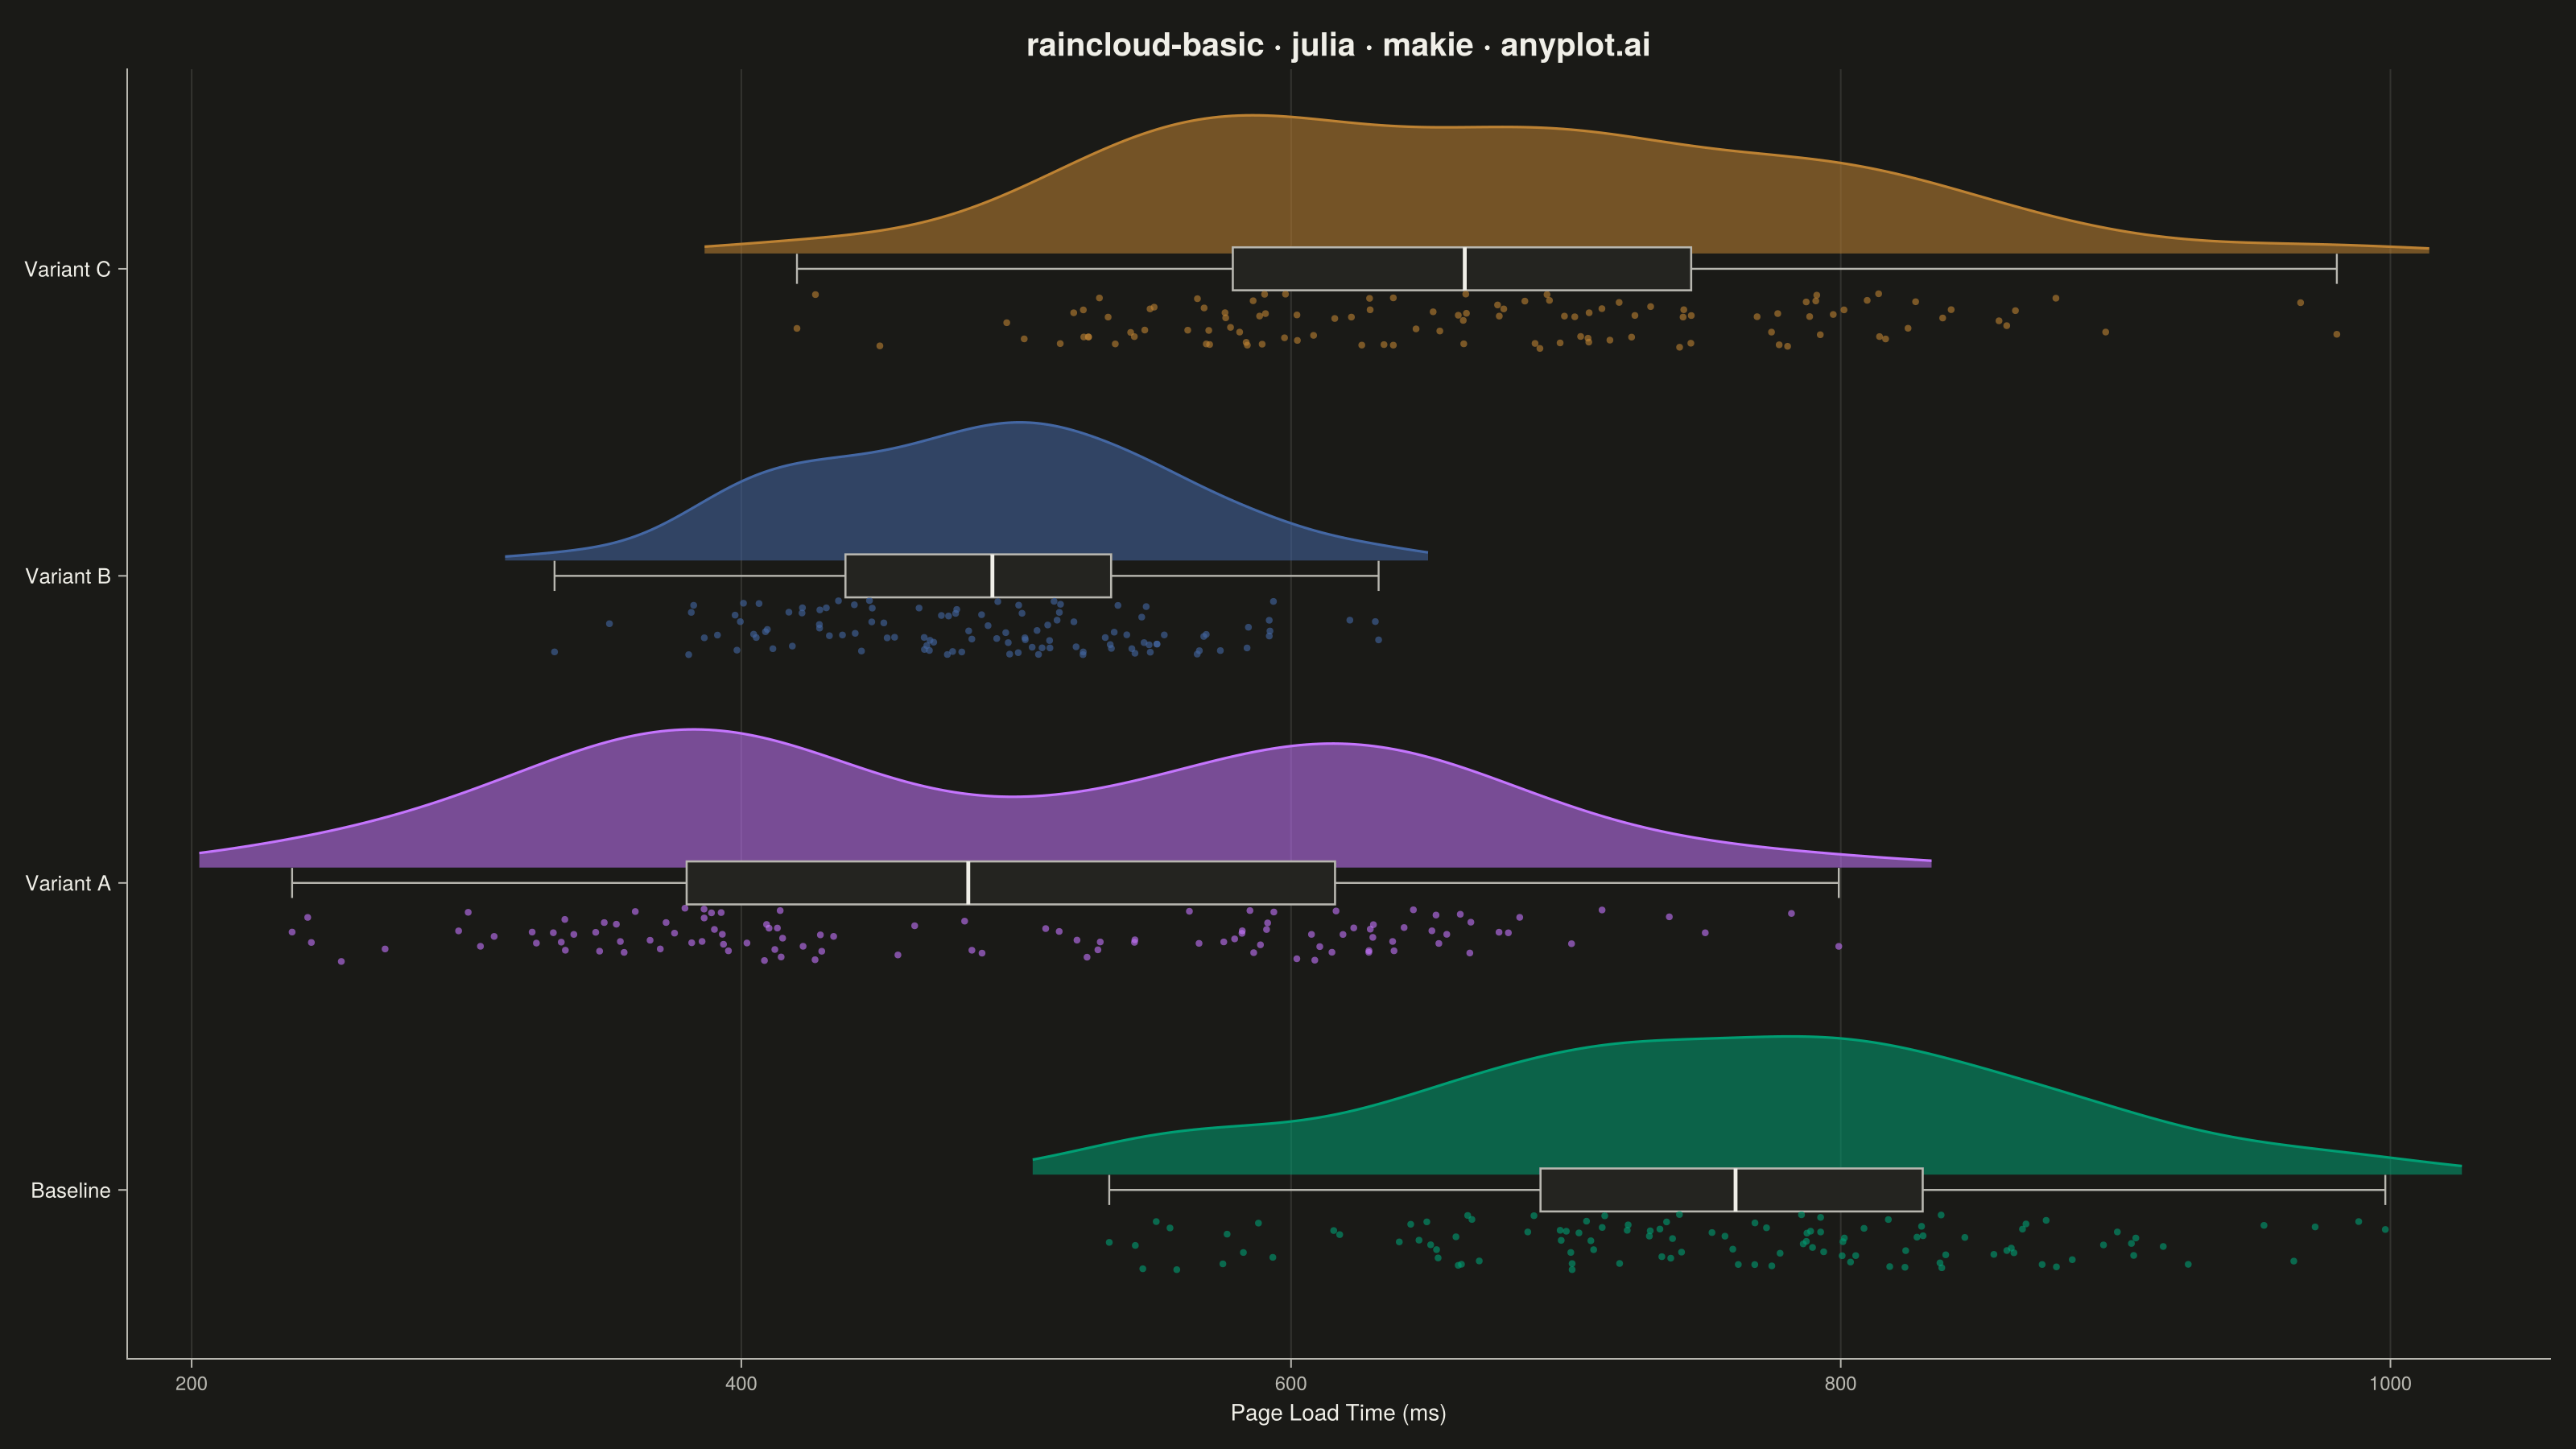
A raincloud plot combines three visualization elements—a half-violin (the "cloud"), jittered strip points (the "rain"), and a box plot—to provide a comprehensive view of data distribution. This hybrid approach shows distribution shape, summary statistics, and individual observations simultaneously, addressing the limitation of box plots that can hide multimodal distributions. Often called the "gold standard" for transparent statistical visualization in scientific publications.
# anyplot.ai
# raincloud-basic: Basic Raincloud Plot
# Library: makie 0.22.10 | Julia 1.11.9
# Quality: 91/100 | Created: 2026-05-27

using CairoMakie
using Colors
using Random
using Statistics

Random.seed!(42)

# --- Theme tokens -----------------------------------------------------------
const THEME       = get(ENV, "ANYPLOT_THEME", "light")
const PAGE_BG     = THEME == "light" ? colorant"#FAF8F1" : colorant"#1A1A17"
const ELEVATED_BG = THEME == "light" ? colorant"#FFFDF6" : colorant"#242420"
const INK         = THEME == "light" ? colorant"#1A1A17" : colorant"#F0EFE8"
const INK_SOFT    = THEME == "light" ? colorant"#4A4A44" : colorant"#B8B7B0"

const IMPRINT_PALETTE = [
    colorant"#009E73",  # 1 — brand green (Baseline)
    colorant"#C475FD",  # 2 — lavender    (Variant A)
    colorant"#4467A3",  # 3 — blue        (Variant B)
    colorant"#BD8233",  # 4 — ochre       (Variant C)
]

# --- Data: Page load times (ms) across 4 A/B test variants ------------------
const N_PER_CAT  = 110
const N_HALF     = N_PER_CAT ÷ 2

# Distributions differ in mean, spread, and shape:
#   Baseline:  slow control, right-skewed tail
#   Variant A: bimodal — cache hit vs cache miss
#   Variant B: fastest, tighter spread
#   Variant C: moderate mean with a heavier right tail
const RAW_CATEGORIES = ["Baseline", "Variant A", "Variant B", "Variant C"]
const RAW_DATA = [
    720.0 .+ 110.0 .* randn(N_PER_CAT) .+ 60.0 .* abs.(randn(N_PER_CAT)),
    vcat(380.0 .+  60.0 .* randn(N_HALF),
         620.0 .+  70.0 .* randn(N_PER_CAT - N_HALF)),
    460.0 .+  75.0 .* randn(N_PER_CAT) .+ 25.0 .* abs.(randn(N_PER_CAT)),
    590.0 .+  95.0 .* randn(N_PER_CAT) .+ 90.0 .* abs.(randn(N_PER_CAT)),
]

# Sort categories by median ascending — fastest at bottom, slowest at top —
# so the eye reads the A/B-test winners from the baseline upward.
const _ORDER     = sortperm(median.(RAW_DATA))
const CATEGORIES = RAW_CATEGORIES[_ORDER]
const DATA_BY_CAT = RAW_DATA[_ORDER]
const PALETTE_BY_CAT = [IMPRINT_PALETTE[findfirst(==(c), RAW_CATEGORIES)] for c in CATEGORIES]

# --- Figure -----------------------------------------------------------------
fig = Figure(
    size            = (1600, 900),
    fontsize        = 14,
    backgroundcolor = PAGE_BG,
)

ax = Axis(
    fig[1, 1];
    title             = "raincloud-basic · julia · makie · anyplot.ai",
    titlesize         = 20,
    titlecolor        = INK,
    xlabel            = "Page Load Time (ms)",
    ylabel            = "",
    xlabelcolor       = INK,
    xlabelsize        = 14,
    xticklabelsize    = 12,
    yticklabelsize    = 12,
    xticklabelcolor   = INK_SOFT,
    yticklabelcolor   = INK,
    xtickcolor        = INK_SOFT,
    ytickcolor        = INK_SOFT,
    backgroundcolor   = PAGE_BG,
    topspinevisible   = false,
    rightspinevisible = false,
    leftspinevisible  = false,
    bottomspinecolor  = INK_SOFT,
    yticks            = (1:length(CATEGORIES), CATEGORIES),
    xgridvisible      = true,
    ygridvisible      = false,
    xgridcolor        = RGBAf(red(INK), green(INK), blue(INK), 0.12),
    yminorgridvisible = false,
    xminorgridvisible = false,
)

# --- Raincloud layout knobs (y-units, category spacing = 1) -----------------
cloud_gap    = 0.05   # gap between baseline and start of cloud
cloud_height = 0.45   # max height of cloud above baseline
box_height   = 0.12   # full vertical extent of the box (centered on baseline)
rain_gap     = 0.14   # gap between baseline and start of rain
rain_spread  = 0.18   # vertical spread of jittered rain points

# --- Plot cloud + box + rain for each category ------------------------------
for (i, vals) in enumerate(DATA_BY_CAT)
    baseline = Float64(i)
    color    = PALETTE_BY_CAT[i]
    n        = length(vals)

    # Summary statistics — drive both boxplot and KDE bandwidth
    q1, med, q3 = quantile(vals, [0.25, 0.5, 0.75])
    iqr_v       = q3 - q1
    sd_v        = std(vals)

    # Inline Gaussian KDE on a 256-point grid (Silverman + IQR fallback)
    vmin, vmax = extrema(vals)
    pad        = 0.06 * (vmax - vmin)
    grid       = collect(range(vmin - pad, vmax + pad; length = 256))
    bw         = 0.9 * min(sd_v, iqr_v / 1.34) * n^(-1/5)
    sqdiffs    = (grid' .- vals) .^ 2 ./ (2 * bw^2)
    dens       = vec(sum(exp.(-sqdiffs); dims = 1)) ./ (n * bw * sqrt(2π))
    dens_h     = dens ./ maximum(dens) .* cloud_height

    # Cloud — half-violin rising ABOVE the baseline
    base_y = fill(baseline + cloud_gap, length(grid))
    top_y  = baseline .+ cloud_gap .+ dens_h
    band!(ax, grid, base_y, top_y; color = (color, 0.55))
    lines!(ax, grid, top_y; color = color, linewidth = 1.6)

    # Boxplot — sits ON the baseline (whiskers, box, median)
    lo_w = max(minimum(vals), q1 - 1.5 * iqr_v)
    hi_w = min(maximum(vals), q3 + 1.5 * iqr_v)
    lines!(ax, [lo_w, hi_w], [baseline, baseline];
        color = INK_SOFT, linewidth = 1.2)
    cap_h = box_height * 0.35
    lines!(ax, [lo_w, lo_w], [baseline - cap_h, baseline + cap_h];
        color = INK_SOFT, linewidth = 1.2)
    lines!(ax, [hi_w, hi_w], [baseline - cap_h, baseline + cap_h];
        color = INK_SOFT, linewidth = 1.2)
    poly!(ax, Rect2f(q1, baseline - box_height/2, q3 - q1, box_height);
        color = ELEVATED_BG, strokecolor = INK_SOFT, strokewidth = 1.3)
    lines!(ax, [med, med], [baseline - box_height/2, baseline + box_height/2];
        color = INK, linewidth = 2.4)

    # Rain — jittered points falling BELOW the baseline
    y_rain = baseline .- rain_gap .- rand(n) .* rain_spread
    scatter!(ax, vals, y_rain;
        color       = (color, 0.6),
        markersize  = 6,
        strokewidth = 0)
end

# --- Axis limits ------------------------------------------------------------
all_vals = vcat(DATA_BY_CAT...)
xlims!(ax, minimum(all_vals) - 60, maximum(all_vals) + 60)
ylims!(ax, 0.45, length(CATEGORIES) + 0.65)

# --- Save -------------------------------------------------------------------
save("plot-$(THEME).png", fig; px_per_unit = 2)
Runnable source as JSON, for any HTTP client: https://api.anyplot.ai/specs/raincloud-basic/makie/code. Any spec id and library id listed in llms-full.txt fit the same URL shape; every URL below is complete and callable.
{
  "spec_id": "raincloud-basic",
  "language": "julia",
  "library": "makie",
  "page": "https://anyplot.ai/raincloud-basic/julia/makie",
  "hub": "https://anyplot.ai/raincloud-basic",
  "code_json": "https://api.anyplot.ai/specs/raincloud-basic/makie/code",
  "spec_json": "https://api.anyplot.ai/specs/raincloud-basic",
  "render_light_png": "https://storage.googleapis.com/anyplot-images/plots/raincloud-basic/julia/makie/plot-light.png",
  "render_dark_png": "https://storage.googleapis.com/anyplot-images/plots/raincloud-basic/julia/makie/plot-dark.png",
  "quality_score": 91.0,
  "license": "MIT",
  "guide": "https://anyplot.ai/llms.txt"
}
Part of Basic Raincloud Plot on anyplot.ai.