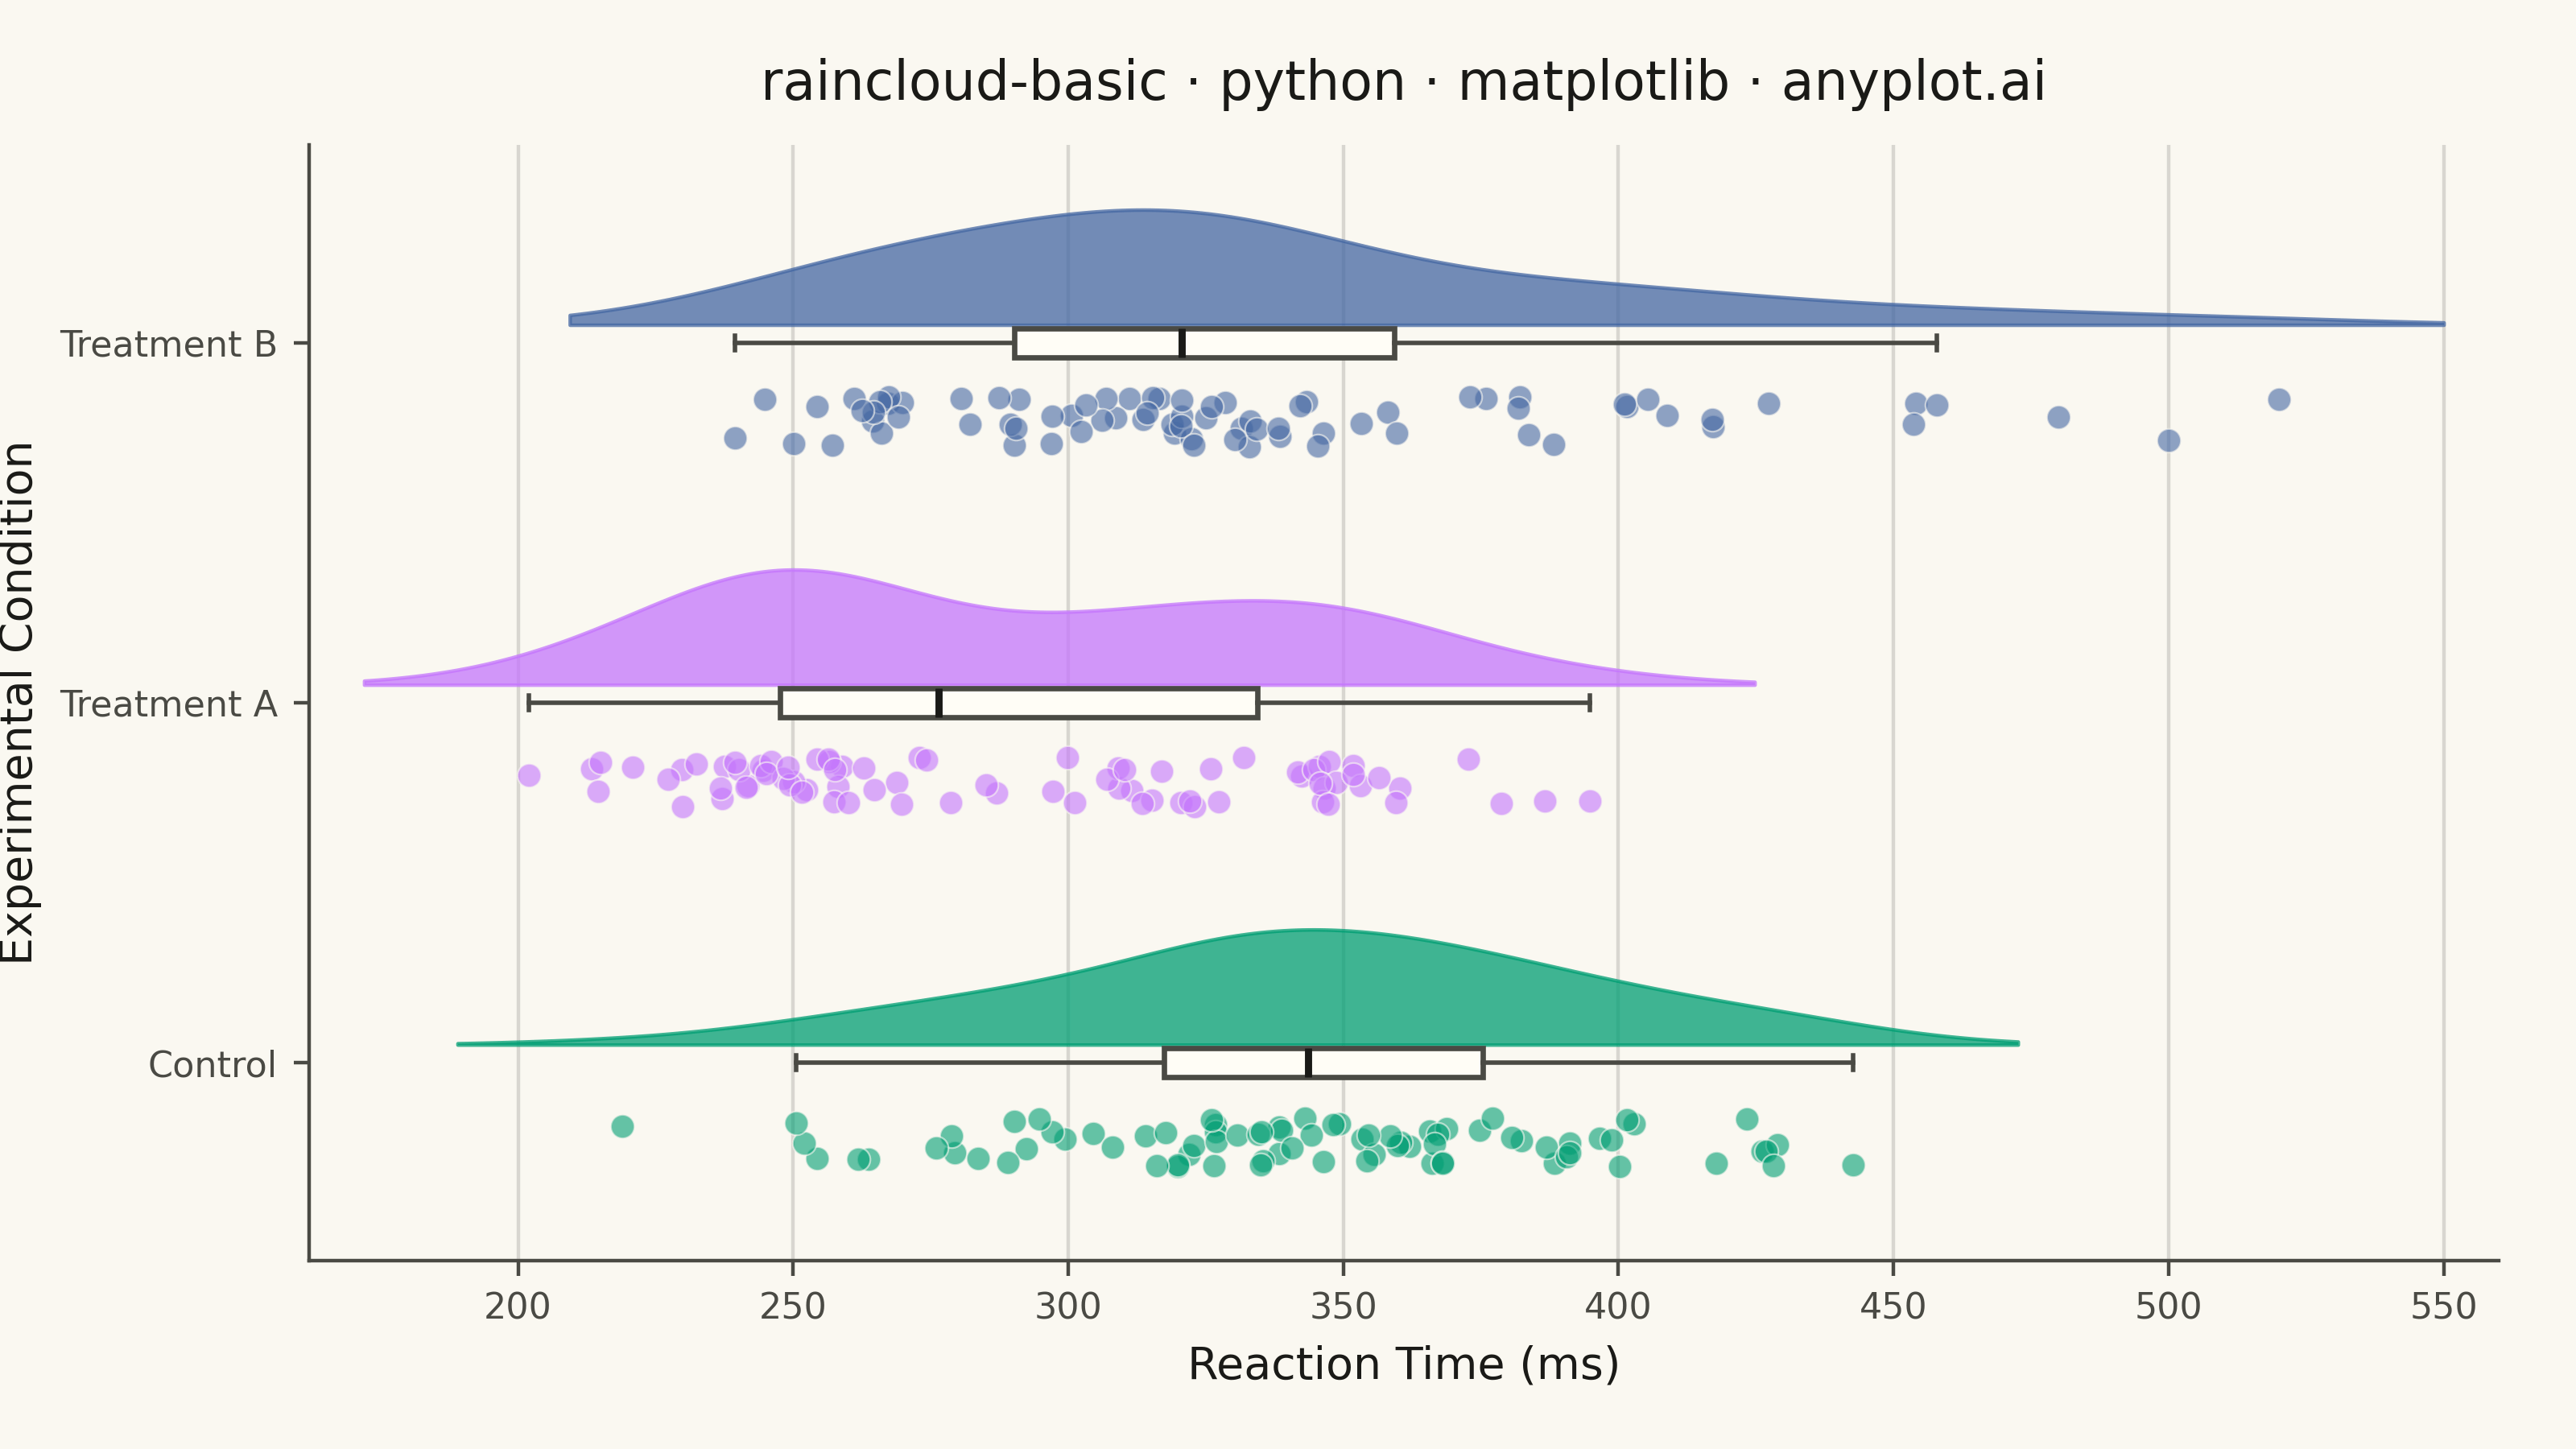
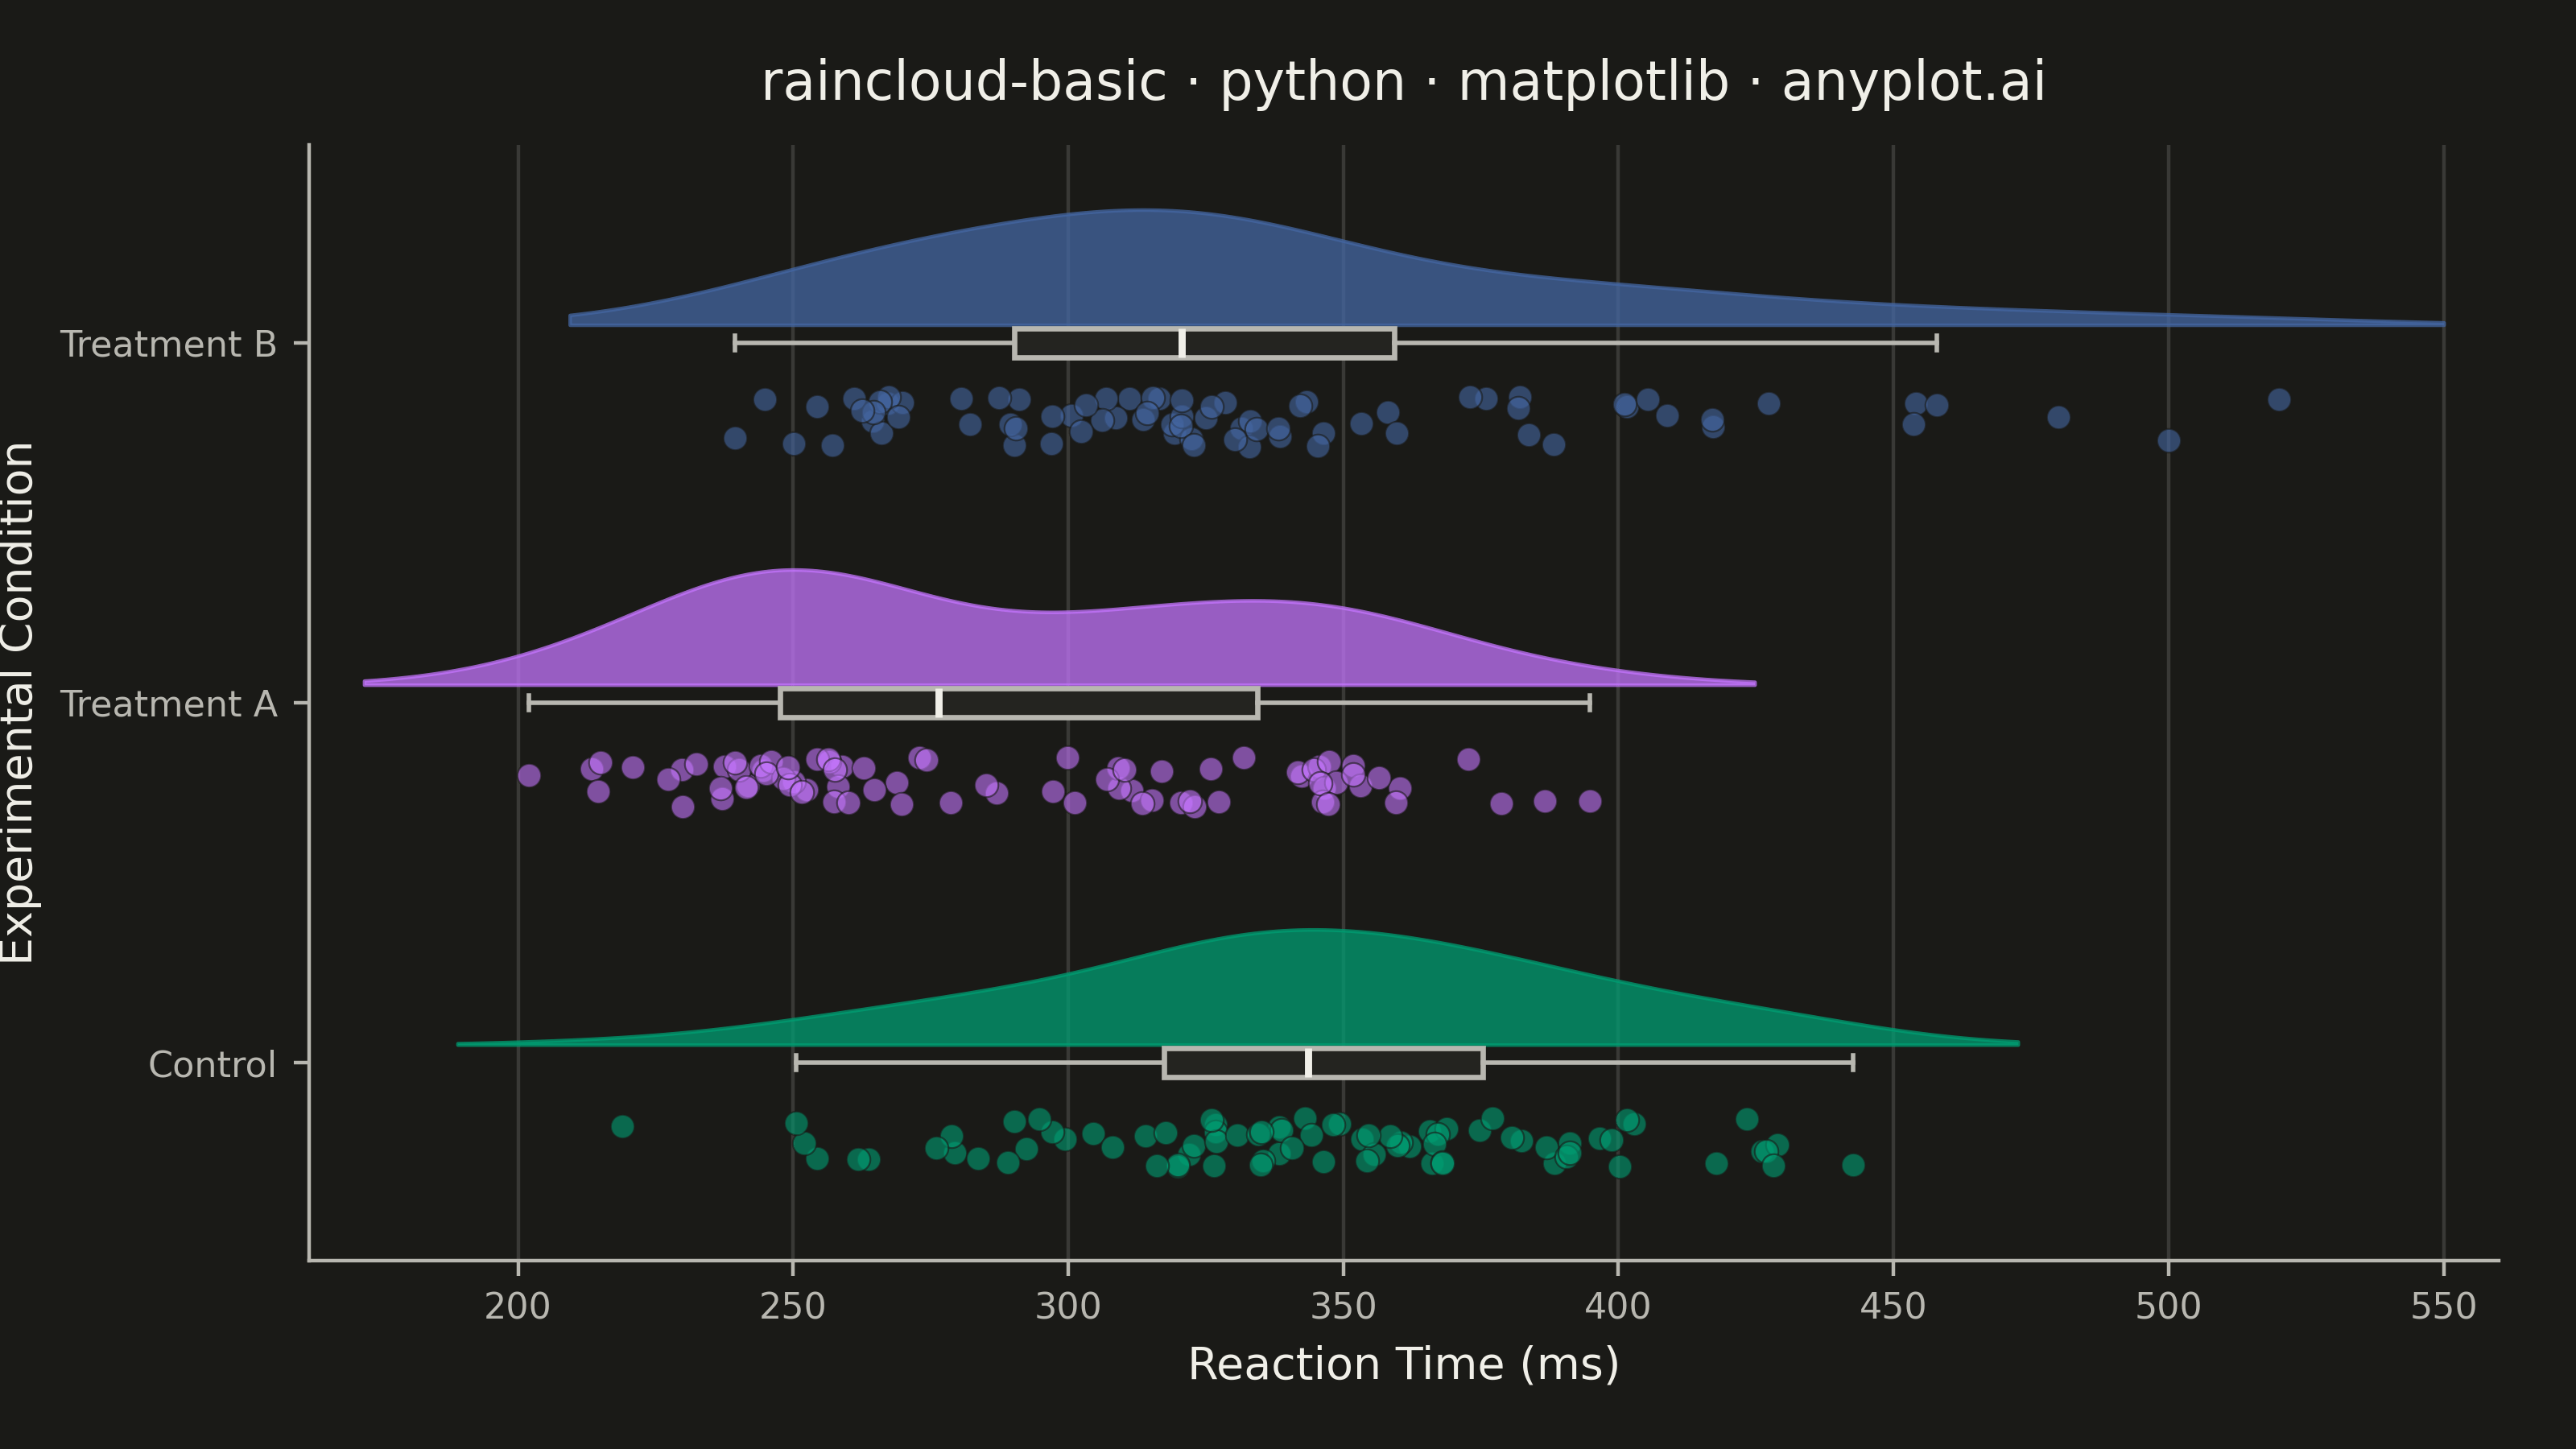
A raincloud plot combines three visualization elements—a half-violin (the "cloud"), jittered strip points (the "rain"), and a box plot—to provide a comprehensive view of data distribution. This hybrid approach shows distribution shape, summary statistics, and individual observations simultaneously, addressing the limitation of box plots that can hide multimodal distributions. Often called the "gold standard" for transparent statistical visualization in scientific publications.
""" anyplot.ai
raincloud-basic: Basic Raincloud Plot
Library: matplotlib 3.10.9 | Python 3.13.13
Quality: 93/100 | Updated: 2026-05-26
"""

import os

import matplotlib.pyplot as plt
import numpy as np
from scipy.stats import gaussian_kde


THEME = os.getenv("ANYPLOT_THEME", "light")
PAGE_BG = "#FAF8F1" if THEME == "light" else "#1A1A17"
ELEVATED_BG = "#FFFDF6" if THEME == "light" else "#242420"
INK = "#1A1A17" if THEME == "light" else "#F0EFE8"
INK_SOFT = "#4A4A44" if THEME == "light" else "#B8B7B0"

# Imprint palette positions 1-3
COLORS = ["#009E73", "#C475FD", "#4467A3"]

# Data: Reaction times (ms) for three experimental conditions
np.random.seed(42)

# Control: roughly normal around 350 ms
control = np.random.normal(350, 50, 80)

# Treatment A: clearly bimodal — two response strategies
treatment_a = np.concatenate([np.random.normal(250, 25, 45), np.random.normal(340, 25, 35)])

# Treatment B: mostly central with a slow tail and a few outliers
treatment_b = np.concatenate([np.random.normal(300, 40, 60), np.random.normal(400, 25, 15), np.array([500, 520, 480])])

categories = ["Control", "Treatment A", "Treatment B"]
data = [control, treatment_a, treatment_b]

fig, ax = plt.subplots(figsize=(8, 4.5), dpi=400, facecolor=PAGE_BG)
ax.set_facecolor(PAGE_BG)

# Raincloud layout: cloud above baseline, boxplot on baseline, rain below
cloud_offset = 0.05
cloud_height = 0.32
rain_offset = -0.22
box_width = 0.08

for i, (d, color) in enumerate(zip(data, COLORS, strict=True)):
    pos = i + 1

    # Cloud — half-violin via scipy KDE, Silverman's rule
    kde = gaussian_kde(d, bw_method="silverman")
    x_min, x_max = d.min() - 30, d.max() + 30
    x_vals = np.linspace(x_min, x_max, 256)
    density = kde(x_vals)
    density_scaled = density / density.max() * cloud_height

    ax.fill_between(
        x_vals,
        pos + cloud_offset,
        pos + cloud_offset + density_scaled,
        color=color,
        alpha=0.75,
        edgecolor=color,
        linewidth=0.8,
        zorder=1,
    )

    # Boxplot — sits on the category baseline
    bp = ax.boxplot([d], positions=[pos], widths=box_width, vert=False, patch_artist=True, showfliers=False, zorder=3)
    bp["boxes"][0].set_facecolor(ELEVATED_BG)
    bp["boxes"][0].set_edgecolor(INK_SOFT)
    bp["boxes"][0].set_linewidth(1.2)
    bp["medians"][0].set_color(INK)
    bp["medians"][0].set_linewidth(1.6)
    for whisker in bp["whiskers"]:
        whisker.set_color(INK_SOFT)
        whisker.set_linewidth(1.0)
    for cap in bp["caps"]:
        cap.set_color(INK_SOFT)
        cap.set_linewidth(1.0)

    # Rain — jittered points below the baseline
    jitter = np.random.uniform(-0.07, 0.07, len(d))
    ax.scatter(
        d,
        np.full(len(d), pos + rain_offset) + jitter,
        s=28,
        alpha=0.6,
        color=color,
        edgecolor=PAGE_BG,
        linewidth=0.4,
        zorder=2,
    )

# Axes & ticks
ax.set_yticks([1, 2, 3])
ax.set_yticklabels(categories, fontsize=10, color=INK_SOFT)
ax.set_xlabel("Reaction Time (ms)", fontsize=10, color=INK)
ax.set_ylabel("Experimental Condition", fontsize=10, color=INK)

title = "raincloud-basic · python · matplotlib · anyplot.ai"
ax.set_title(title, fontsize=12, fontweight="medium", color=INK, pad=10)

ax.tick_params(axis="both", labelsize=8, colors=INK_SOFT, labelcolor=INK_SOFT)

# Range with breathing room
all_data = np.concatenate(data)
ax.set_xlim(all_data.min() - 40, all_data.max() + 40)
ax.set_ylim(0.45, 3.55)

# Subtle x-axis grid only
ax.xaxis.grid(True, alpha=0.15, color=INK, linewidth=0.8)
ax.set_axisbelow(True)

# L-frame: keep left + bottom
ax.spines["top"].set_visible(False)
ax.spines["right"].set_visible(False)
ax.spines["left"].set_color(INK_SOFT)
ax.spines["bottom"].set_color(INK_SOFT)
ax.spines["left"].set_linewidth(0.8)
ax.spines["bottom"].set_linewidth(0.8)

fig.subplots_adjust(left=0.12, right=0.97, top=0.90, bottom=0.13)
plt.savefig(f"plot-{THEME}.png", dpi=400, facecolor=PAGE_BG)
Runnable source as JSON, for any HTTP client: https://api.anyplot.ai/specs/raincloud-basic/matplotlib/code. Any spec id and library id listed in llms-full.txt fit the same URL shape; every URL below is complete and callable.
{
  "spec_id": "raincloud-basic",
  "language": "python",
  "library": "matplotlib",
  "page": "https://anyplot.ai/raincloud-basic/python/matplotlib",
  "hub": "https://anyplot.ai/raincloud-basic",
  "code_json": "https://api.anyplot.ai/specs/raincloud-basic/matplotlib/code",
  "spec_json": "https://api.anyplot.ai/specs/raincloud-basic",
  "render_light_png": "https://storage.googleapis.com/anyplot-images/plots/raincloud-basic/python/matplotlib/plot-light.png",
  "render_dark_png": "https://storage.googleapis.com/anyplot-images/plots/raincloud-basic/python/matplotlib/plot-dark.png",
  "quality_score": 93.0,
  "license": "MIT",
  "guide": "https://anyplot.ai/llms.txt"
}
Part of Basic Raincloud Plot on anyplot.ai.