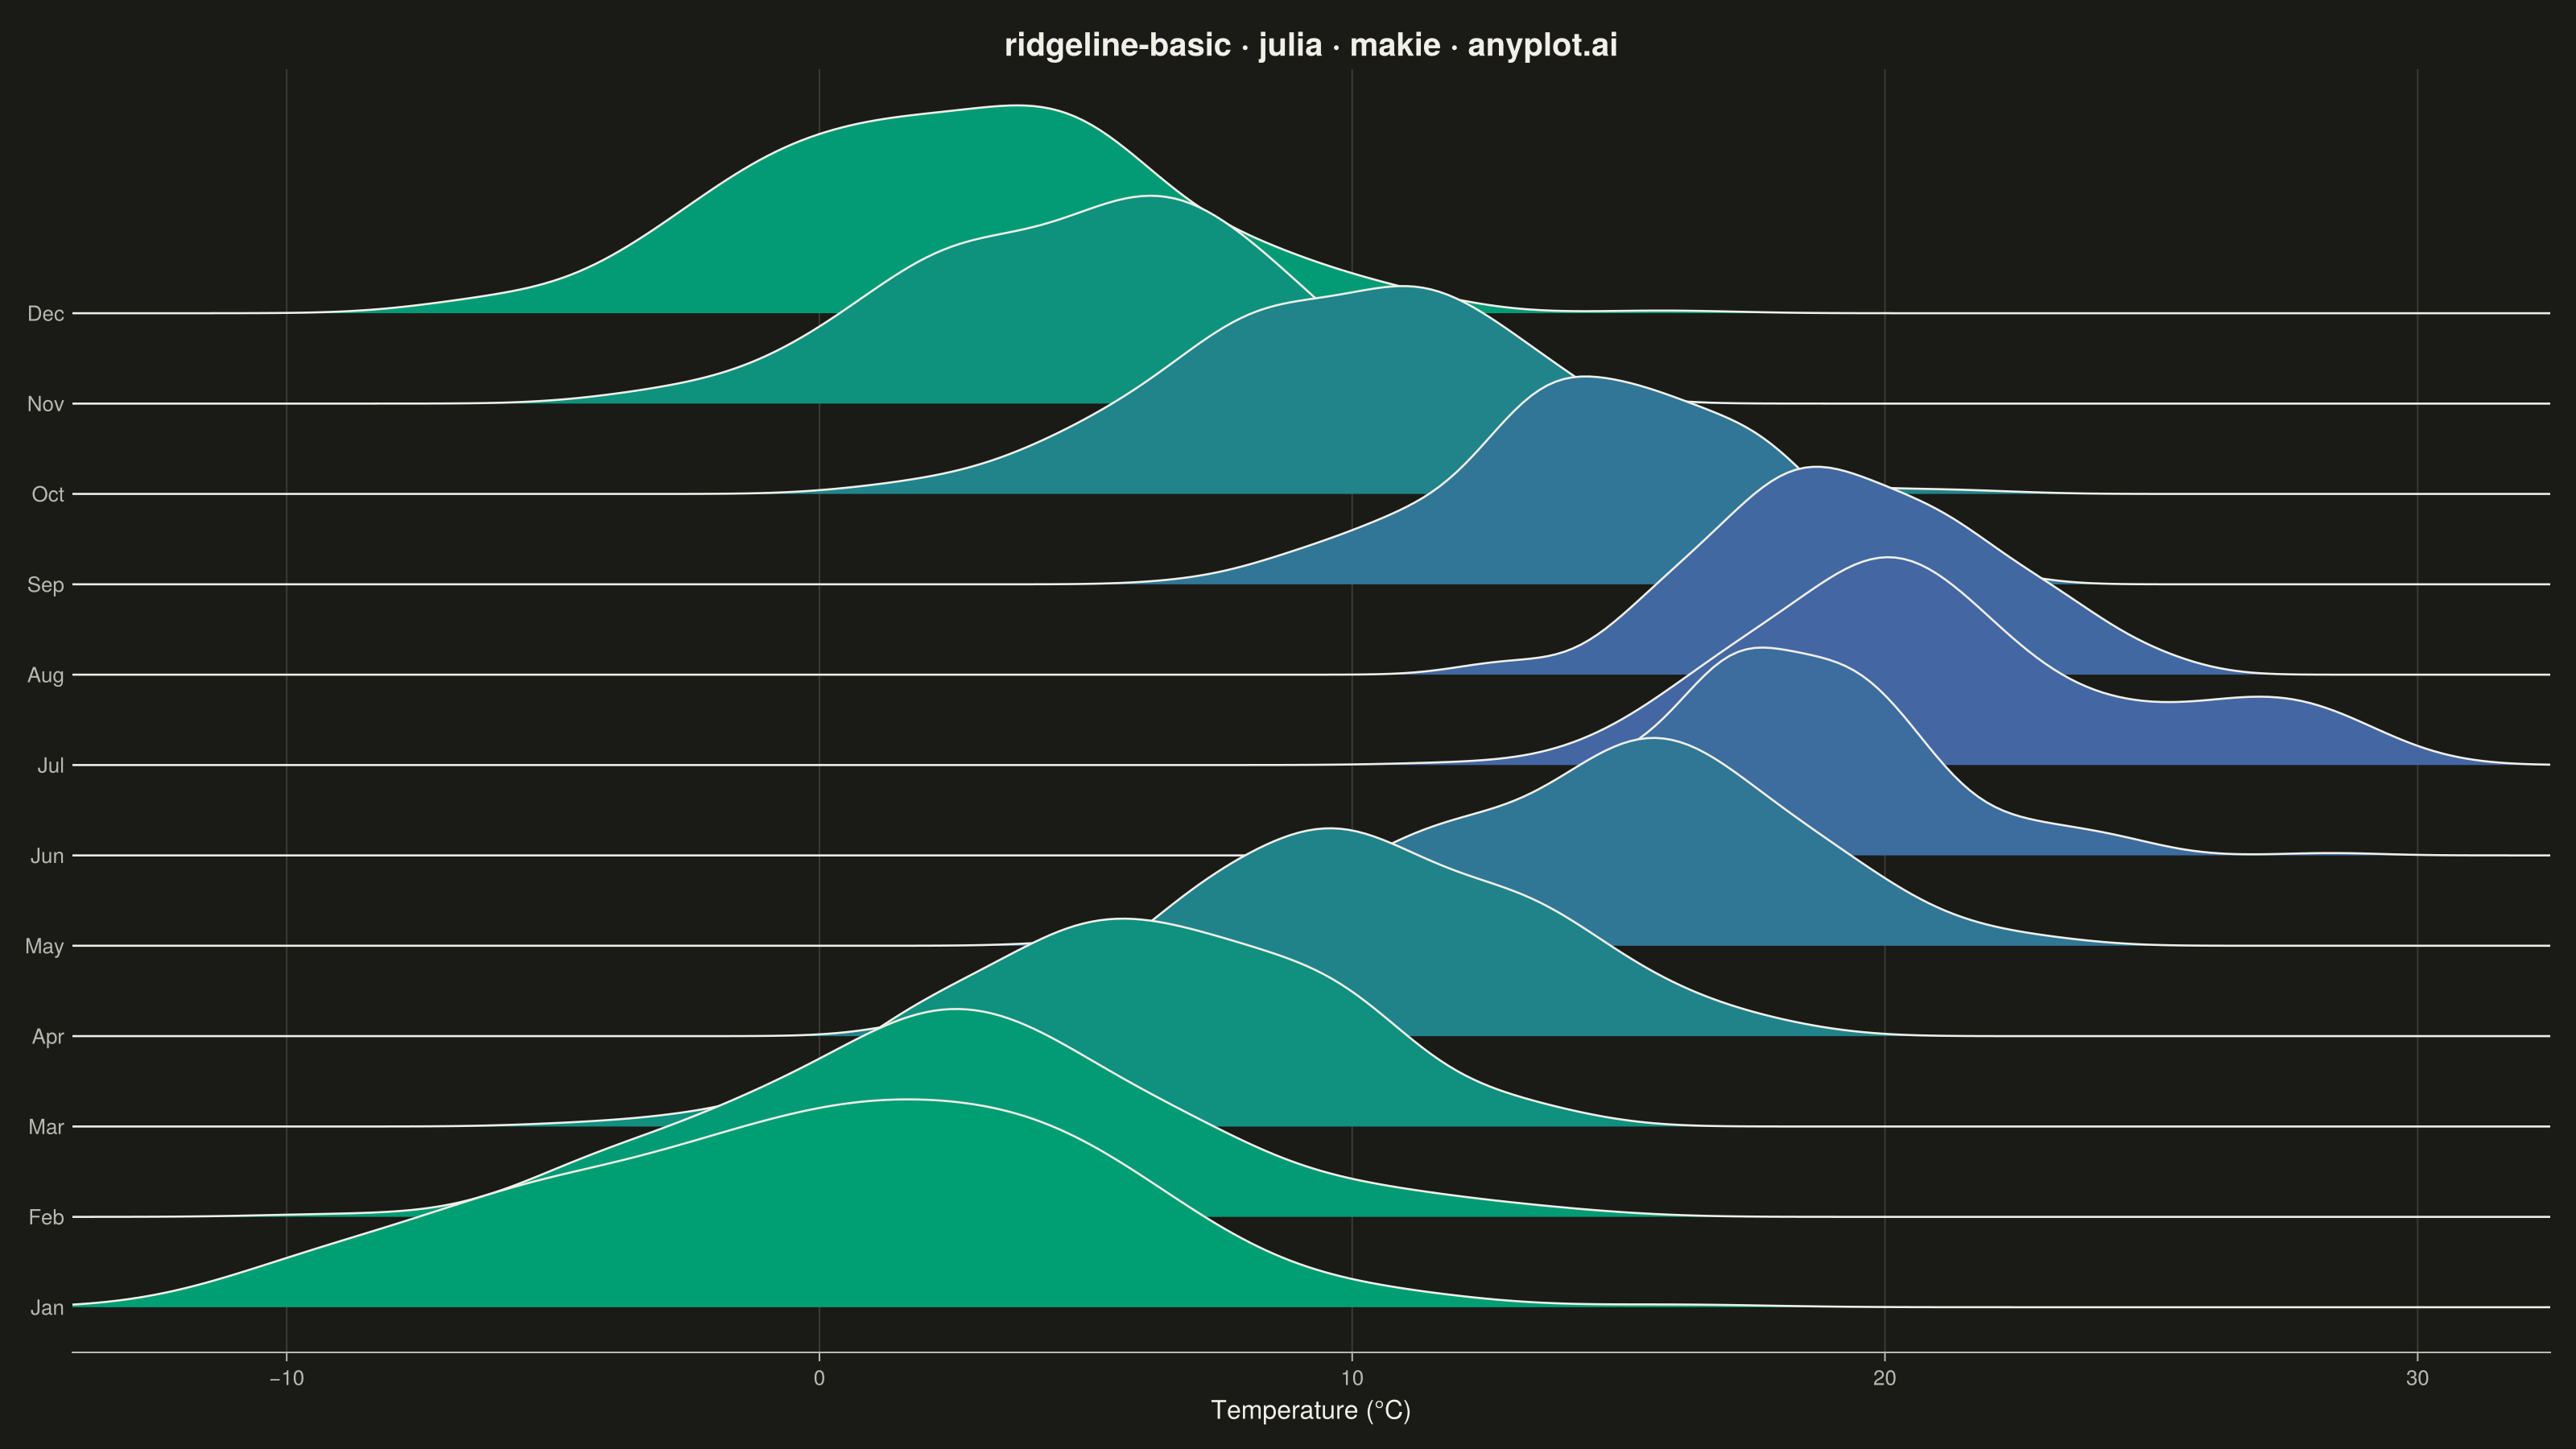
A ridgeline plot (also known as Joy Plot, named after the Joy Division album cover) displays the distribution of multiple groups by stacking partially overlapping density curves vertically. This creates a mountain ridge appearance that allows efficient comparison of many distributions simultaneously while maintaining a compact and visually striking presentation.
Preview render from the Makie.jl implementation.