The same plot in 14 other libraries — JavaScript: Chart.js, D3.js, Highcharts, MUI X Charts; Python: Altair, Bokeh, lets-plot, Matplotlib, Plotly, plotnine, Pygal, Seaborn; R: ggplot2; Julia: Makie.jl. Compare all 15 side by side: Basic Ridgeline Plot in Python, R, Julia and JavaScript.
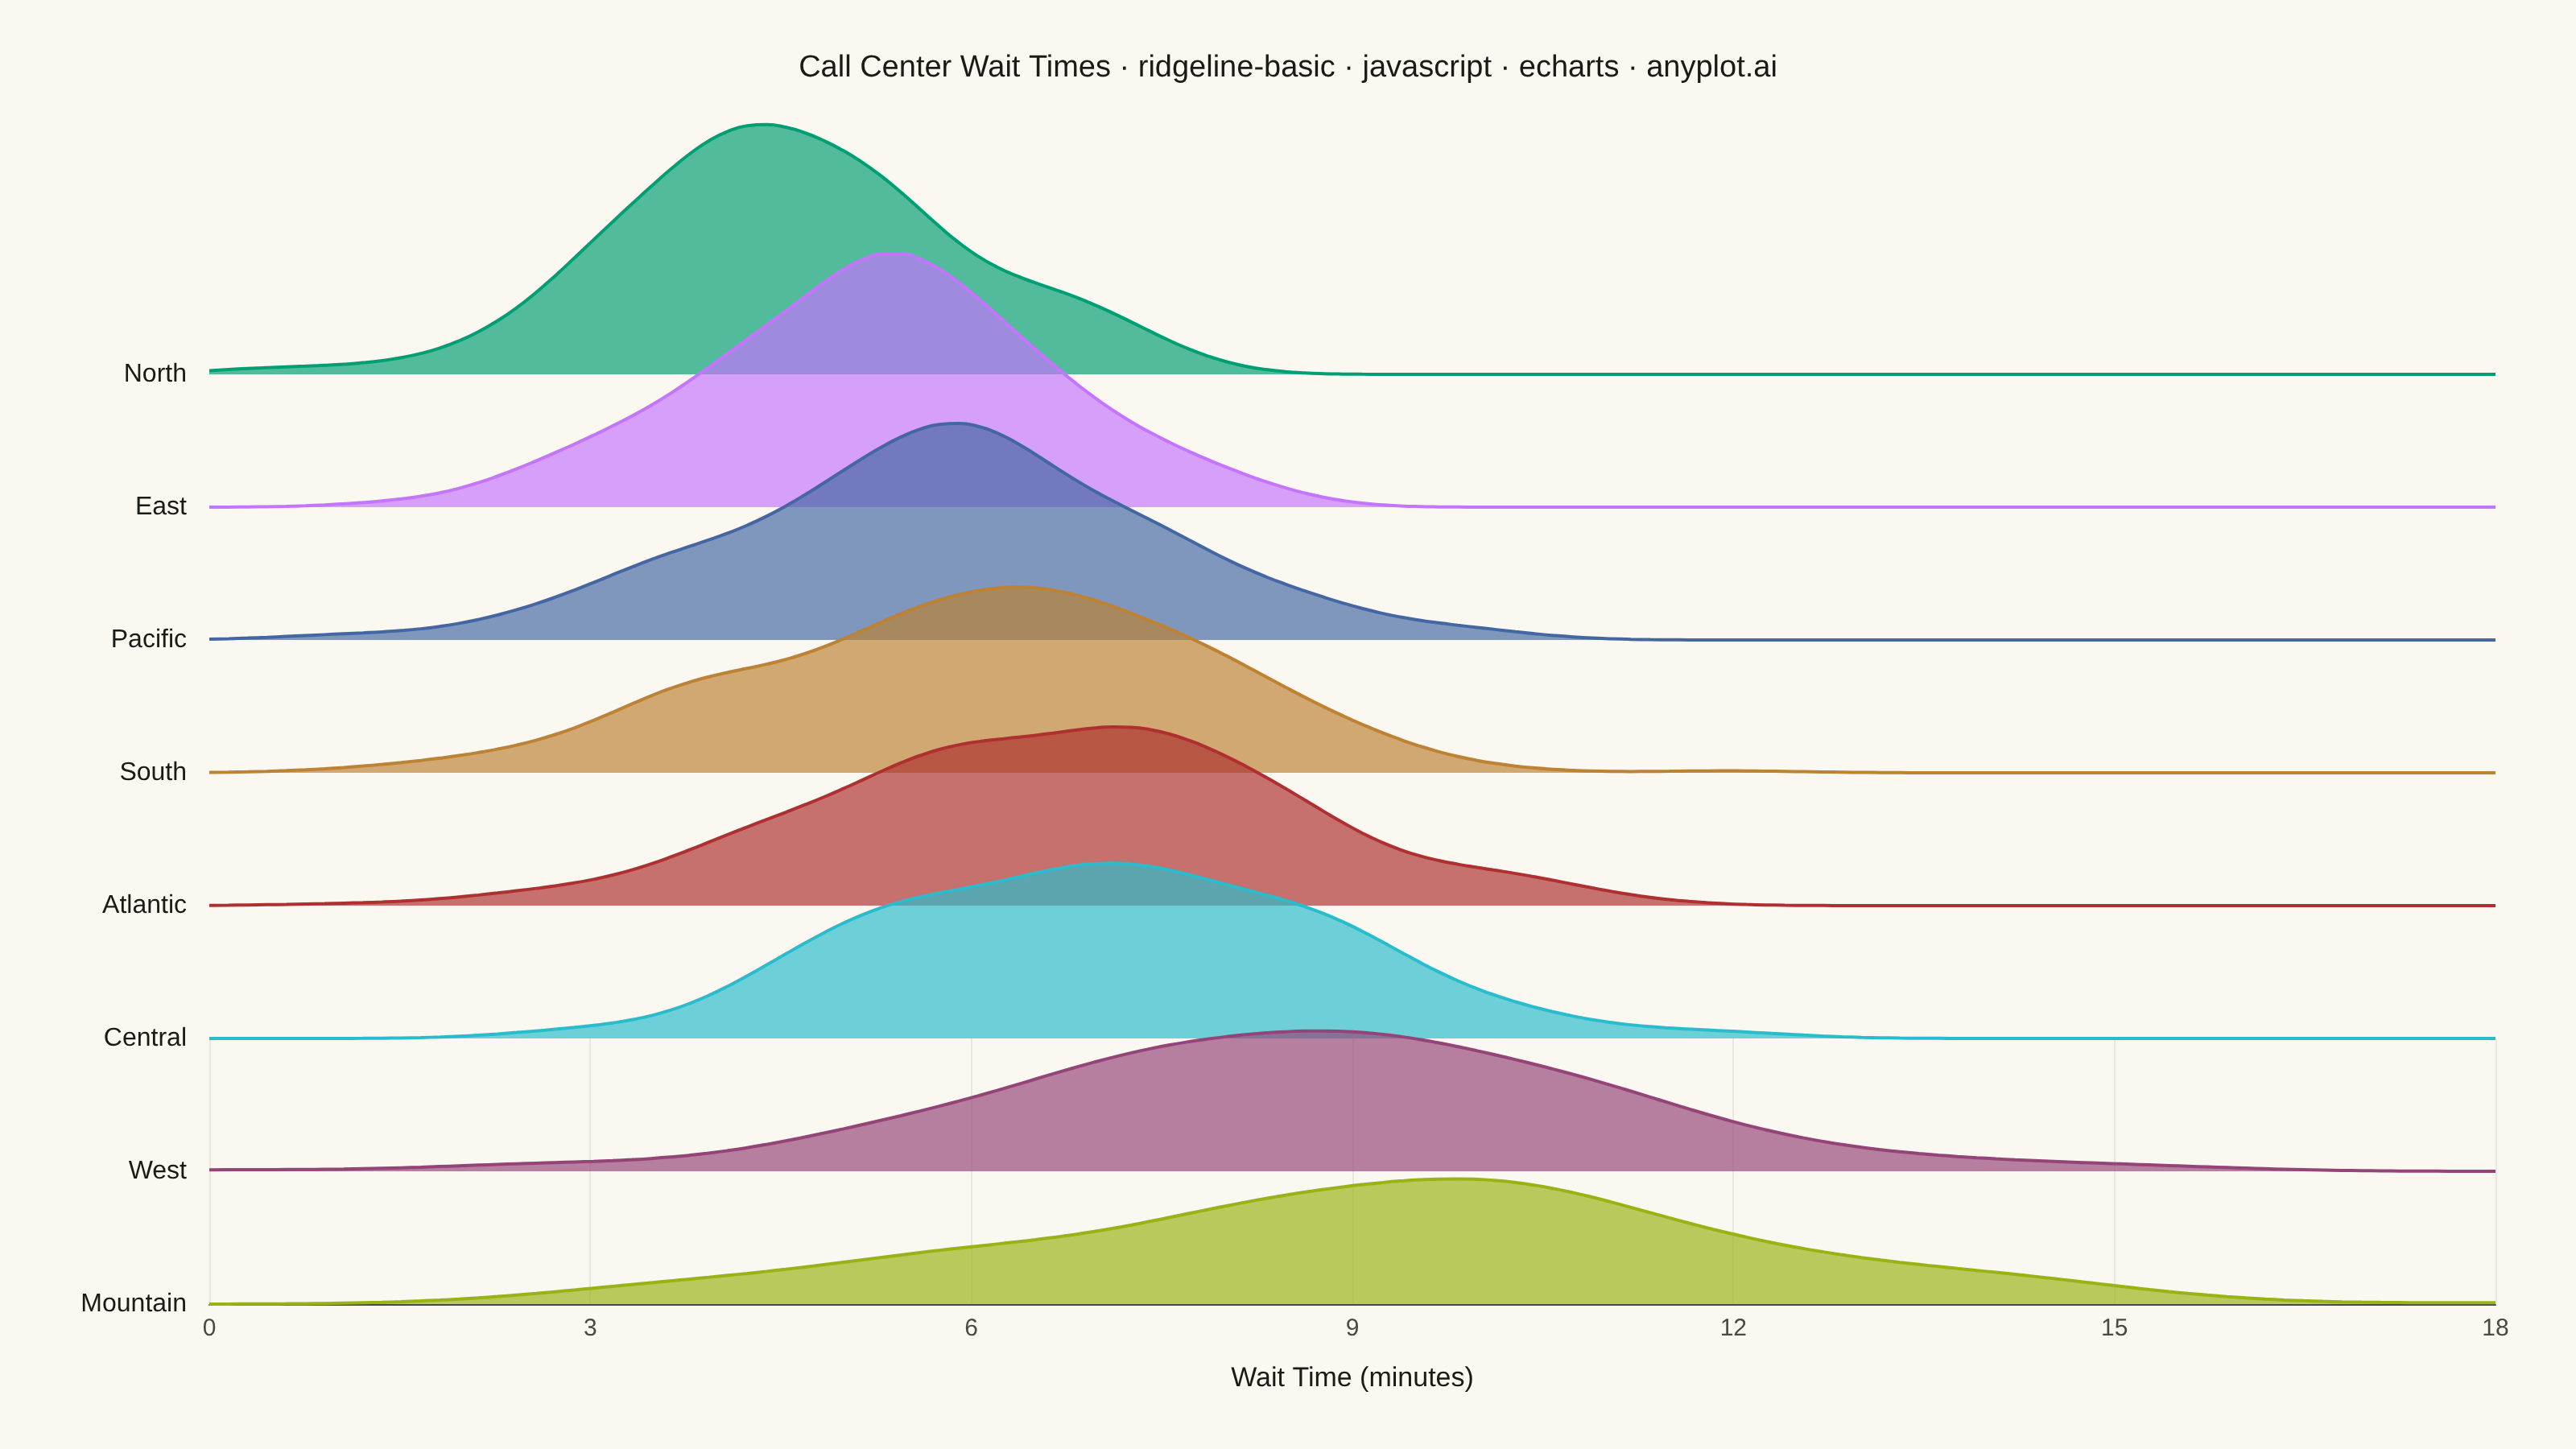
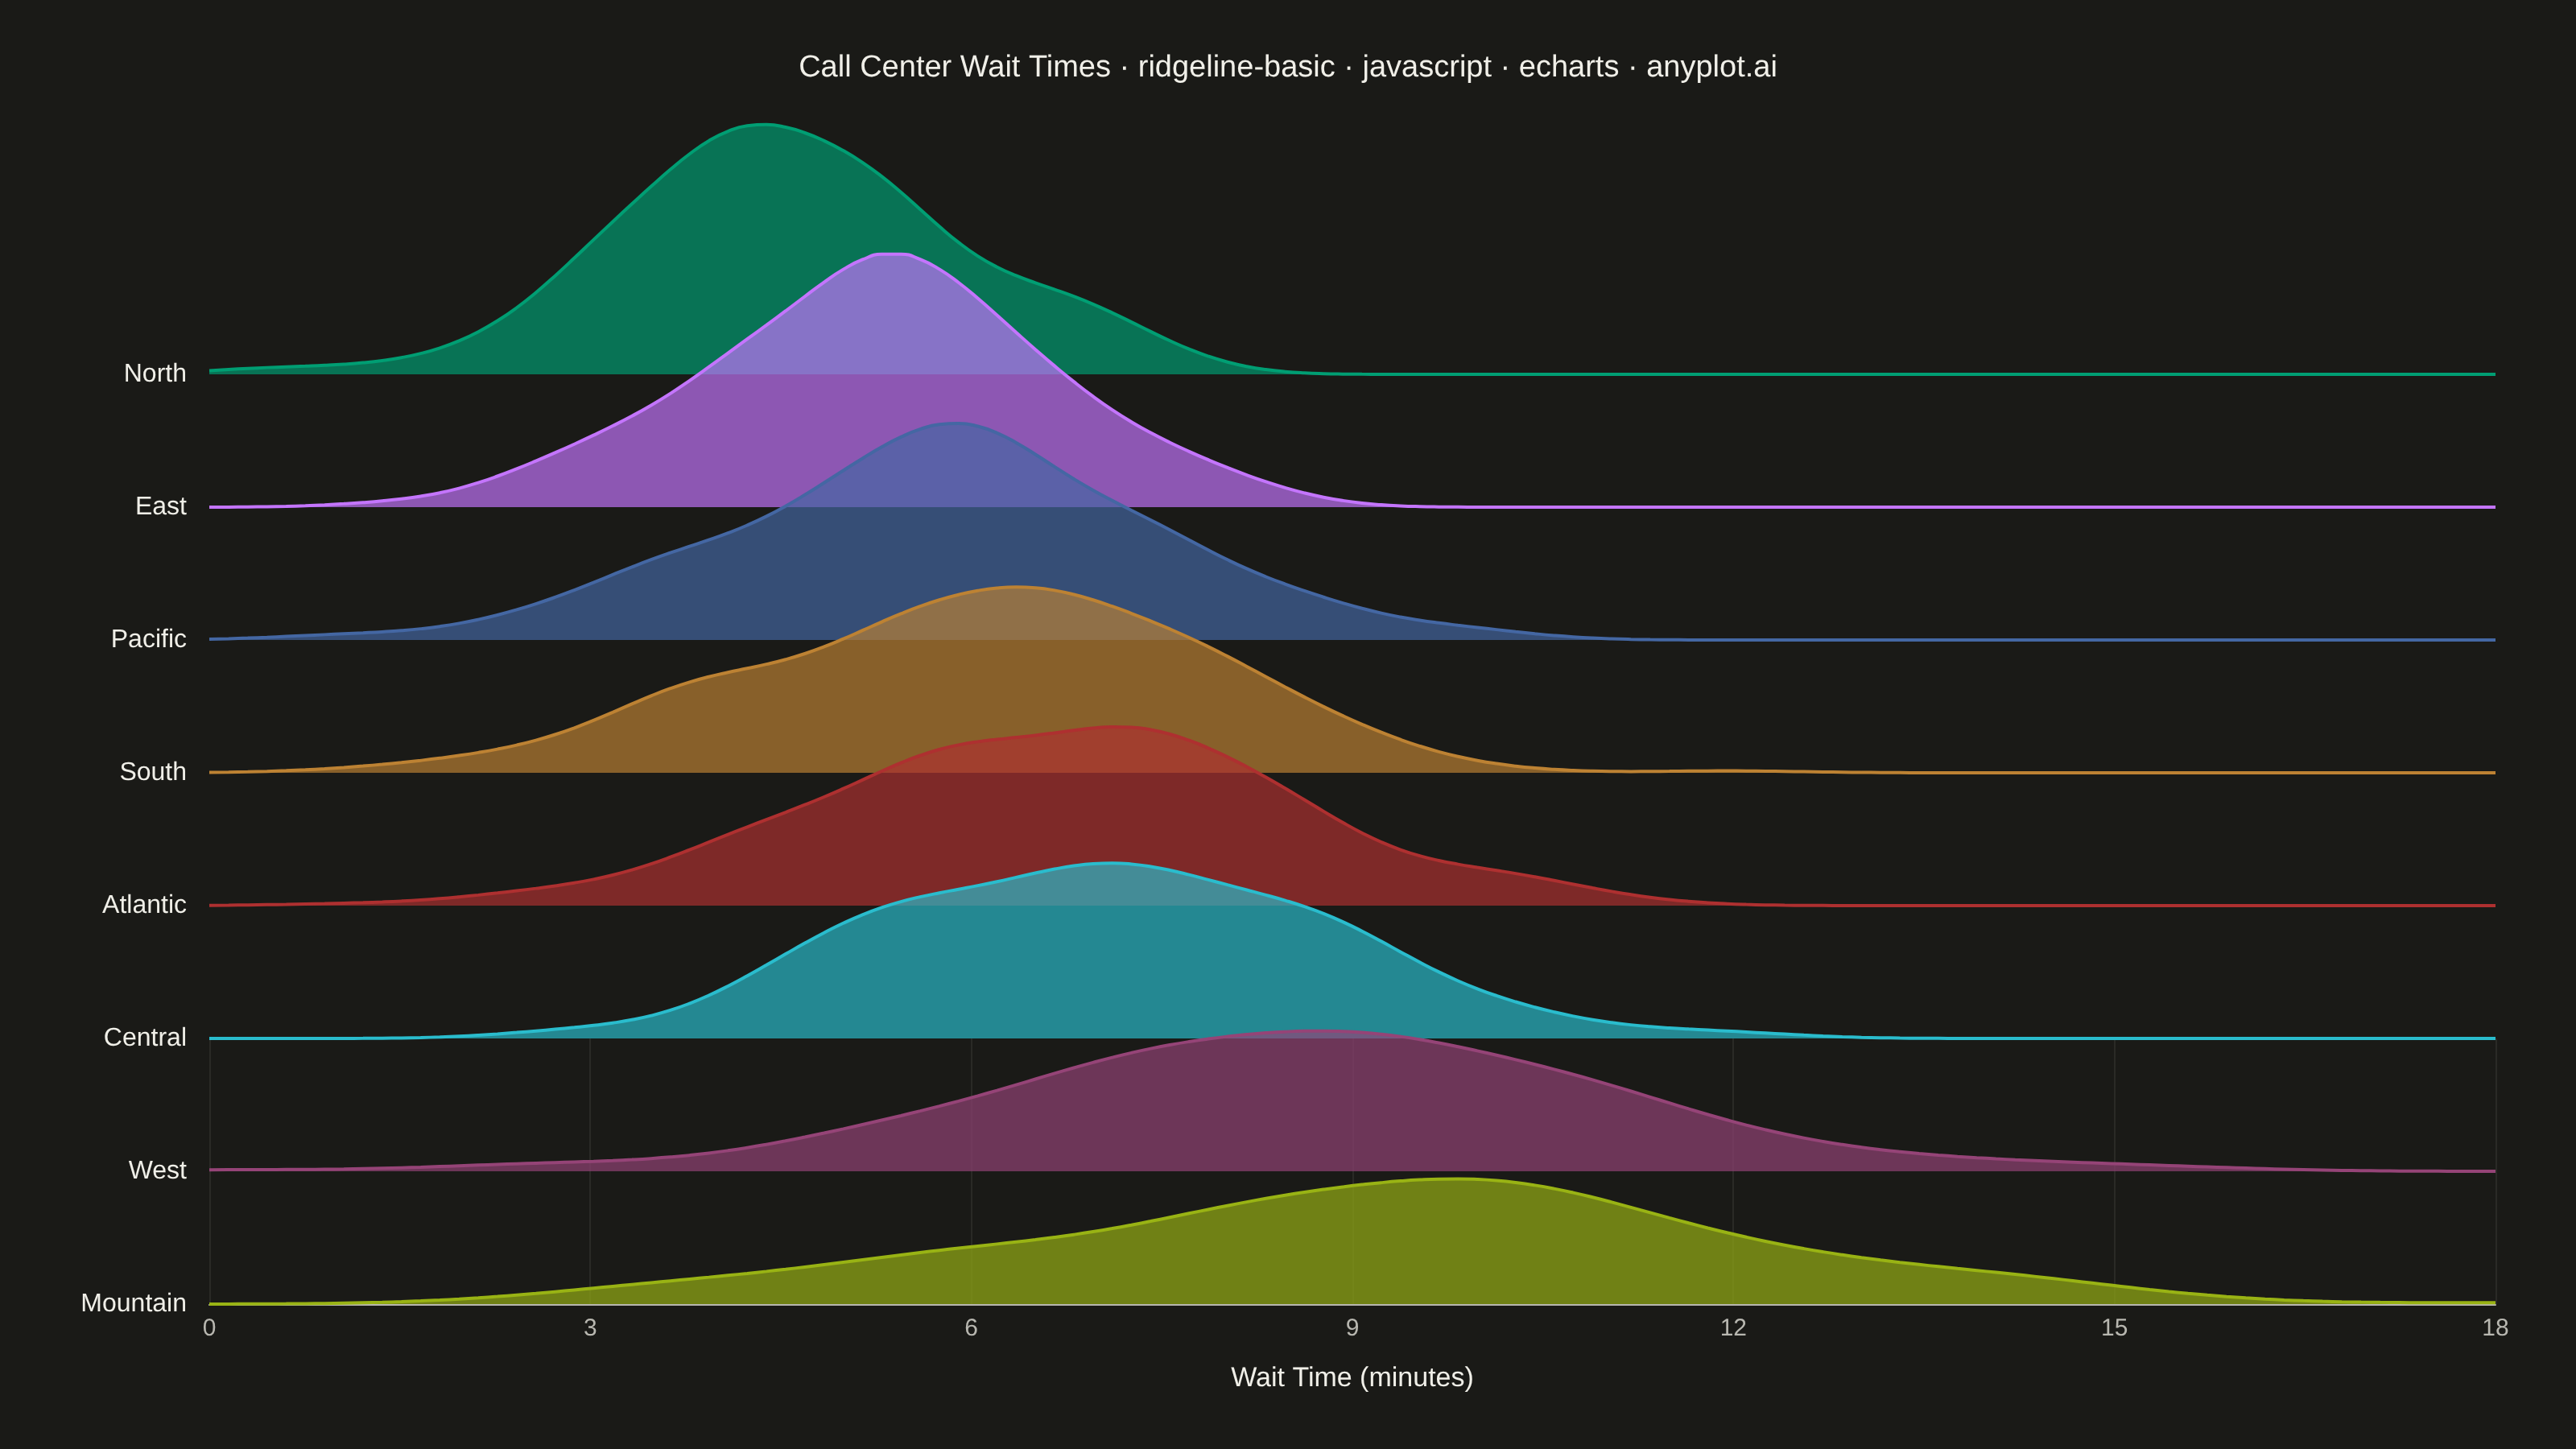
A ridgeline plot (also known as Joy Plot, named after the Joy Division album cover) displays the distribution of multiple groups by stacking partially overlapping density curves vertically. This creates a mountain ridge appearance that allows efficient comparison of many distributions simultaneously while maintaining a compact and visually striking presentation.
// anyplot.ai
// ridgeline-basic: Basic Ridgeline Plot
// Library: echarts 6.1.0 | JavaScript 22.23.1
// Quality: 89/100 | Created: 2026-07-25

const t = window.ANYPLOT_TOKENS;
const size = window.ANYPLOT_SIZE;

// --- Deterministic PRNG (LCG + Box-Muller, no seeded RNG in the browser) ----
let seed = 42;
function nextUniform() {
  seed = (seed * 1103515245 + 12345) & 0x7fffffff;
  return seed / 0x7fffffff;
}
function nextGaussian() {
  const u1 = Math.max(nextUniform(), 1e-9);
  const u2 = nextUniform();
  return Math.sqrt(-2 * Math.log(u1)) * Math.cos(2 * Math.PI * u2);
}

// --- Data: call-center wait times (minutes) across 8 regional support hubs -
// Ordered by mean wait time, best to worst, top to bottom.
const REGIONS = [
  { label: "North", mean: 4.5, std: 1.4 },
  { label: "East", mean: 5.2, std: 1.3 },
  { label: "Pacific", mean: 5.8, std: 1.6 },
  { label: "South", mean: 6.0, std: 1.8 },
  { label: "Atlantic", mean: 6.8, std: 1.7 },
  { label: "Central", mean: 7.0, std: 1.9 },
  { label: "West", mean: 8.5, std: 2.4 },
  { label: "Mountain", mean: 9.5, std: 2.6 },
];
const SAMPLES_PER_GROUP = 300;

const groupSamples = REGIONS.map((region) => {
  const samples = [];
  for (let i = 0; i < SAMPLES_PER_GROUP; i++) {
    samples.push(Math.max(0.2, region.mean + region.std * nextGaussian()));
  }
  return samples;
});

// --- Gaussian KDE over a shared support --------------------------------------
const X_MIN = 0;
const X_MAX = 18; // multiple of the 3-unit tick interval so ticks land evenly
const GRID_POINTS = 120;
const xGrid = Array.from(
  { length: GRID_POINTS },
  (_, i) => X_MIN + (i * (X_MAX - X_MIN)) / (GRID_POINTS - 1)
);

function kde(samples, xValues) {
  const n = samples.length;
  const mean = samples.reduce((a, b) => a + b, 0) / n;
  const variance = samples.reduce((a, b) => a + (b - mean) ** 2, 0) / n;
  const std = Math.sqrt(variance);
  const bandwidth = 1.06 * std * Math.pow(n, -0.2); // Silverman's rule of thumb
  const norm = 1 / (n * bandwidth * Math.sqrt(2 * Math.PI));
  return xValues.map((xi) =>
    norm * samples.reduce((sum, s) => sum + Math.exp(-0.5 * ((xi - s) / bandwidth) ** 2), 0)
  );
}

const densities = groupSamples.map((samples) => kde(samples, xGrid));
const maxDensity = Math.max(...densities.flat());

// --- Layout: N overlapping grids, one per ridge -----------------------------
const N = REGIONS.length;
const LEFT = 130;
const RIGHT = 50;
const TOP = 150;
const BOTTOM = 90;
const OVERLAP = 2.0; // ridgeHeight / bandStep -> ~50% vertical overlap
const plotW = size.width - LEFT - RIGHT;
const plotH = size.height - TOP - BOTTOM;
const bandStep = plotH / N;
const ridgeHeight = bandStep * OVERLAP;

const grids = [];
const xAxes = [];
const yAxes = [];
const series = [];

REGIONS.forEach((region, i) => {
  const baseline = TOP + bandStep * (i + 1);

  grids.push({
    left: LEFT,
    width: plotW,
    top: baseline - ridgeHeight,
    height: ridgeHeight,
  });

  xAxes.push({
    gridIndex: i,
    type: "value",
    min: X_MIN,
    max: X_MAX,
    show: i === N - 1,
    axisLine: { lineStyle: { color: t.inkSoft } },
    axisTick: { show: false },
    axisLabel: { color: t.inkSoft, fontSize: 15 },
    splitLine: {
      show: i === N - 1,
      lineStyle: { color: t.grid, opacity: 0.5 },
    },
    name: i === N - 1 ? "Wait Time (minutes)" : undefined,
    nameLocation: "middle",
    nameGap: 38,
    nameTextStyle: { color: t.ink, fontSize: 17 },
  });

  yAxes.push({
    gridIndex: i,
    type: "value",
    min: 0,
    max: maxDensity * 1.05,
    show: true,
    axisLine: { show: false },
    axisTick: { show: false },
    splitLine: { show: false },
    axisLabel: {
      formatter: (_value, idx) => (idx === 0 ? region.label : ""),
      color: t.ink,
      fontSize: 16,
      fontWeight: 500,
      margin: 14,
    },
  });

  series.push({
    type: "line",
    xAxisIndex: i,
    yAxisIndex: i,
    data: xGrid.map((x, j) => [x, densities[i][j]]),
    smooth: true,
    symbol: "none",
    lineStyle: { width: 2, color: t.palette[i] },
    areaStyle: { color: t.palette[i], opacity: 0.68 },
    z: i + 2,
  });
});

// --- Title (fontsize scales with length, see plot-generator.md) -------------
const TITLE = "Call Center Wait Times · ridgeline-basic · javascript · echarts · anyplot.ai";
const titleFontSize = Math.max(15, Math.round(22 * Math.min(1, 67 / TITLE.length)));

// --- Init ---------------------------------------------------------------------
const chart = echarts.init(document.getElementById("container"));

// --- Option ---------------------------------------------------------------------
chart.setOption({
  animation: false,
  backgroundColor: "transparent",
  title: {
    text: TITLE,
    left: "center",
    top: 28,
    textStyle: { color: t.ink, fontSize: titleFontSize, fontWeight: 500 },
  },
  grid: grids,
  xAxis: xAxes,
  yAxis: yAxes,
  series: series,
});
Runnable source as JSON, for any HTTP client: https://api.anyplot.ai/specs/ridgeline-basic/echarts/code. Any spec id and library id listed in llms-full.txt fit the same URL shape; every URL below is complete and callable.
{
  "spec_id": "ridgeline-basic",
  "language": "javascript",
  "library": "echarts",
  "page": "https://anyplot.ai/ridgeline-basic/javascript/echarts",
  "hub": "https://anyplot.ai/ridgeline-basic",
  "code_json": "https://api.anyplot.ai/specs/ridgeline-basic/echarts/code",
  "spec_json": "https://api.anyplot.ai/specs/ridgeline-basic",
  "render_light_png": "https://storage.googleapis.com/anyplot-images/plots/ridgeline-basic/javascript/echarts/plot-light.png",
  "render_dark_png": "https://storage.googleapis.com/anyplot-images/plots/ridgeline-basic/javascript/echarts/plot-dark.png",
  "interactive_light_html": "https://storage.googleapis.com/anyplot-images/plots/ridgeline-basic/javascript/echarts/plot-light.html",
  "interactive_dark_html": "https://storage.googleapis.com/anyplot-images/plots/ridgeline-basic/javascript/echarts/plot-dark.html",
  "quality_score": 89.0,
  "license": "MIT",
  "guide": "https://anyplot.ai/llms.txt"
}
Part of Basic Ridgeline Plot on anyplot.ai.