The same plot in 14 other libraries — JavaScript: Chart.js, D3.js, Apache ECharts, Highcharts; Python: Altair, Bokeh, lets-plot, Matplotlib, Plotly, plotnine, Pygal, Seaborn; R: ggplot2; Julia: Makie.jl. Compare all 15 side by side: Basic Ridgeline Plot in Python, R, Julia and JavaScript.
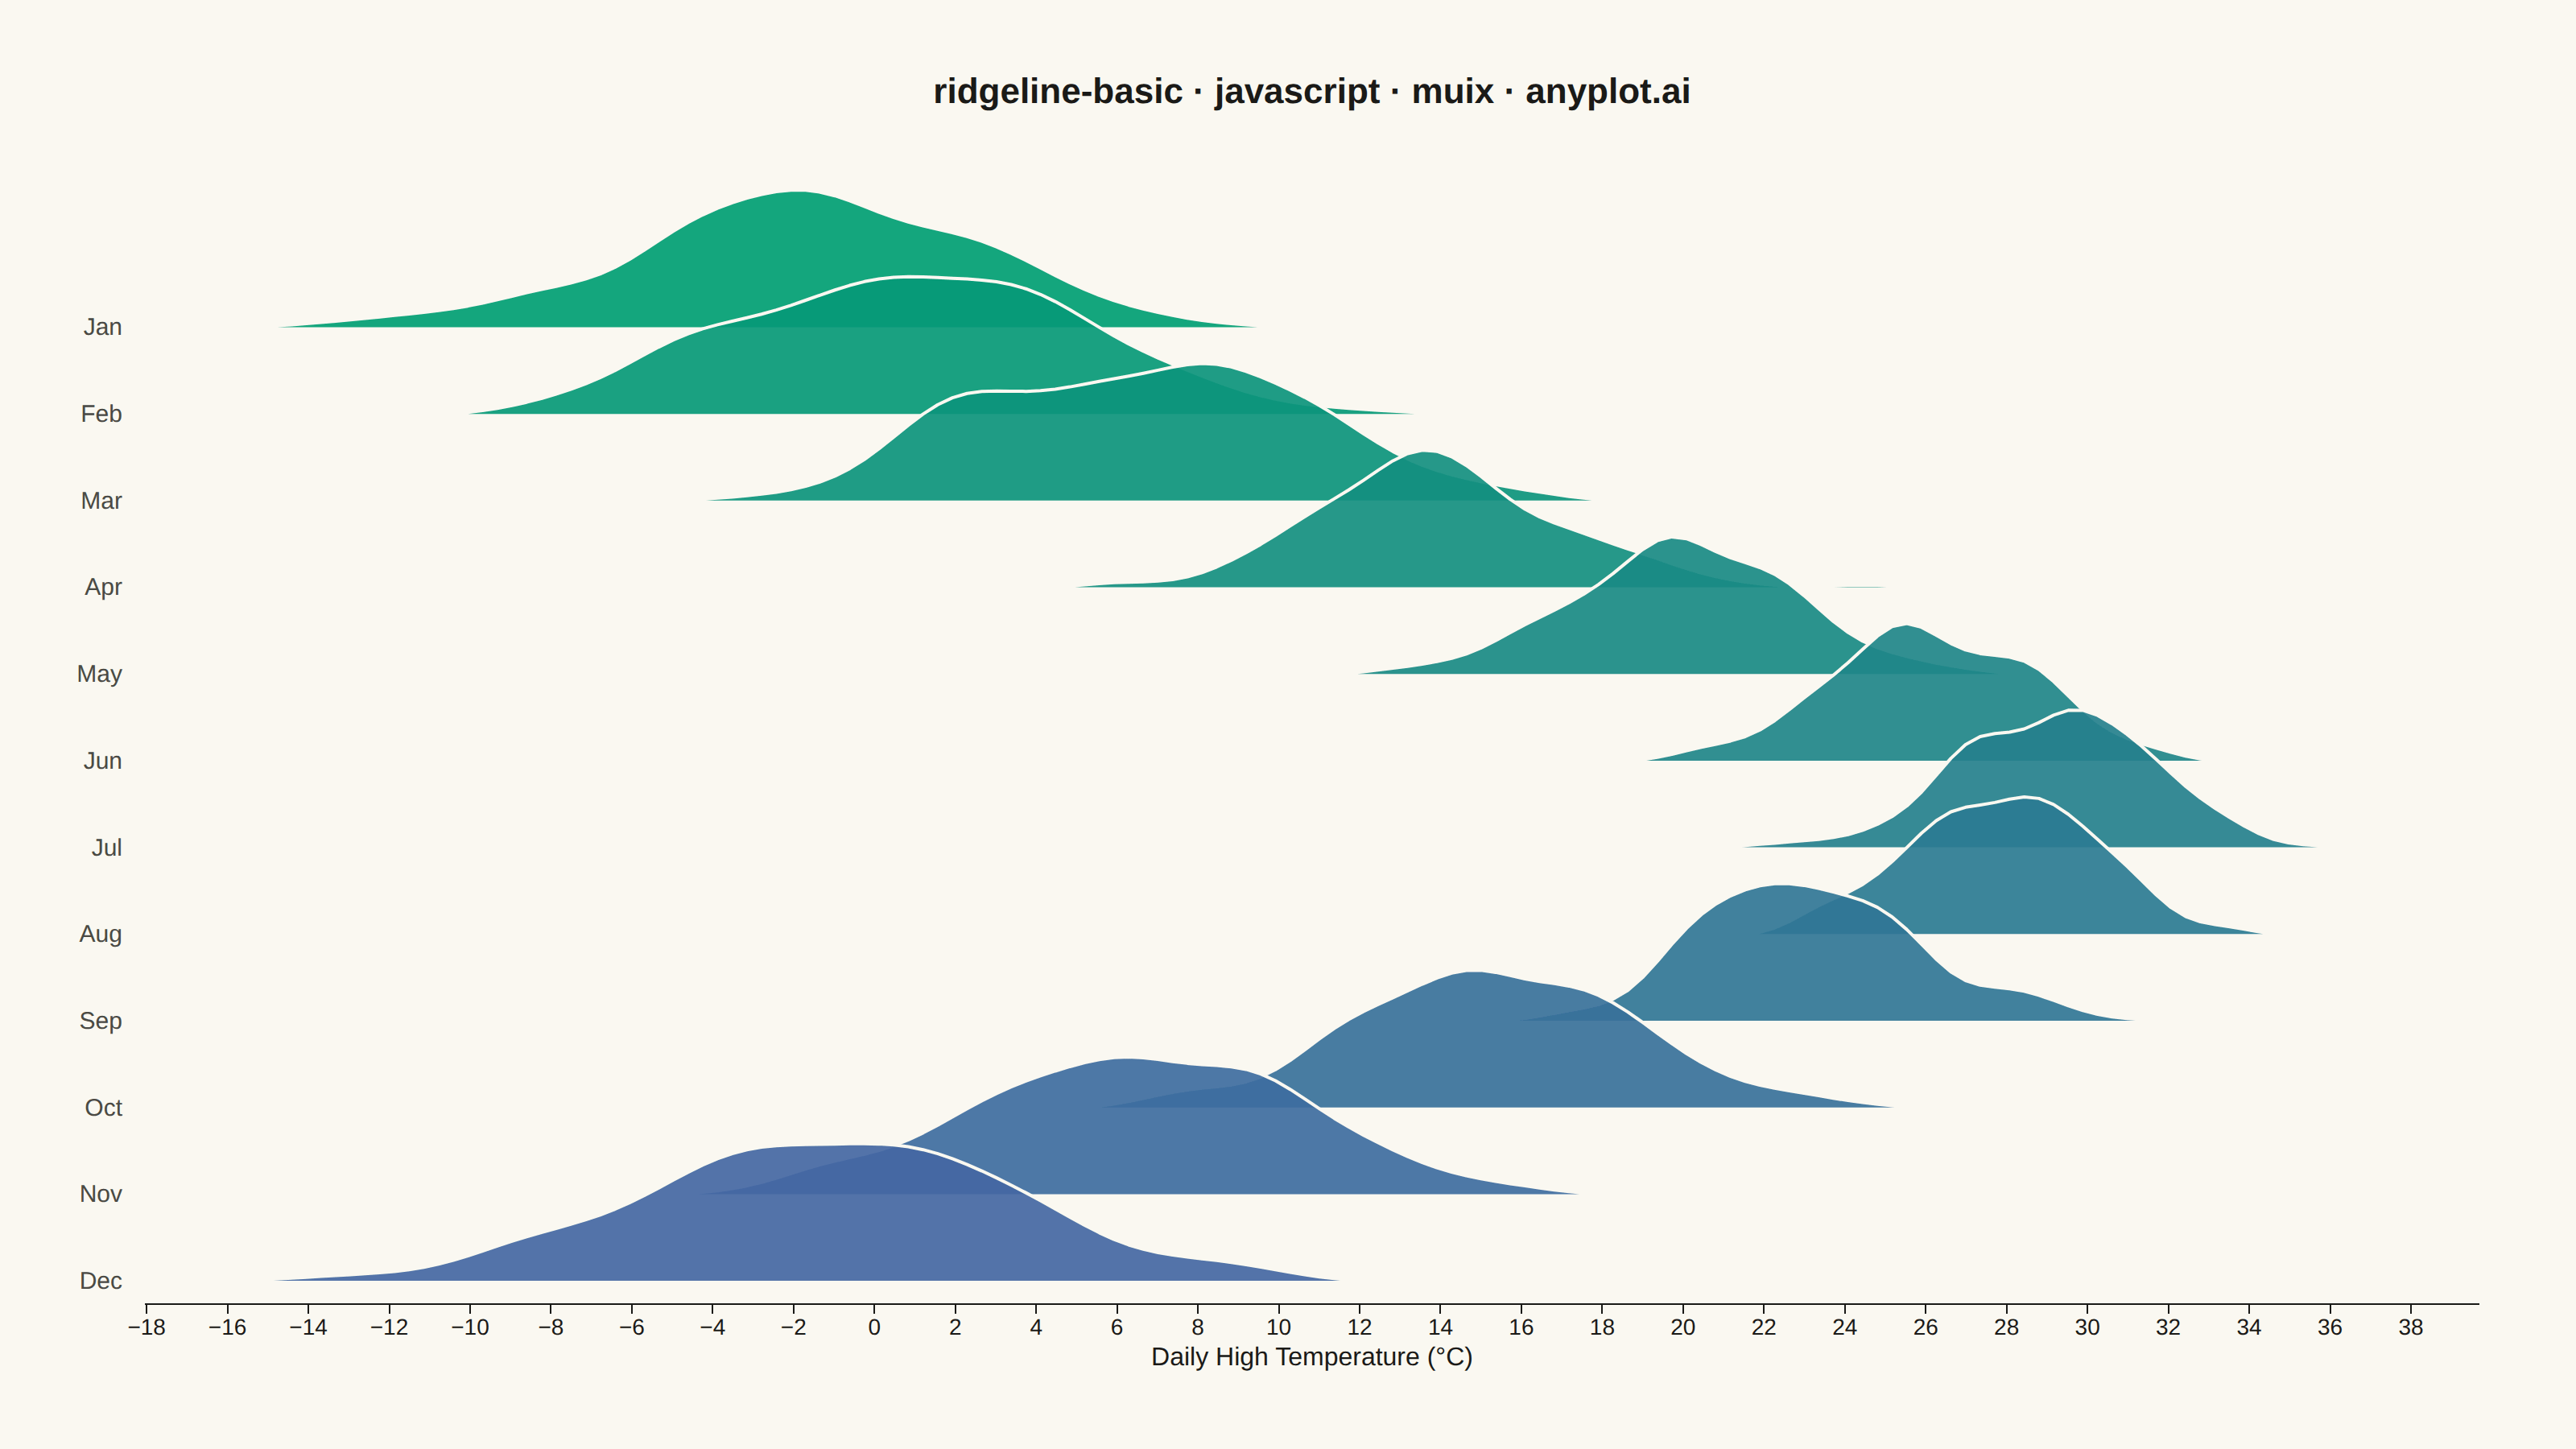
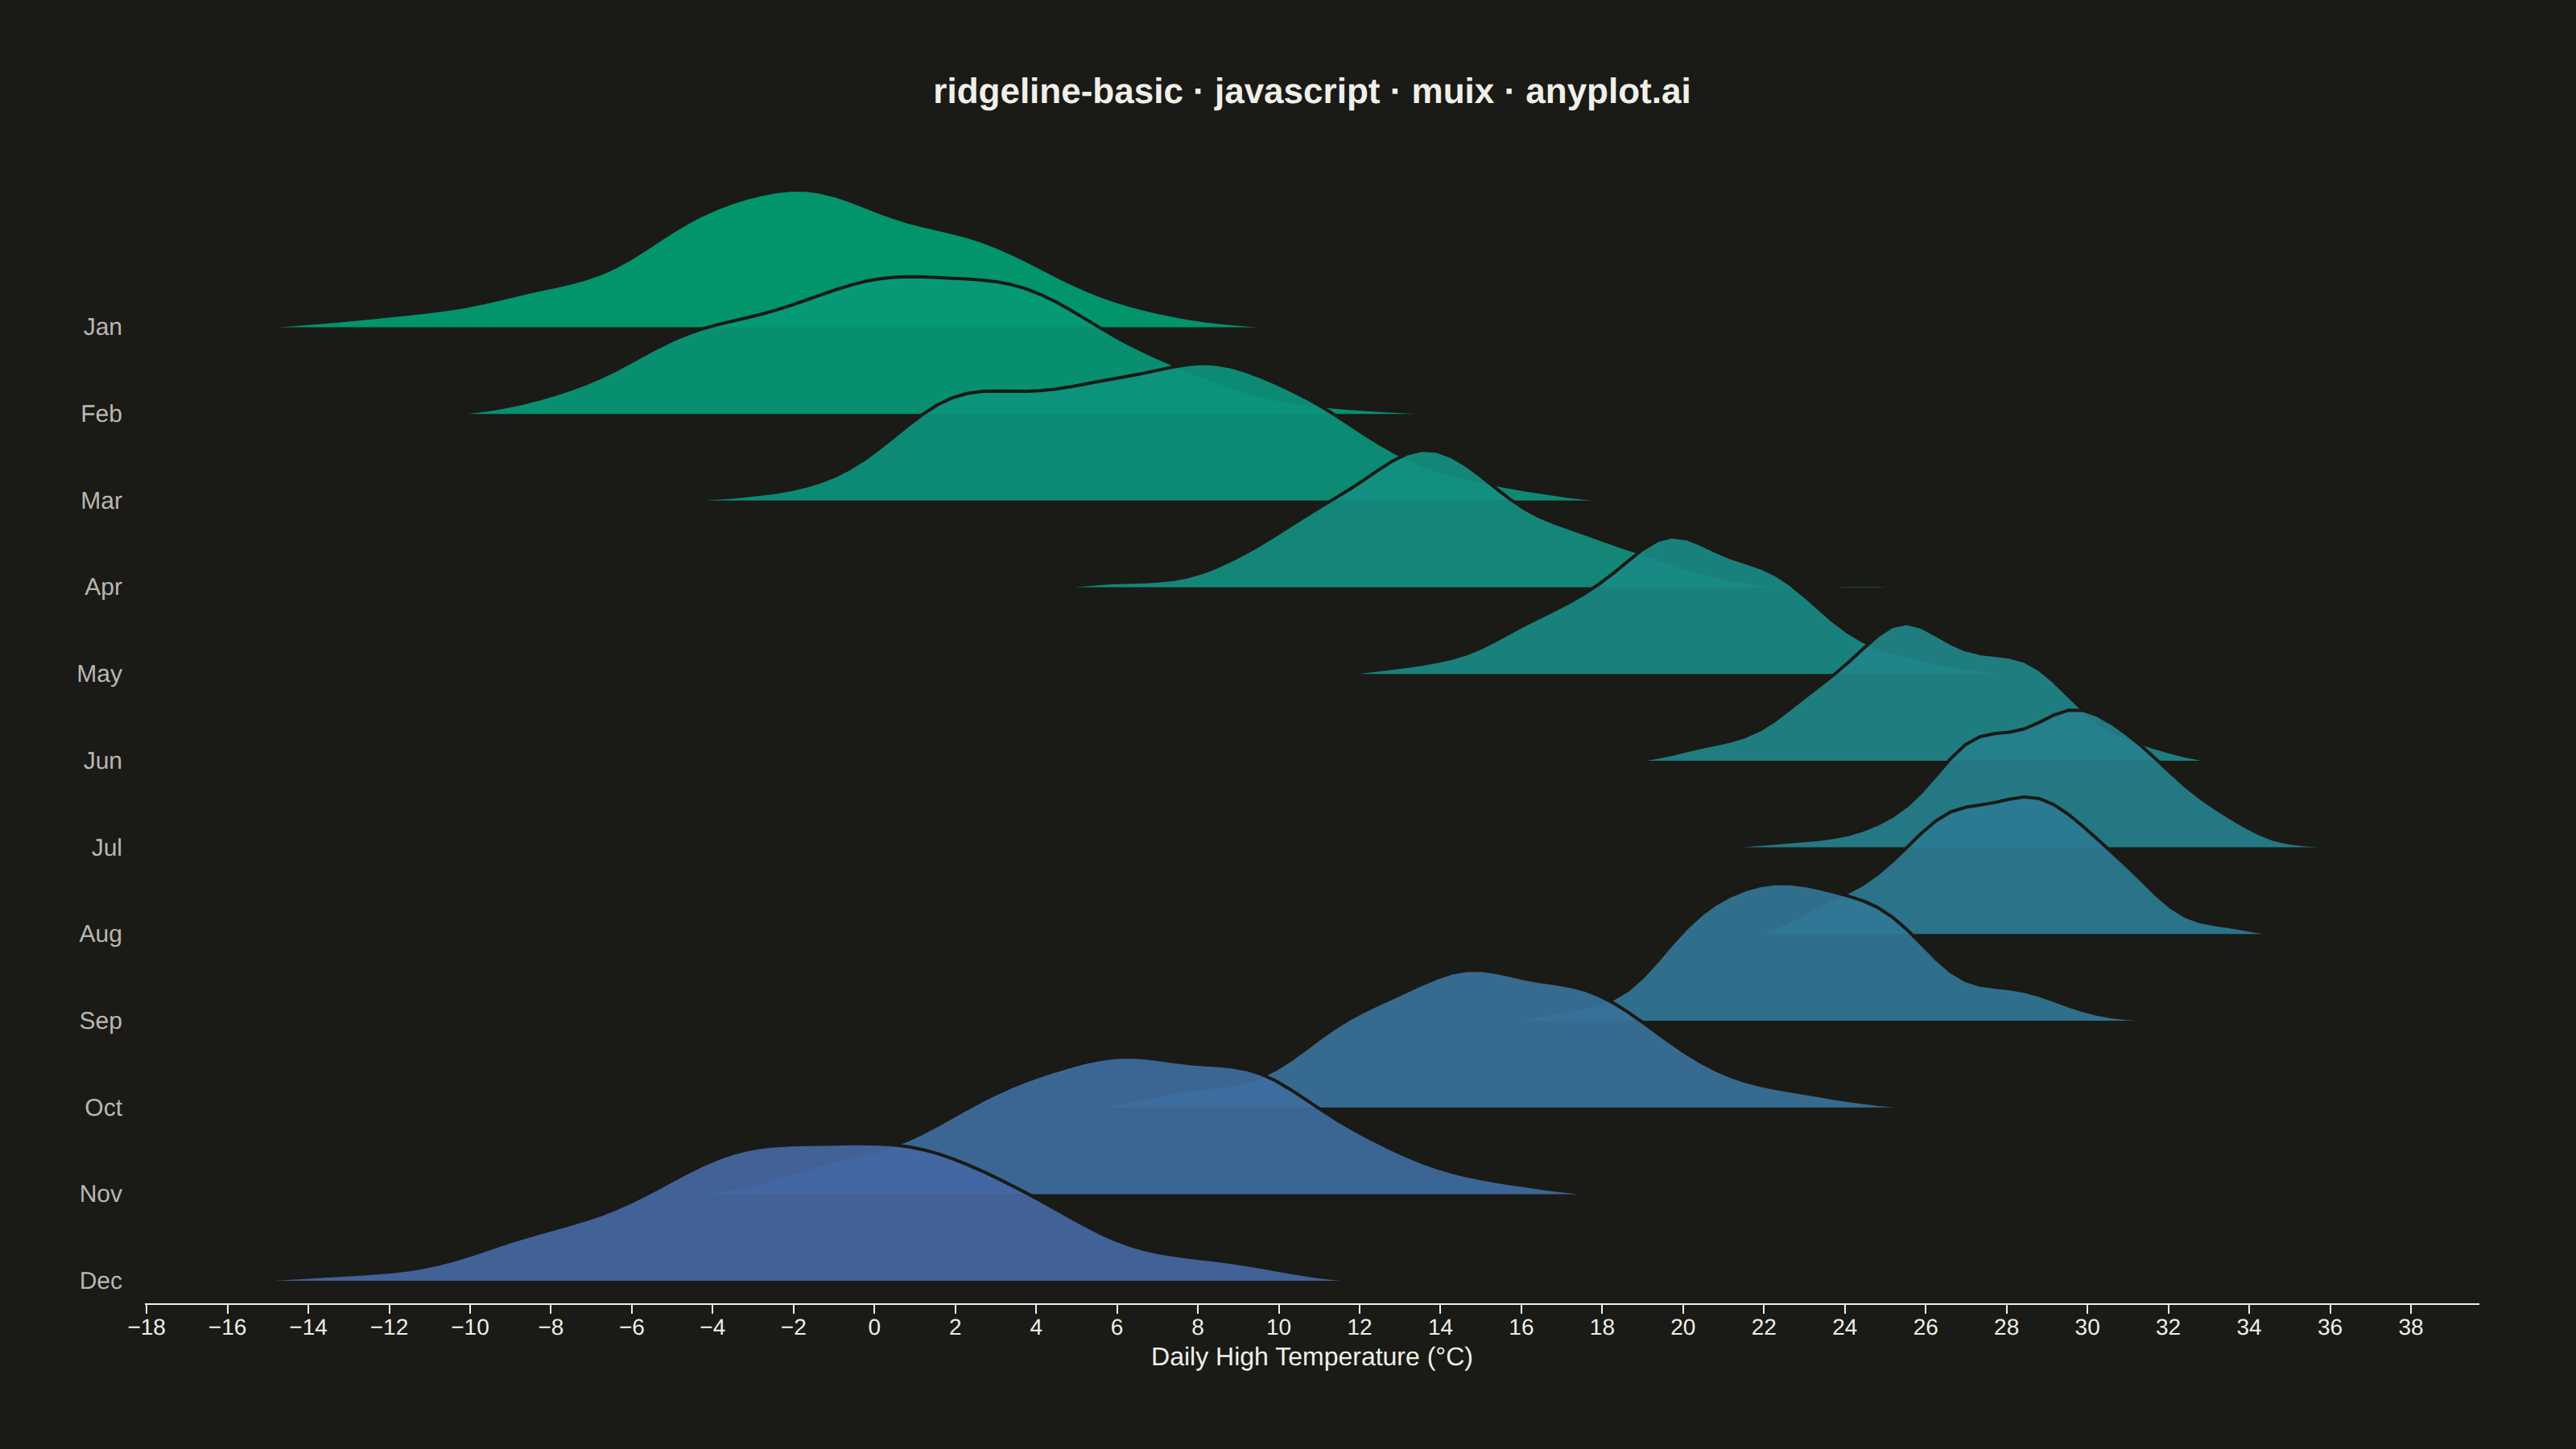
A ridgeline plot (also known as Joy Plot, named after the Joy Division album cover) displays the distribution of multiple groups by stacking partially overlapping density curves vertically. This creates a mountain ridge appearance that allows efficient comparison of many distributions simultaneously while maintaining a compact and visually striking presentation.
// anyplot.ai
// ridgeline-basic: Basic Ridgeline Plot
// Library: muix 7.29.1 | JavaScript 22.23.1
// Quality: 92/100 | Created: 2026-07-25

import { ChartContainer } from "@mui/x-charts/ChartContainer";
import { ChartsXAxis } from "@mui/x-charts/ChartsXAxis";
import { useXScale, useYScale, useDrawingArea } from "@mui/x-charts/hooks";

const t = window.ANYPLOT_TOKENS;
const FONT = "-apple-system, BlinkMacSystemFont, 'Segoe UI', Roboto, Helvetica, Arial, sans-serif";

// --- Data: daily high temperatures by month, temperate continental climate -
// Deterministic LCG so the sampled distributions (and their KDEs) are stable
// across renders — the browser has no seeded Math.random().
function makeLcg(seed) {
  let state = seed >>> 0;
  return function next() {
    state = (state * 1664525 + 1013904223) >>> 0;
    return state / 4294967296;
  };
}
const rand = makeLcg(42);
function gaussianSample() {
  const u1 = Math.max(rand(), 1e-9);
  const u2 = rand();
  return Math.sqrt(-2 * Math.log(u1)) * Math.cos(2 * Math.PI * u2);
}

const MONTHS = ["Jan", "Feb", "Mar", "Apr", "May", "Jun", "Jul", "Aug", "Sep", "Oct", "Nov", "Dec"];
// Monthly mean/std of daily highs (°C) — wider spread in winter, tighter in summer
const MEAN_HIGH = [-2, 1, 7, 14, 20, 26, 29, 28, 23, 15, 7, -1];
const STD_HIGH = [4.5, 4.5, 4.0, 3.5, 3.0, 2.5, 2.3, 2.3, 2.8, 3.3, 4.0, 4.5];
const SAMPLE_COUNT = 200;

const monthlySamples = MEAN_HIGH.map((mean, i) =>
  Array.from({ length: SAMPLE_COUNT }, () => mean + STD_HIGH[i] * gaussianSample())
);

const allTemps = monthlySamples.flat();
const dataMin = Math.min(...allTemps);
const dataMax = Math.max(...allTemps);
const xPad = (dataMax - dataMin) * 0.08;
const X_MIN = dataMin - xPad;
const X_MAX = dataMax + xPad;

const GRID_N = 160;
const grid = Array.from({ length: GRID_N }, (_, k) => X_MIN + (k * (X_MAX - X_MIN)) / (GRID_N - 1));

// Gaussian KDE per month, bandwidth via Silverman's rule of thumb, normalized
// to a common peak of 1 so ridge height compares shape, not raw sample count.
function stdOf(samples) {
  const m = samples.reduce((a, b) => a + b, 0) / samples.length;
  const variance = samples.reduce((a, b) => a + (b - m) ** 2, 0) / (samples.length - 1);
  return Math.sqrt(variance);
}
function kde(samples) {
  const n = samples.length;
  const bandwidth = 0.9 * stdOf(samples) * Math.pow(n, -0.2);
  const raw = grid.map((gx) => samples.reduce((sum, s) => sum + Math.exp(-0.5 * ((gx - s) / bandwidth) ** 2), 0));
  const peak = Math.max(...raw);
  return raw.map((v) => v / peak);
}
const monthlyDensity = monthlySamples.map((samples) => kde(samples));

// --- Ridge layout ------------------------------------------------------------
// Row 0 (Jan) at the top, row N-1 (Dec) at the bottom; ~60% peak-to-row-gap
// overlap per the spec's guidance. Rendered in Jan→Dec order so each lower
// ridge paints over the tail of the ridge above it (painter's algorithm).
const N = MONTHS.length;
const ROW_GAP = 1;
const PEAK_HEIGHT = 1.6;
const baselineOf = (i) => (N - 1 - i) * ROW_GAP;
const Y_MIN = -0.25;
const Y_MAX = baselineOf(0) + PEAK_HEIGHT + 0.15;

// Interpolate between the two imprint_seq stops by a 0..1 fraction — color
// tracks month order (Jan = brand green, Dec = blue), a redundant encoding
// alongside vertical position.
function lerpColor(hexA, hexB, frac) {
  const a = parseInt(hexA.slice(1), 16);
  const b = parseInt(hexB.slice(1), 16);
  const ar = (a >> 16) & 255, ag = (a >> 8) & 255, ab = a & 255;
  const br = (b >> 16) & 255, bg = (b >> 8) & 255, bb = b & 255;
  const rr = Math.round(ar + (br - ar) * frac);
  const rg = Math.round(ag + (bg - ag) * frac);
  const rb = Math.round(ab + (bb - ab) * frac);
  return `rgb(${rr}, ${rg}, ${rb})`;
}
const ridgeColor = (i) => lerpColor(t.seq[0], t.seq[1], i / (N - 1));

// --- Ridges — density curves drawn on the MUI X coordinate system -----------
function Ridges() {
  const xScale = useXScale();
  const yScale = useYScale();

  return (
    <g strokeLinejoin="round">
      {MONTHS.map((name, i) => {
        const baseline = baselineOf(i);
        const baselineY = yScale(baseline);
        const topPoints = grid.map((gx, k) => `${xScale(gx)},${yScale(baseline + monthlyDensity[i][k] * PEAK_HEIGHT)}`);
        const path = `M${xScale(grid[0])},${baselineY} L${topPoints.join(" L")} L${xScale(grid[GRID_N - 1])},${baselineY} Z`;
        return <path key={name} d={path} fill={ridgeColor(i)} fillOpacity={0.92} stroke={t.pageBg} strokeWidth={2} />;
      })}
    </g>
  );
}

// Group labels replace the numeric y-axis, one per ridge baseline.
function RidgeLabels() {
  const yScale = useYScale();
  const { left } = useDrawingArea();

  return (
    <g>
      {MONTHS.map((name, i) => (
        <text
          key={name}
          x={left - 14}
          y={yScale(baselineOf(i))}
          textAnchor="end"
          dominantBaseline="middle"
          fontSize={15}
          fill={t.inkSoft}
          fontFamily={FONT}
        >
          {name}
        </text>
      ))}
    </g>
  );
}

function ChartTitle({ text, fontSize }) {
  const { left, top, width: drawW } = useDrawingArea();
  return (
    <text x={left + drawW / 2} y={top - 46} textAnchor="middle" fontSize={fontSize} fontWeight={600} fill={t.ink} fontFamily={FONT}>
      {text}
    </text>
  );
}

export default function Chart() {
  const W = window.ANYPLOT_SIZE.width;
  const H = window.ANYPLOT_SIZE.height;

  const title = "ridgeline-basic · javascript · muix · anyplot.ai";
  const titleSize = title.length > 67 ? Math.round(22 * (67 / title.length)) : 22;

  return (
    <ChartContainer
      width={W}
      height={H}
      skipAnimation
      series={[]}
      xAxis={[
        {
          scaleType: "linear",
          min: X_MIN,
          max: X_MAX,
          label: "Daily High Temperature (°C)",
          labelStyle: { fontSize: 16 },
          tickLabelStyle: { fontSize: 14 },
        },
      ]}
      yAxis={[{ scaleType: "linear", min: Y_MIN, max: Y_MAX }]}
      margin={{ top: 110, right: 60, bottom: 90, left: 90 }}
    >
      <ChartTitle text={title} fontSize={titleSize} />
      <Ridges />
      <RidgeLabels />
      <ChartsXAxis position="bottom" />
    </ChartContainer>
  );
}
Runnable source as JSON, for any HTTP client: https://api.anyplot.ai/specs/ridgeline-basic/muix/code. Any spec id and library id listed in llms-full.txt fit the same URL shape; every URL below is complete and callable.
{
  "spec_id": "ridgeline-basic",
  "language": "javascript",
  "library": "muix",
  "page": "https://anyplot.ai/ridgeline-basic/javascript/muix",
  "hub": "https://anyplot.ai/ridgeline-basic",
  "code_json": "https://api.anyplot.ai/specs/ridgeline-basic/muix/code",
  "spec_json": "https://api.anyplot.ai/specs/ridgeline-basic",
  "render_light_png": "https://storage.googleapis.com/anyplot-images/plots/ridgeline-basic/javascript/muix/plot-light.png",
  "render_dark_png": "https://storage.googleapis.com/anyplot-images/plots/ridgeline-basic/javascript/muix/plot-dark.png",
  "interactive_light_html": "https://storage.googleapis.com/anyplot-images/plots/ridgeline-basic/javascript/muix/plot-light.html",
  "interactive_dark_html": "https://storage.googleapis.com/anyplot-images/plots/ridgeline-basic/javascript/muix/plot-dark.html",
  "quality_score": 92.0,
  "license": "MIT",
  "guide": "https://anyplot.ai/llms.txt"
}
Part of Basic Ridgeline Plot on anyplot.ai.