The same plot in 14 other libraries — JavaScript: Chart.js, Apache ECharts, Highcharts, MUI X Charts; Python: Altair, Bokeh, lets-plot, Matplotlib, Plotly, plotnine, Pygal, Seaborn; R: ggplot2; Julia: Makie.jl. Compare all 15 side by side: Basic Ridgeline Plot in Python, R, Julia and JavaScript.
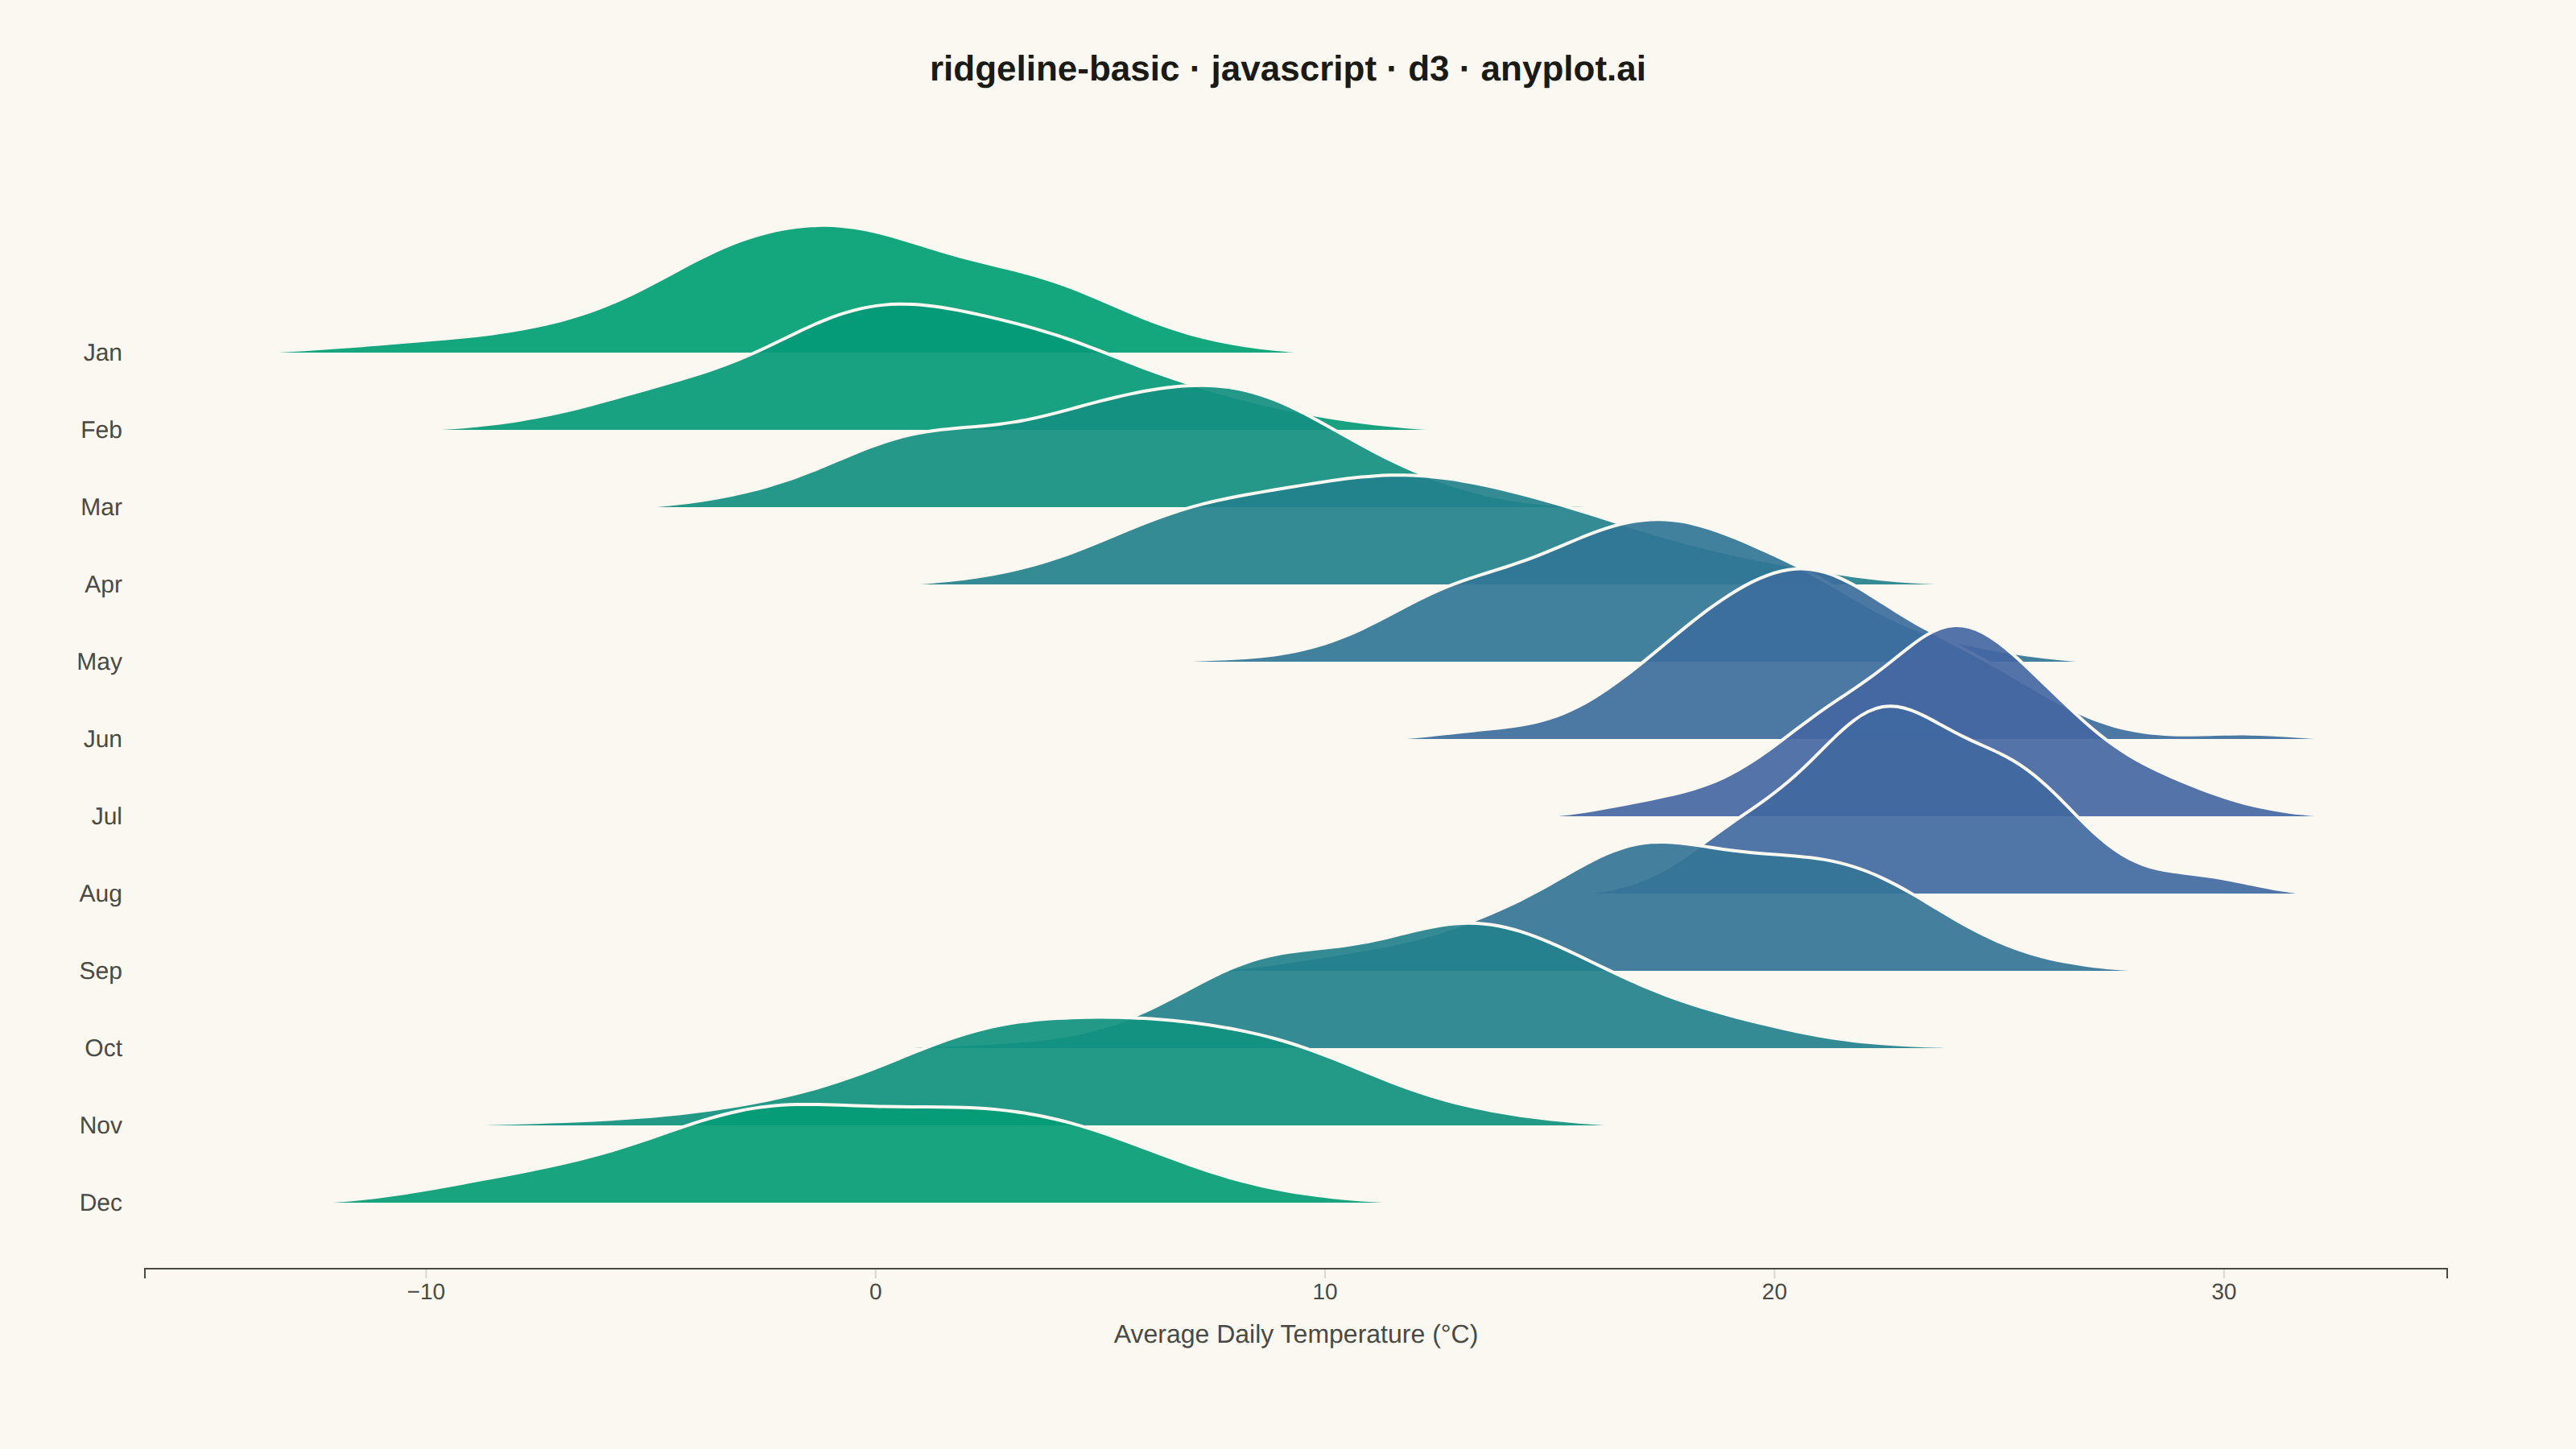
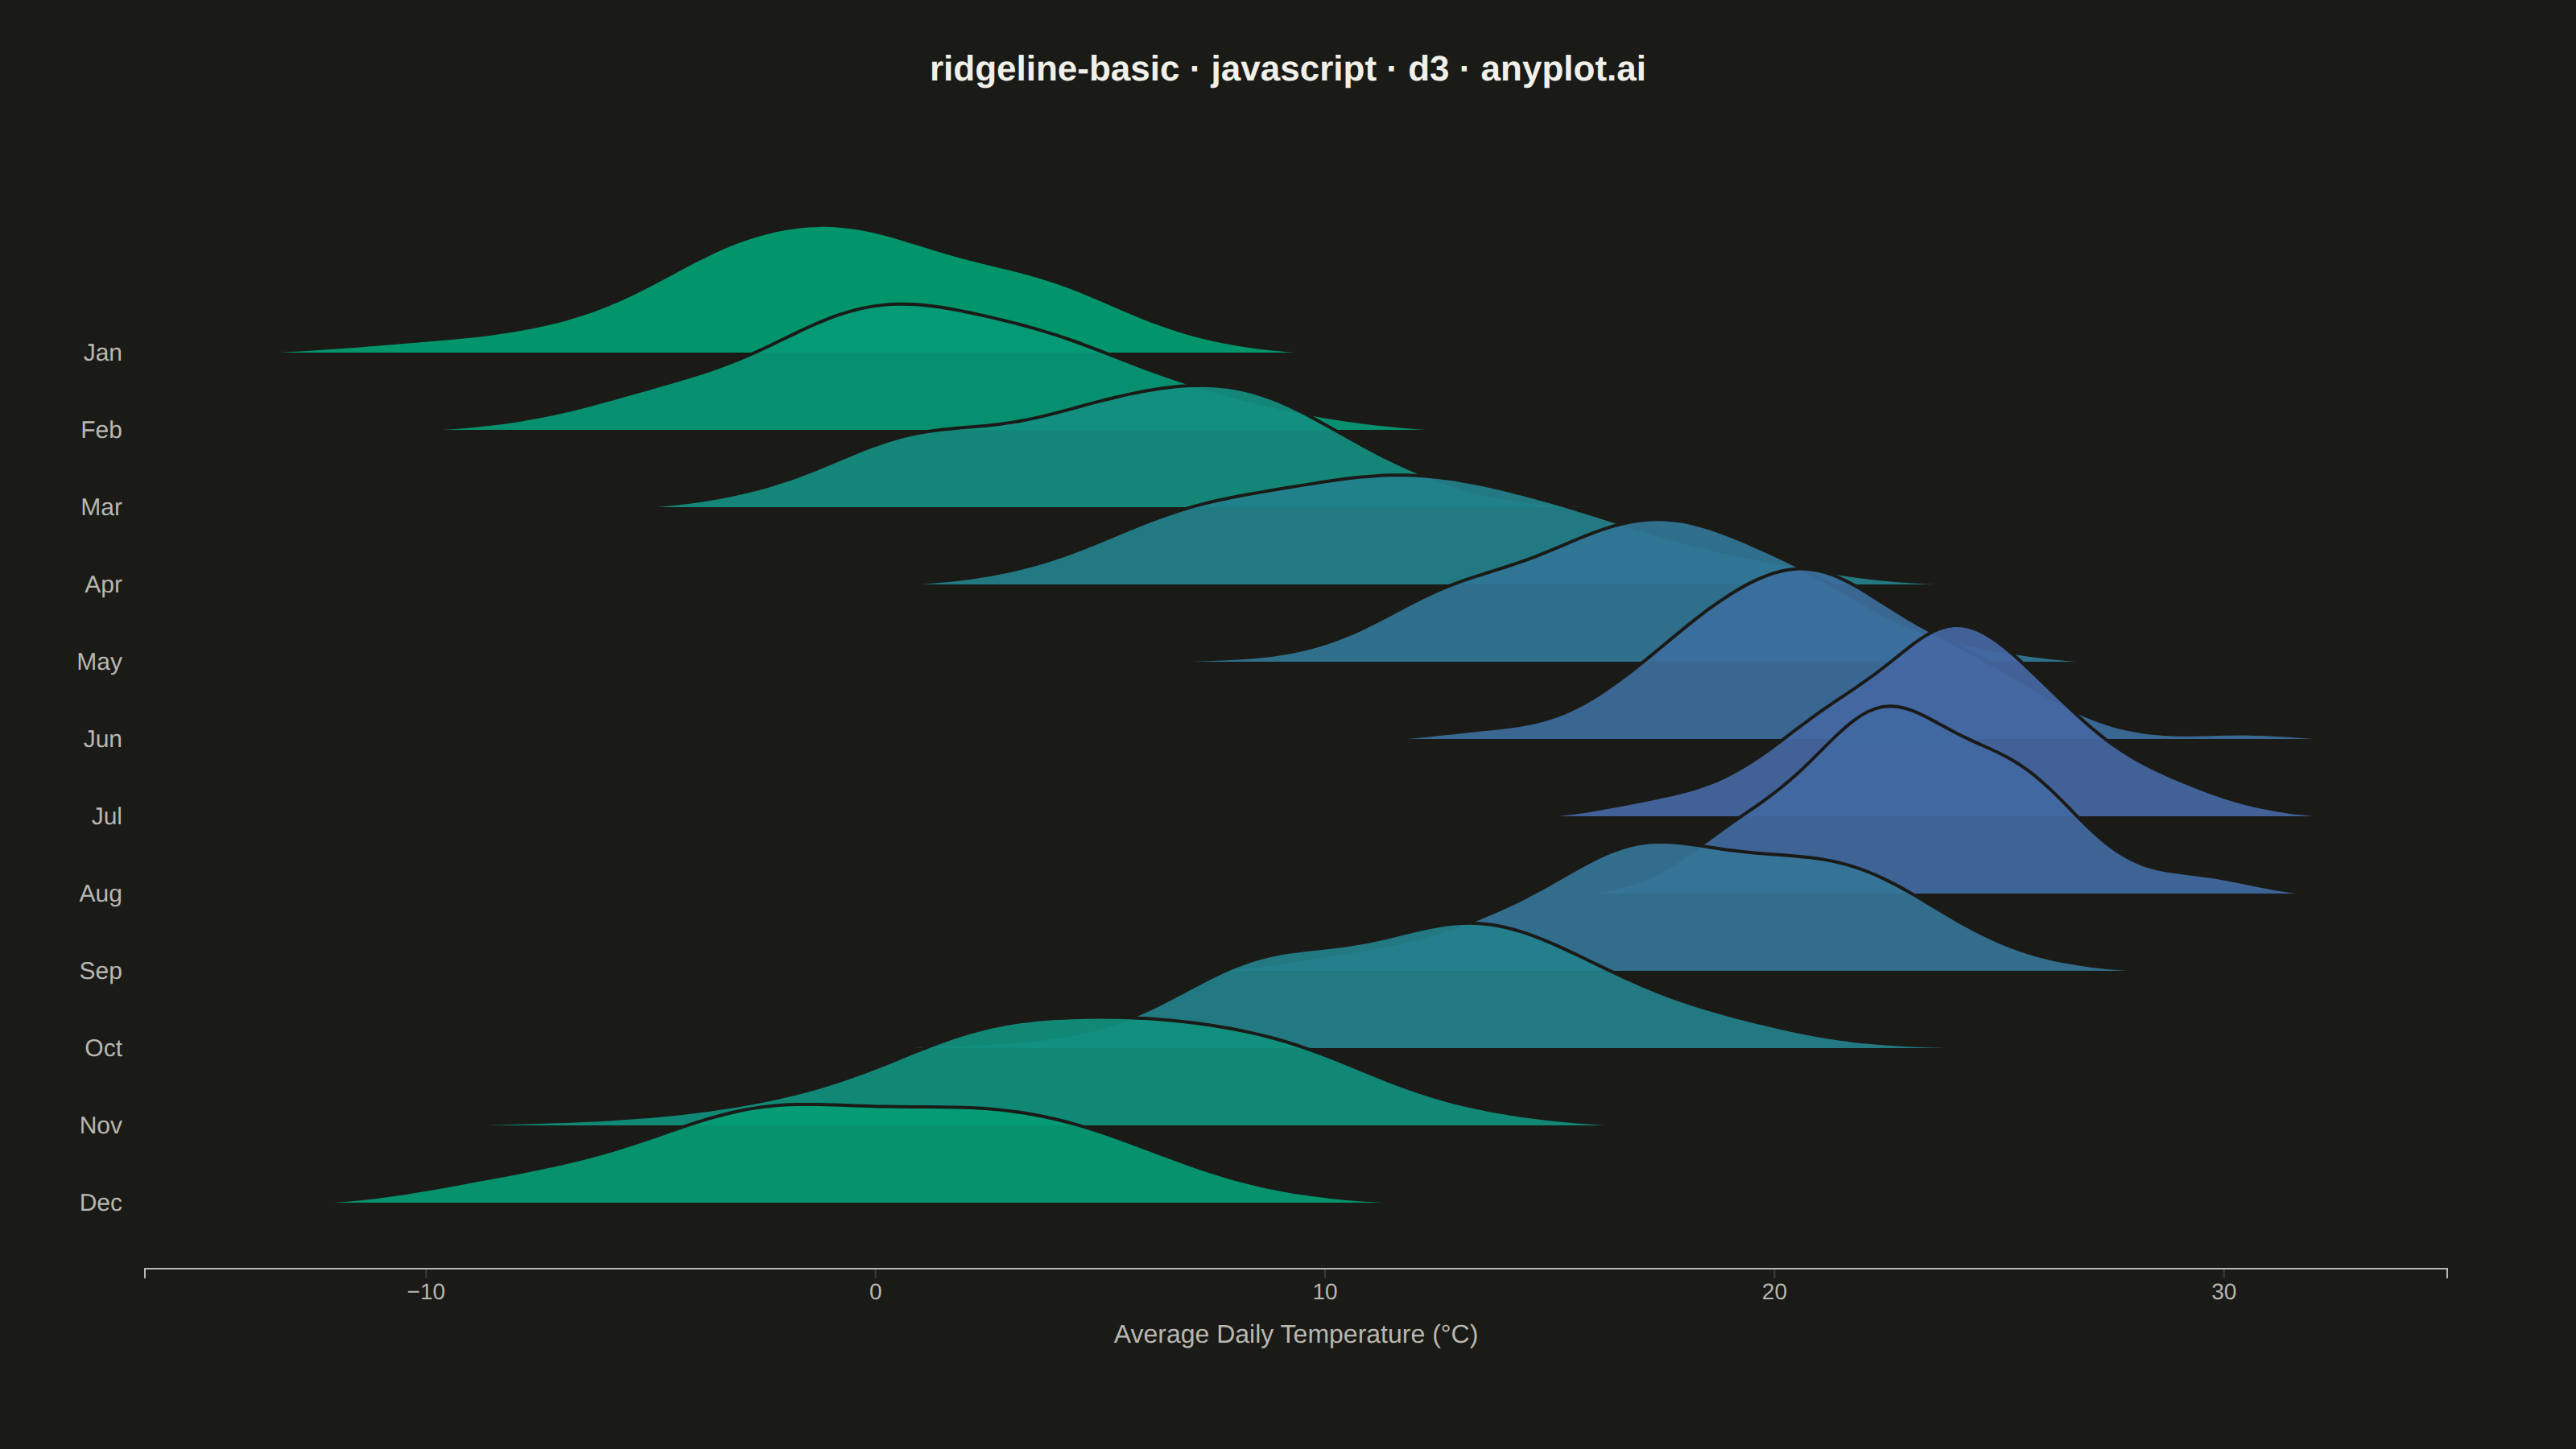
A ridgeline plot (also known as Joy Plot, named after the Joy Division album cover) displays the distribution of multiple groups by stacking partially overlapping density curves vertically. This creates a mountain ridge appearance that allows efficient comparison of many distributions simultaneously while maintaining a compact and visually striking presentation.
// anyplot.ai
// ridgeline-basic: Basic Ridgeline Plot
// Library: d3 7.9.0 | JavaScript 22.23.1
// Quality: 91/100 | Created: 2026-07-25

const t = window.ANYPLOT_TOKENS;
const { width, height } = window.ANYPLOT_SIZE;

// --- Data (in-memory, deterministic) ----------------------------------------
// Monthly average daily temperature distributions for a temperate city.
const MONTHS = [
  { name: "Jan", mean: -1, std: 4.2 },
  { name: "Feb", mean: 1, std: 4.0 },
  { name: "Mar", mean: 6, std: 4.3 },
  { name: "Apr", mean: 12, std: 4.0 },
  { name: "May", mean: 17, std: 3.6 },
  { name: "Jun", mean: 21, std: 3.2 },
  { name: "Jul", mean: 24, std: 3.0 },
  { name: "Aug", mean: 23, std: 3.1 },
  { name: "Sep", mean: 18, std: 3.5 },
  { name: "Oct", mean: 12, std: 3.9 },
  { name: "Nov", mean: 5, std: 4.1 },
  { name: "Dec", mean: 0, std: 4.3 },
];
const OBS_PER_GROUP = 130;

// Fixed-seed LCG — the browser has no seeded RNG.
let seed = 42;
const rand = () => {
  seed = (seed * 1664525 + 1013904223) % 4294967296;
  return seed / 4294967296;
};
const randNormal = () => {
  const u1 = Math.max(rand(), 1e-12);
  const u2 = rand();
  return Math.sqrt(-2 * Math.log(u1)) * Math.cos(2 * Math.PI * u2);
};

const groupsRaw = MONTHS.map((m) => ({
  name: m.name,
  mean: m.mean,
  samples: Array.from({ length: OBS_PER_GROUP }, () => m.mean + m.std * randNormal()),
}));

// --- Kernel density estimation (Gaussian kernel, Silverman bandwidth) -------
const kde = (samples, xGrid, bandwidth) => {
  const norm = 1 / (samples.length * bandwidth * Math.sqrt(2 * Math.PI));
  return xGrid.map((xi) => {
    let sum = 0;
    for (const s of samples) {
      const u = (xi - s) / bandwidth;
      sum += Math.exp(-0.5 * u * u);
    }
    return sum * norm;
  });
};

const silvermanBandwidth = (samples) => {
  const n = samples.length;
  const mean = d3.mean(samples);
  const variance = d3.sum(samples, (v) => (v - mean) ** 2) / (n - 1);
  return 1.06 * Math.sqrt(variance) * n ** (-1 / 5);
};

const allSamples = groupsRaw.flatMap((g) => g.samples);
const xMin = d3.min(allSamples) - 4;
const xMax = d3.max(allSamples) + 4;
const GRID_POINTS = 160;
const xGrid = d3.range(GRID_POINTS).map((i) => xMin + (i / (GRID_POINTS - 1)) * (xMax - xMin));

const groups = groupsRaw.map((g) => {
  const bandwidth = silvermanBandwidth(g.samples);
  const density = kde(g.samples, xGrid, bandwidth);
  // Clip near-zero tails below 0.8% of this group's own peak so the Gaussian
  // KDE's asymptotic tails taper to a clean point instead of a flat sliver.
  const peak = d3.max(density);
  const clipped = density.map((d) => (d < peak * 0.008 ? 0 : d));
  return { name: g.name, mean: g.mean, density: clipped };
});
const globalMaxDensity = d3.max(groups, (g) => d3.max(g.density));

// --- Layout -------------------------------------------------------------------
const margin = { top: 100, right: 80, bottom: 90, left: 90 };
const iw = width - margin.left - margin.right;
const RIDGE_HEIGHT = 120; // px height of the tallest peak (60% row overlap)
const ROW_STEP = 48;
const baselineY = (i) => RIDGE_HEIGHT + i * ROW_STEP;
const axisY = baselineY(groups.length - 1) + 40;

// --- Scales ---------------------------------------------------------------
const x = d3.scaleLinear().domain([xMin, xMax]).range([0, iw]);
// imprint_seq is reserved for genuinely continuous data, so key the gradient
// to each group's mean temperature (a real continuous quantity) rather than
// its ordinal position — coldest month anchors to brand green, hottest to blue,
// making ridge color a redundant encoding of the same seasonal signal as the
// x-position of each hump.
const color = d3
  .scaleSequential(d3.interpolateRgbBasis(t.seq))
  .domain(d3.extent(groups, (g) => g.mean));

// --- SVG mount ----------------------------------------------------------------
const svg = d3.select("#container").append("svg").attr("width", width).attr("height", height);
const g = svg.append("g").attr("transform", `translate(${margin.left},${margin.top})`);

// --- Ridges (drawn back-to-front so lower ridges occlude the ones above) ----
const area = d3
  .area()
  .curve(d3.curveBasis)
  .x((d) => x(d.x))
  .y0((d) => d.baseline)
  .y1((d) => d.baseline - (d.density / globalMaxDensity) * RIDGE_HEIGHT);

groups.forEach((grp, i) => {
  const baseline = baselineY(i);
  const points = xGrid.map((xi, j) => ({ x: xi, density: grp.density[j], baseline }));
  g.append("path")
    .datum(points)
    .attr("d", area)
    .attr("fill", color(grp.mean))
    .attr("fill-opacity", 0.92)
    .attr("stroke", t.pageBg)
    .attr("stroke-width", 2);
});

// --- Group labels (y-axis shows group names, not numeric values) ------------
g.selectAll(".ridge-label")
  .data(groups)
  .join("text")
  .attr("class", "ridge-label")
  .attr("x", -14)
  .attr("y", (_, i) => baselineY(i))
  .attr("text-anchor", "end")
  .attr("dominant-baseline", "middle")
  .attr("fill", t.inkSoft)
  .style("font-size", "15px")
  .text((d) => d.name);

// --- X axis -------------------------------------------------------------------
const xAxis = g.append("g").attr("transform", `translate(0,${axisY})`).call(d3.axisBottom(x).ticks(7));
xAxis.selectAll("text").attr("fill", t.inkSoft).style("font-size", "14px");
xAxis.selectAll("line").attr("stroke", t.grid);
xAxis.select(".domain").attr("stroke", t.inkSoft);

g.append("text")
  .attr("x", iw / 2)
  .attr("y", axisY + 46)
  .attr("text-anchor", "middle")
  .attr("fill", t.inkSoft)
  .style("font-size", "16px")
  .text("Average Daily Temperature (°C)");

// --- Title ----------------------------------------------------------------
svg
  .append("text")
  .attr("x", width / 2)
  .attr("y", 50)
  .attr("text-anchor", "middle")
  .attr("fill", t.ink)
  .style("font-size", "22px")
  .style("font-weight", "600")
  .text("ridgeline-basic · javascript · d3 · anyplot.ai");
Runnable source as JSON, for any HTTP client: https://api.anyplot.ai/specs/ridgeline-basic/d3/code. Any spec id and library id listed in llms-full.txt fit the same URL shape; every URL below is complete and callable.
{
  "spec_id": "ridgeline-basic",
  "language": "javascript",
  "library": "d3",
  "page": "https://anyplot.ai/ridgeline-basic/javascript/d3",
  "hub": "https://anyplot.ai/ridgeline-basic",
  "code_json": "https://api.anyplot.ai/specs/ridgeline-basic/d3/code",
  "spec_json": "https://api.anyplot.ai/specs/ridgeline-basic",
  "render_light_png": "https://storage.googleapis.com/anyplot-images/plots/ridgeline-basic/javascript/d3/plot-light.png",
  "render_dark_png": "https://storage.googleapis.com/anyplot-images/plots/ridgeline-basic/javascript/d3/plot-dark.png",
  "interactive_light_html": "https://storage.googleapis.com/anyplot-images/plots/ridgeline-basic/javascript/d3/plot-light.html",
  "interactive_dark_html": "https://storage.googleapis.com/anyplot-images/plots/ridgeline-basic/javascript/d3/plot-dark.html",
  "quality_score": 91.0,
  "license": "MIT",
  "guide": "https://anyplot.ai/llms.txt"
}
Part of Basic Ridgeline Plot on anyplot.ai.