The same plot in 14 other libraries — JavaScript: D3.js, Apache ECharts, Highcharts, MUI X Charts; Python: Altair, Bokeh, lets-plot, Matplotlib, Plotly, plotnine, Pygal, Seaborn; R: ggplot2; Julia: Makie.jl. Compare all 15 side by side: Basic Ridgeline Plot in Python, R, Julia and JavaScript.
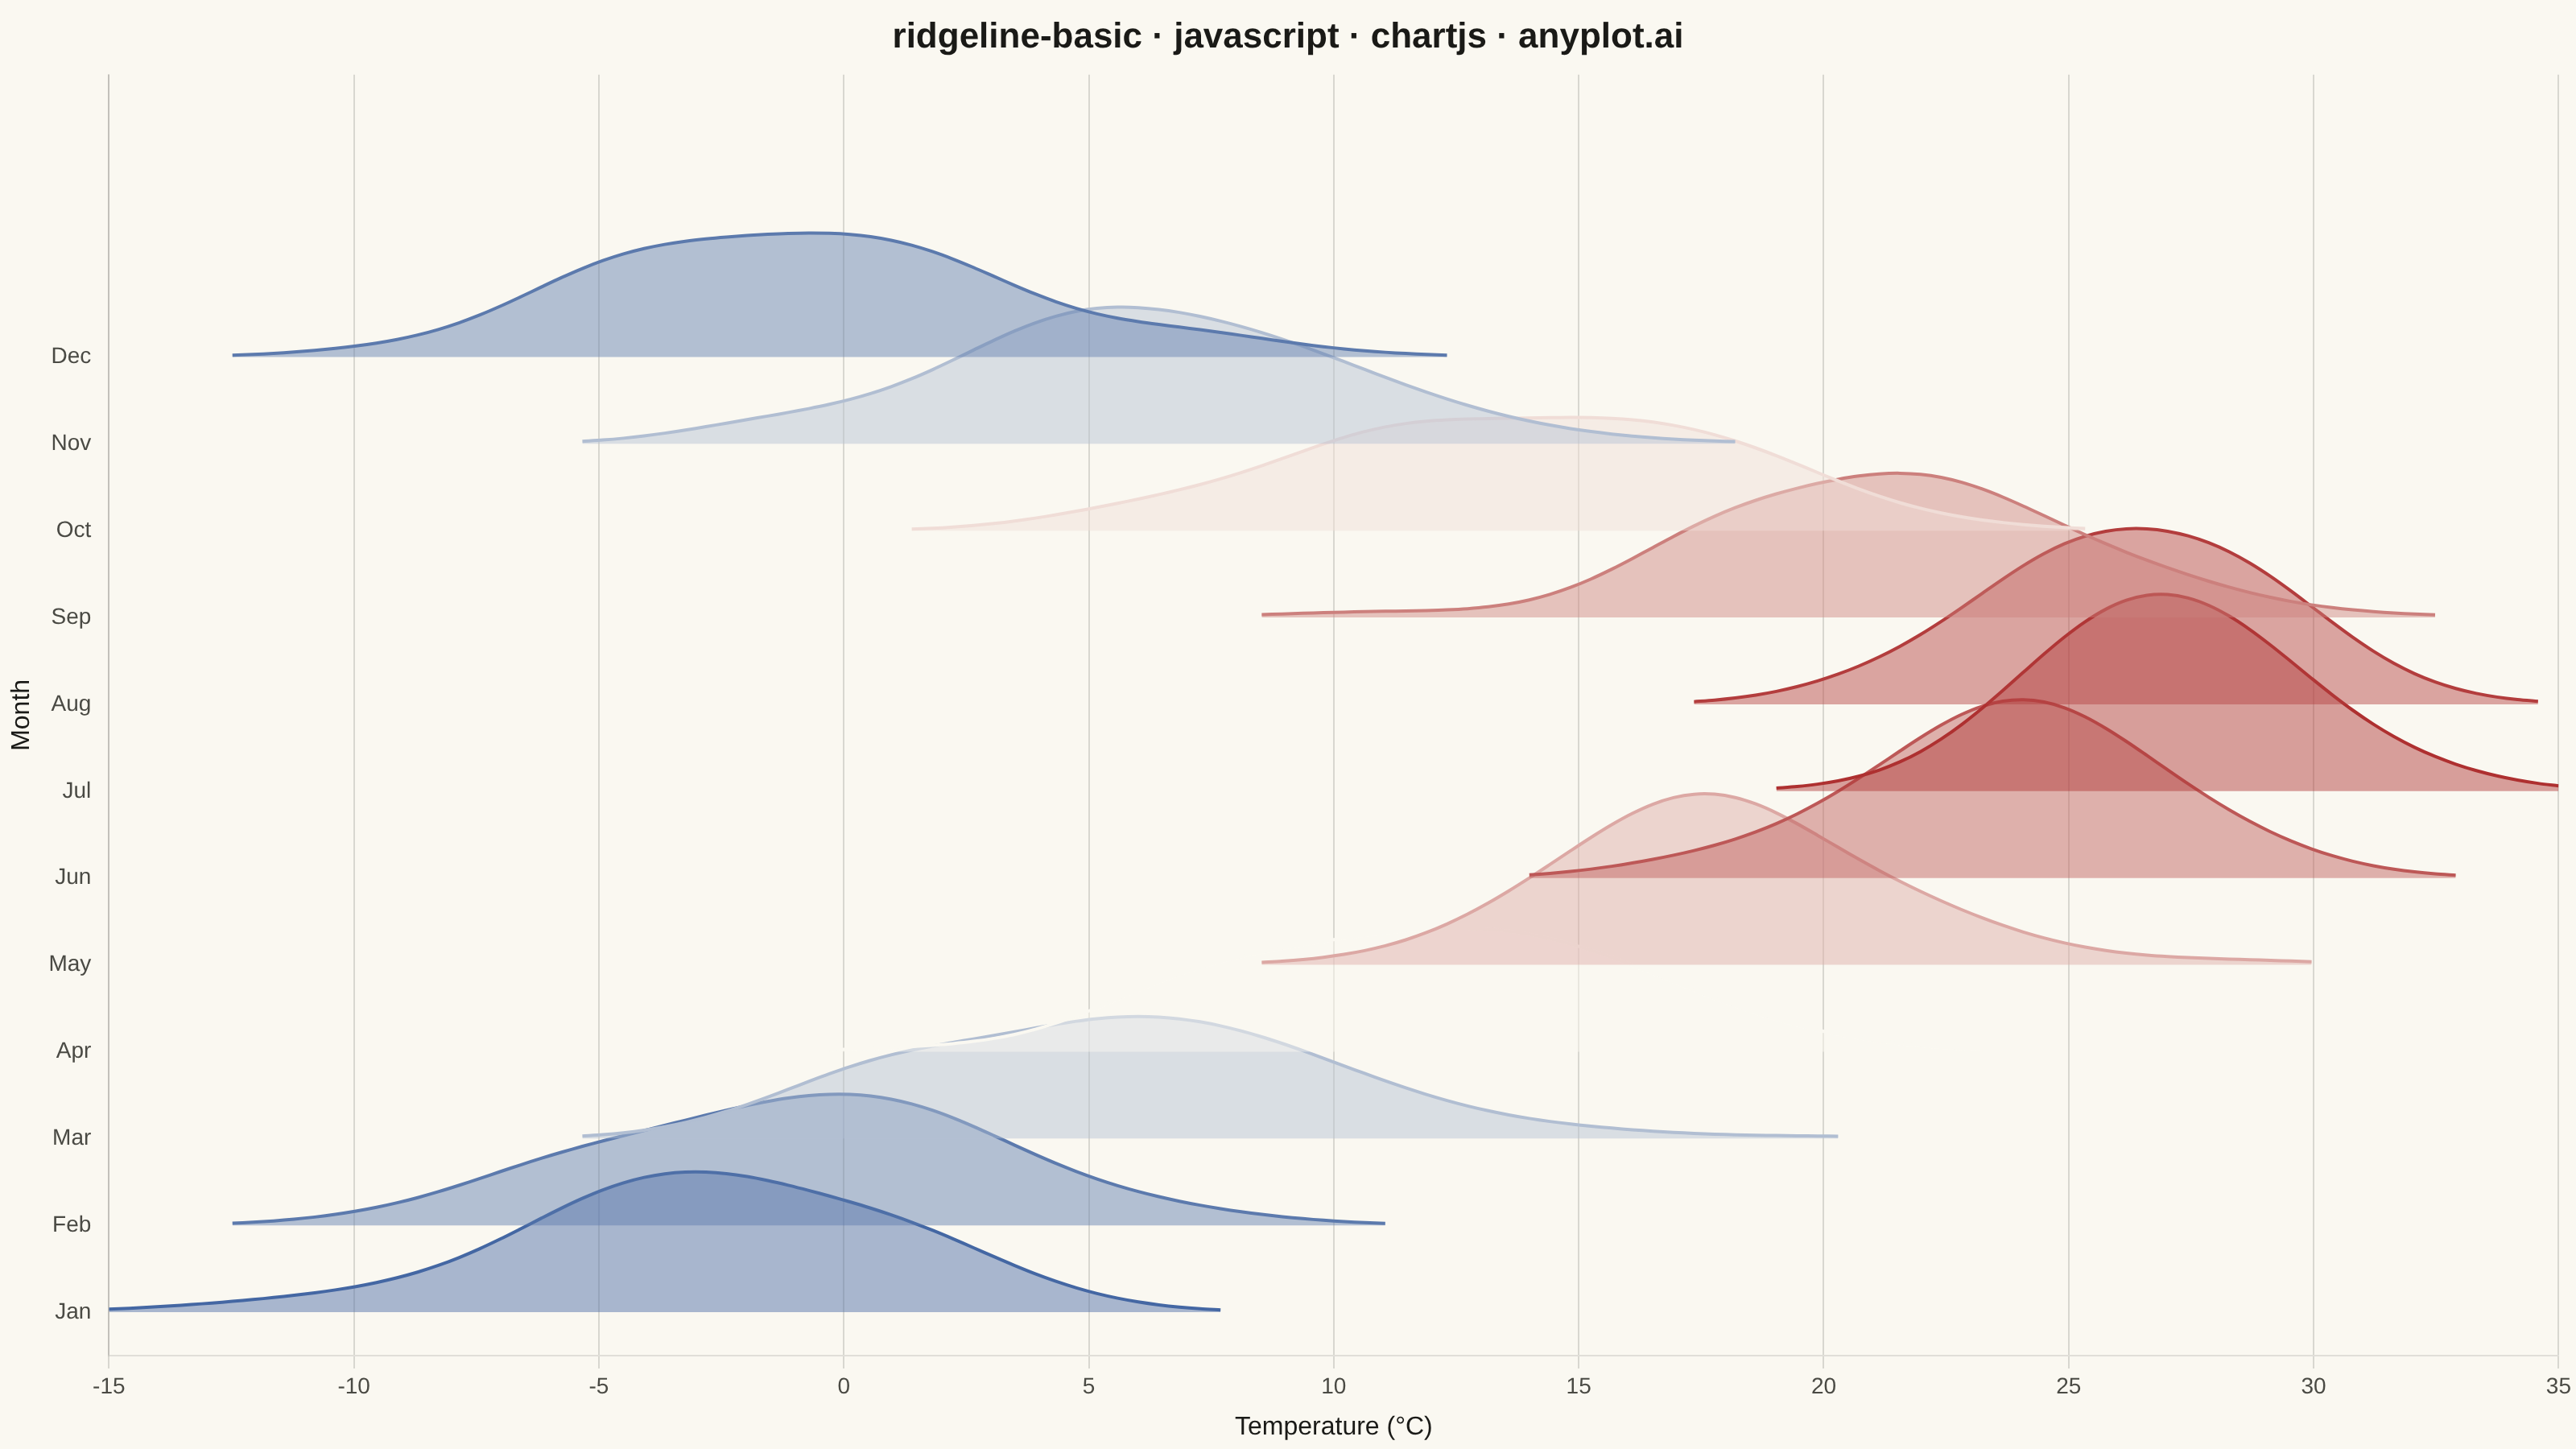
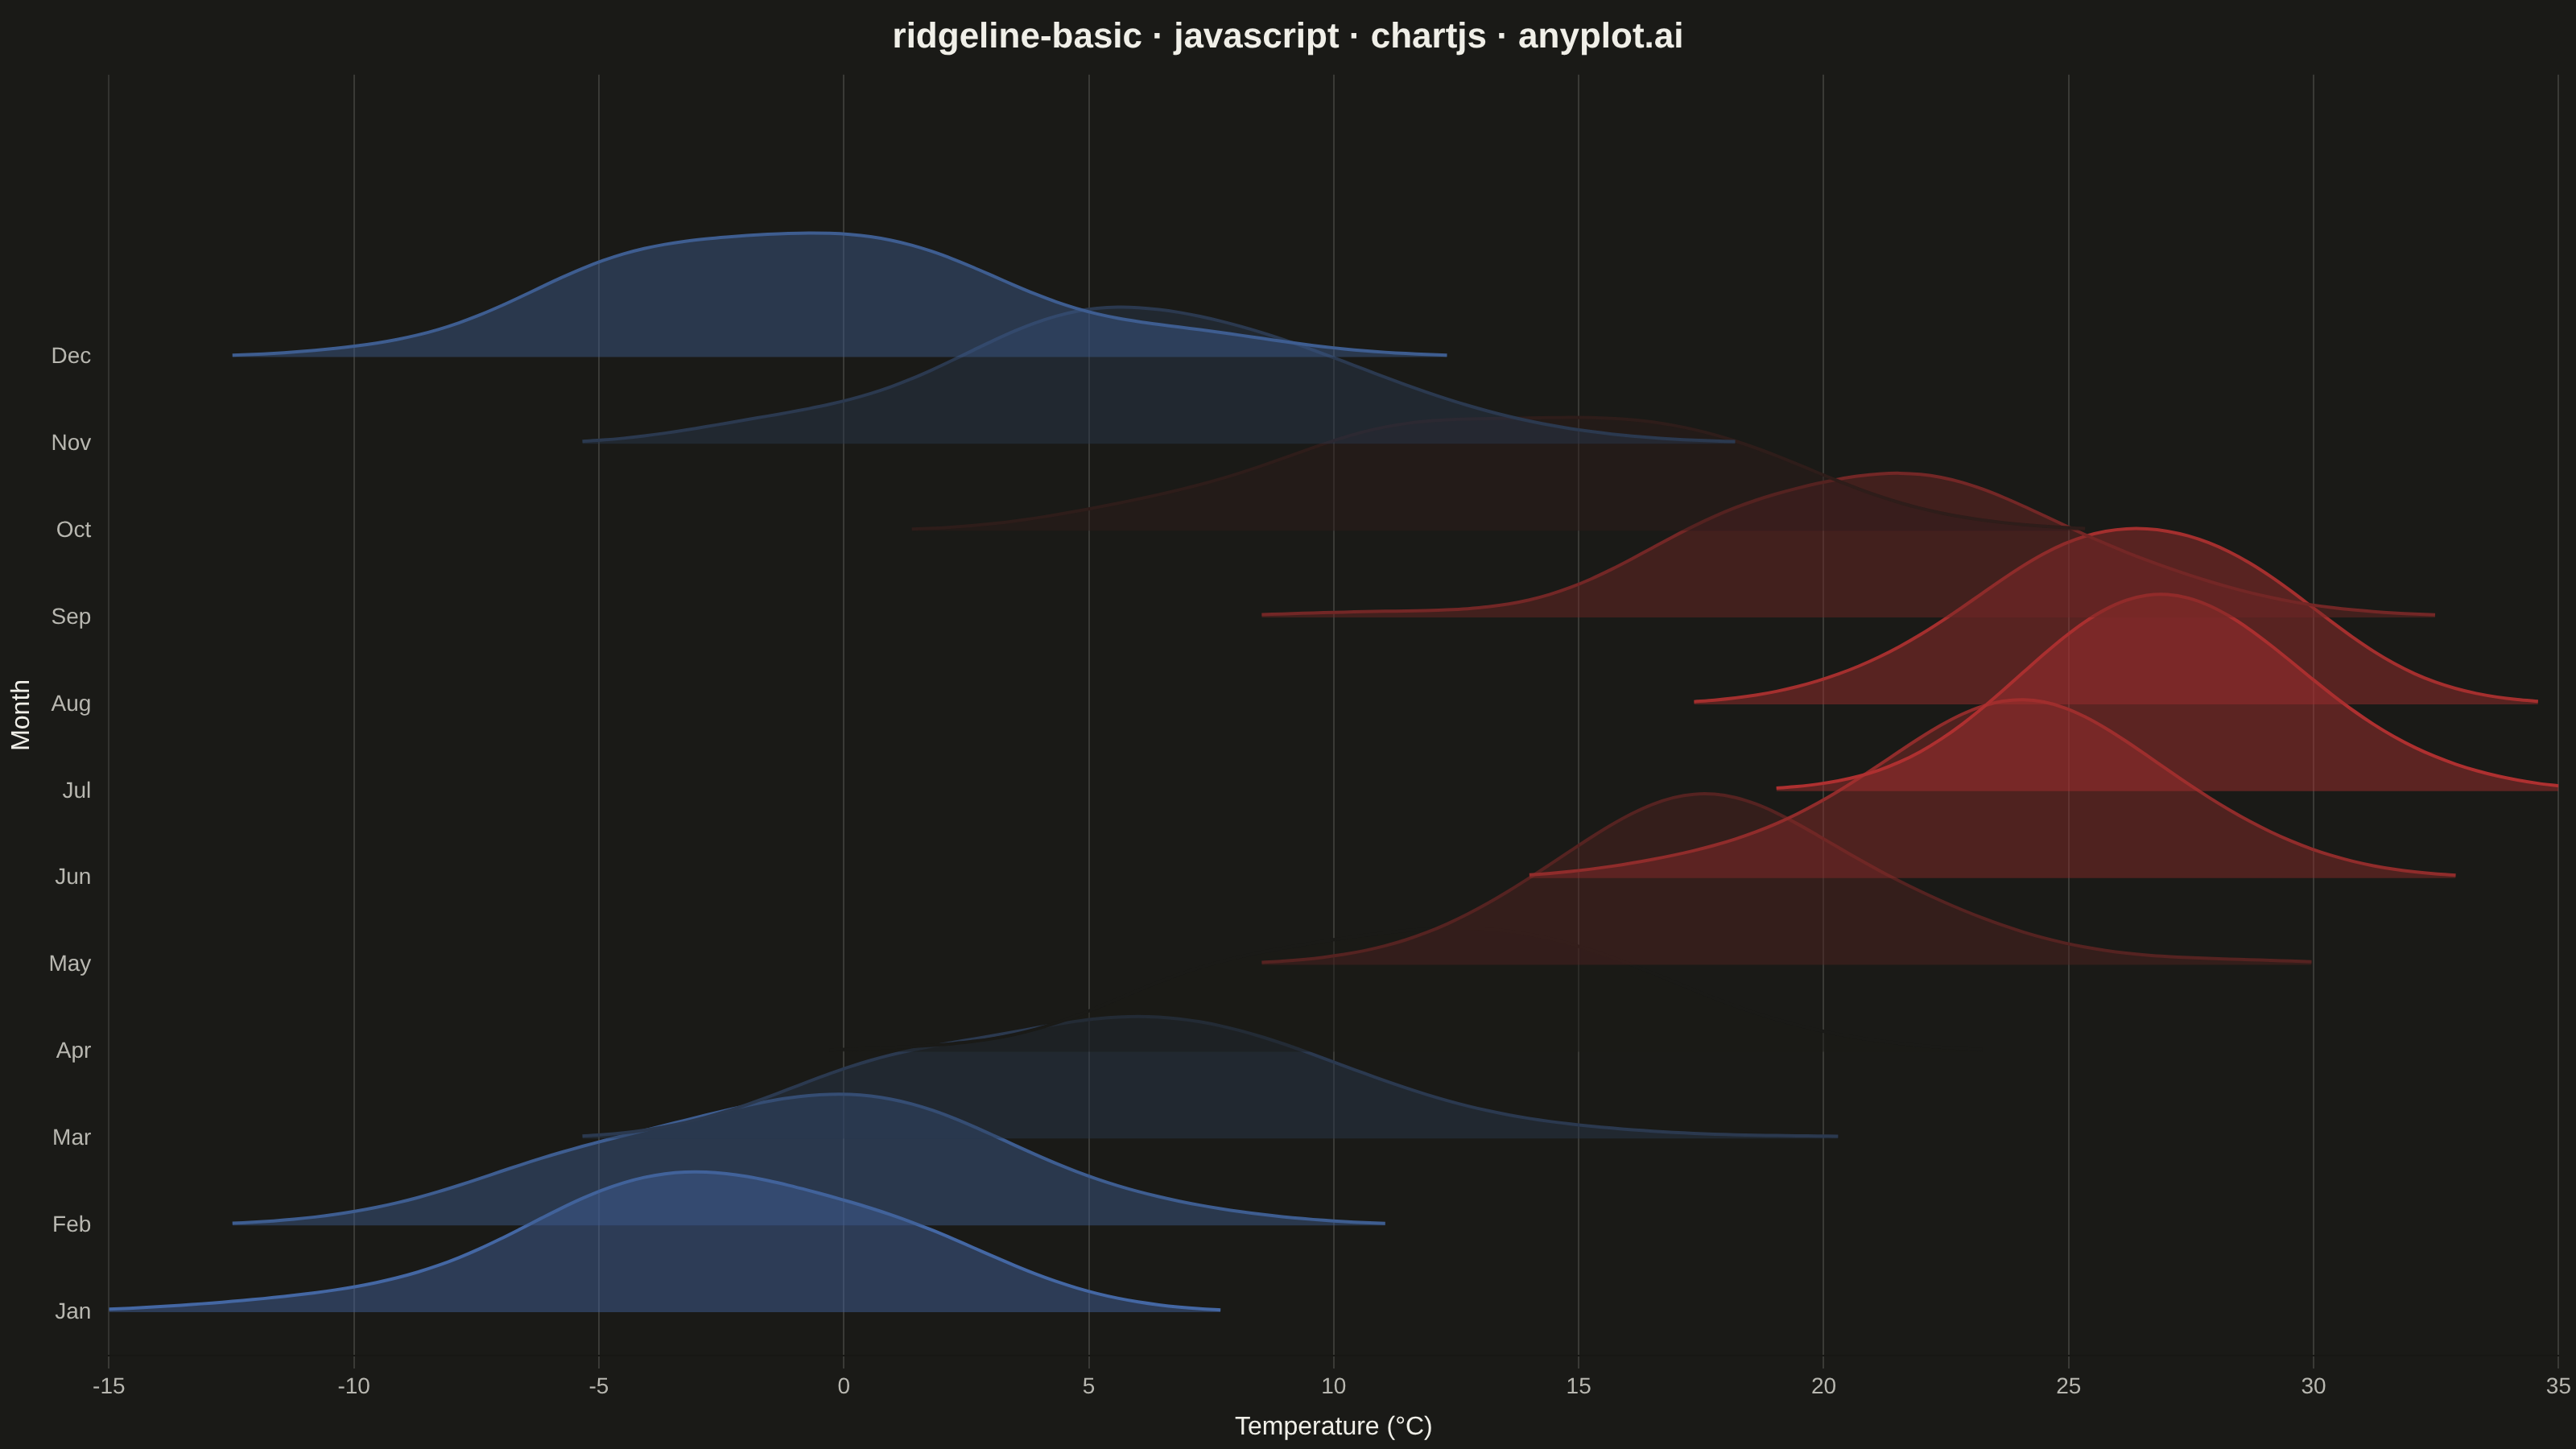
A ridgeline plot (also known as Joy Plot, named after the Joy Division album cover) displays the distribution of multiple groups by stacking partially overlapping density curves vertically. This creates a mountain ridge appearance that allows efficient comparison of many distributions simultaneously while maintaining a compact and visually striking presentation.
// anyplot.ai
// ridgeline-basic: Basic Ridgeline Plot
// Library: chartjs 4.4.7 | JavaScript 22.23.1
// Quality: 88/100 | Created: 2026-07-25

const t = window.ANYPLOT_TOKENS;

// --- Data: monthly high-temperature distributions (deterministic LCG) ------
const MONTHS = [
  { name: "Jan", mean: -3, std: 4.0 },
  { name: "Feb", mean: -1, std: 4.0 },
  { name: "Mar", mean: 6, std: 4.0 },
  { name: "Apr", mean: 12, std: 4.0 },
  { name: "May", mean: 18, std: 3.5 },
  { name: "Jun", mean: 24, std: 3.0 },
  { name: "Jul", mean: 27, std: 2.5 },
  { name: "Aug", mean: 26, std: 2.5 },
  { name: "Sep", mean: 21, std: 3.5 },
  { name: "Oct", mean: 14, std: 4.0 },
  { name: "Nov", mean: 6, std: 4.0 },
  { name: "Dec", mean: -1, std: 4.0 },
];
const SAMPLES_PER_MONTH = 150;

let lcgSeed = 42;
function lcgUniform() {
  lcgSeed = (lcgSeed * 1664525 + 1013904223) % 4294967296;
  return lcgSeed / 4294967296;
}
function lcgGaussian(mean, std) {
  const u1 = Math.max(lcgUniform(), 1e-9);
  const u2 = lcgUniform();
  const z0 = Math.sqrt(-2 * Math.log(u1)) * Math.cos(2 * Math.PI * u2);
  return mean + z0 * std;
}

const monthSamples = MONTHS.map((m) =>
  Array.from({ length: SAMPLES_PER_MONTH }, () => lcgGaussian(m.mean, m.std)),
);

// --- Kernel density estimation over a shared temperature grid --------------
const X_MIN = -15;
const X_MAX = 35;
const GRID_POINTS = 120;
const BANDWIDTH = 1.8;
const xGrid = Array.from(
  { length: GRID_POINTS },
  (_, i) => X_MIN + (i * (X_MAX - X_MIN)) / (GRID_POINTS - 1),
);

function kde(samples, bandwidth) {
  const norm = 1 / (samples.length * bandwidth * Math.sqrt(2 * Math.PI));
  return xGrid.map((x) => {
    let sum = 0;
    for (const s of samples) {
      const u = (x - s) / bandwidth;
      sum += Math.exp(-0.5 * u * u);
    }
    return sum * norm;
  });
}

const monthDensities = monthSamples.map((samples) => kde(samples, BANDWIDTH));

// Clip each ridge to where its density is non-negligible so flat
// near-zero-density tails don't run across the full canvas width.
function clipToSignificant(x, density, threshold) {
  let lo = 0;
  let hi = density.length - 1;
  while (lo < hi && density[lo] < threshold) lo++;
  while (hi > lo && density[hi] < threshold) hi--;
  lo = Math.max(0, lo - 1);
  hi = Math.min(density.length - 1, hi + 1);
  return { x: x.slice(lo, hi + 1), density: density.slice(lo, hi + 1) };
}
const monthCurves = monthDensities.map((density) =>
  clipToSignificant(xGrid, density, Math.max(...density) * 0.02),
);

// --- Layout: stack ridges bottom (Jan) to top (Dec), ~55% overlap ----------
const SPACING = 40;
const HEIGHT_SCALE = 650;

// --- Color: diverging imprint colormap keyed to mean temperature -----------
// (domain convention: hot -> red, cold -> blue; see default-style-guide.md
// "Semantic exception")
function hexToRgb(hex) {
  const n = parseInt(hex.slice(1), 16);
  return [(n >> 16) & 255, (n >> 8) & 255, n & 255];
}
function lerpRgb(hexA, hexB, f) {
  const a = hexToRgb(hexA);
  const b = hexToRgb(hexB);
  return a.map((v, i) => Math.round(v + (b[i] - v) * f));
}
function divergingColor(mean, centerTemp, halfRange, alpha) {
  const norm = Math.max(-1, Math.min(1, (mean - centerTemp) / halfRange));
  const [hot, mid, cold] = t.div; // t.div = [red, midpoint, blue]
  const target = norm >= 0 ? hot : cold;
  const rgb = lerpRgb(mid, target, Math.abs(norm));
  return `rgba(${rgb.join(",")},${alpha})`;
}
const meanTemps = MONTHS.map((m) => m.mean);
const centerTemp = (Math.min(...meanTemps) + Math.max(...meanTemps)) / 2;
const halfRange = (Math.max(...meanTemps) - Math.min(...meanTemps)) / 2;

// --- Mount -------------------------------------------------------------
const canvas = document.createElement("canvas");
document.getElementById("container").appendChild(canvas);

// --- Chart: ridges built from filled line datasets, one per month ---------
const numMonths = MONTHS.length;
const datasets = MONTHS.map((month, i) => {
  const baseline = i * SPACING;
  const borderColor = divergingColor(month.mean, centerTemp, halfRange, 1);
  const fillColor = divergingColor(month.mean, centerTemp, halfRange, 0.45);
  const { x: curveX, density: curveDensity } = monthCurves[i];
  return {
    label: month.name,
    data: curveX.map((x, j) => ({
      x,
      y: baseline + curveDensity[j] * HEIGHT_SCALE,
    })),
    borderColor,
    backgroundColor: fillColor,
    fill: { target: { value: baseline } },
    borderWidth: 2,
    pointRadius: 0,
    tension: 0.3,
    // Lower months are drawn last so they sit in front of the ridge above,
    // producing the mountain-range overlap.
    order: numMonths - i,
  };
});

new Chart(canvas, {
  type: "line",
  data: { datasets },
  options: {
    responsive: true,
    maintainAspectRatio: false,
    animation: false,
    plugins: {
      title: {
        display: true,
        text: "ridgeline-basic · javascript · chartjs · anyplot.ai",
        color: t.ink,
        font: { size: 22 },
      },
      legend: { display: false },
    },
    scales: {
      x: {
        type: "linear",
        min: X_MIN,
        max: X_MAX,
        title: { display: true, text: "Temperature (°C)", color: t.ink, font: { size: 16 } },
        ticks: { color: t.inkSoft, font: { size: 14 } },
        grid: { color: t.grid },
      },
      y: {
        min: -20,
        max: (numMonths - 1) * SPACING + 130,
        afterBuildTicks: (scale) => {
          scale.ticks = MONTHS.map((_, i) => ({ value: i * SPACING }));
        },
        ticks: {
          color: t.inkSoft,
          font: { size: 14 },
          callback: (value) => MONTHS[value / SPACING]?.name ?? "",
        },
        title: { display: true, text: "Month", color: t.ink, font: { size: 16 } },
        grid: { display: false },
      },
    },
  },
});
Runnable source as JSON, for any HTTP client: https://api.anyplot.ai/specs/ridgeline-basic/chartjs/code. Any spec id and library id listed in llms-full.txt fit the same URL shape; every URL below is complete and callable.
{
  "spec_id": "ridgeline-basic",
  "language": "javascript",
  "library": "chartjs",
  "page": "https://anyplot.ai/ridgeline-basic/javascript/chartjs",
  "hub": "https://anyplot.ai/ridgeline-basic",
  "code_json": "https://api.anyplot.ai/specs/ridgeline-basic/chartjs/code",
  "spec_json": "https://api.anyplot.ai/specs/ridgeline-basic",
  "render_light_png": "https://storage.googleapis.com/anyplot-images/plots/ridgeline-basic/javascript/chartjs/plot-light.png",
  "render_dark_png": "https://storage.googleapis.com/anyplot-images/plots/ridgeline-basic/javascript/chartjs/plot-dark.png",
  "interactive_light_html": "https://storage.googleapis.com/anyplot-images/plots/ridgeline-basic/javascript/chartjs/plot-light.html",
  "interactive_dark_html": "https://storage.googleapis.com/anyplot-images/plots/ridgeline-basic/javascript/chartjs/plot-dark.html",
  "quality_score": 88.0,
  "license": "MIT",
  "guide": "https://anyplot.ai/llms.txt"
}
Part of Basic Ridgeline Plot on anyplot.ai.