The same plot in 14 other libraries — JavaScript: Chart.js, D3.js, Apache ECharts, MUI X Charts; Python: Altair, Bokeh, lets-plot, Matplotlib, Plotly, plotnine, Pygal, Seaborn; R: ggplot2; Julia: Makie.jl. Compare all 15 side by side: Basic Ridgeline Plot in Python, R, Julia and JavaScript.
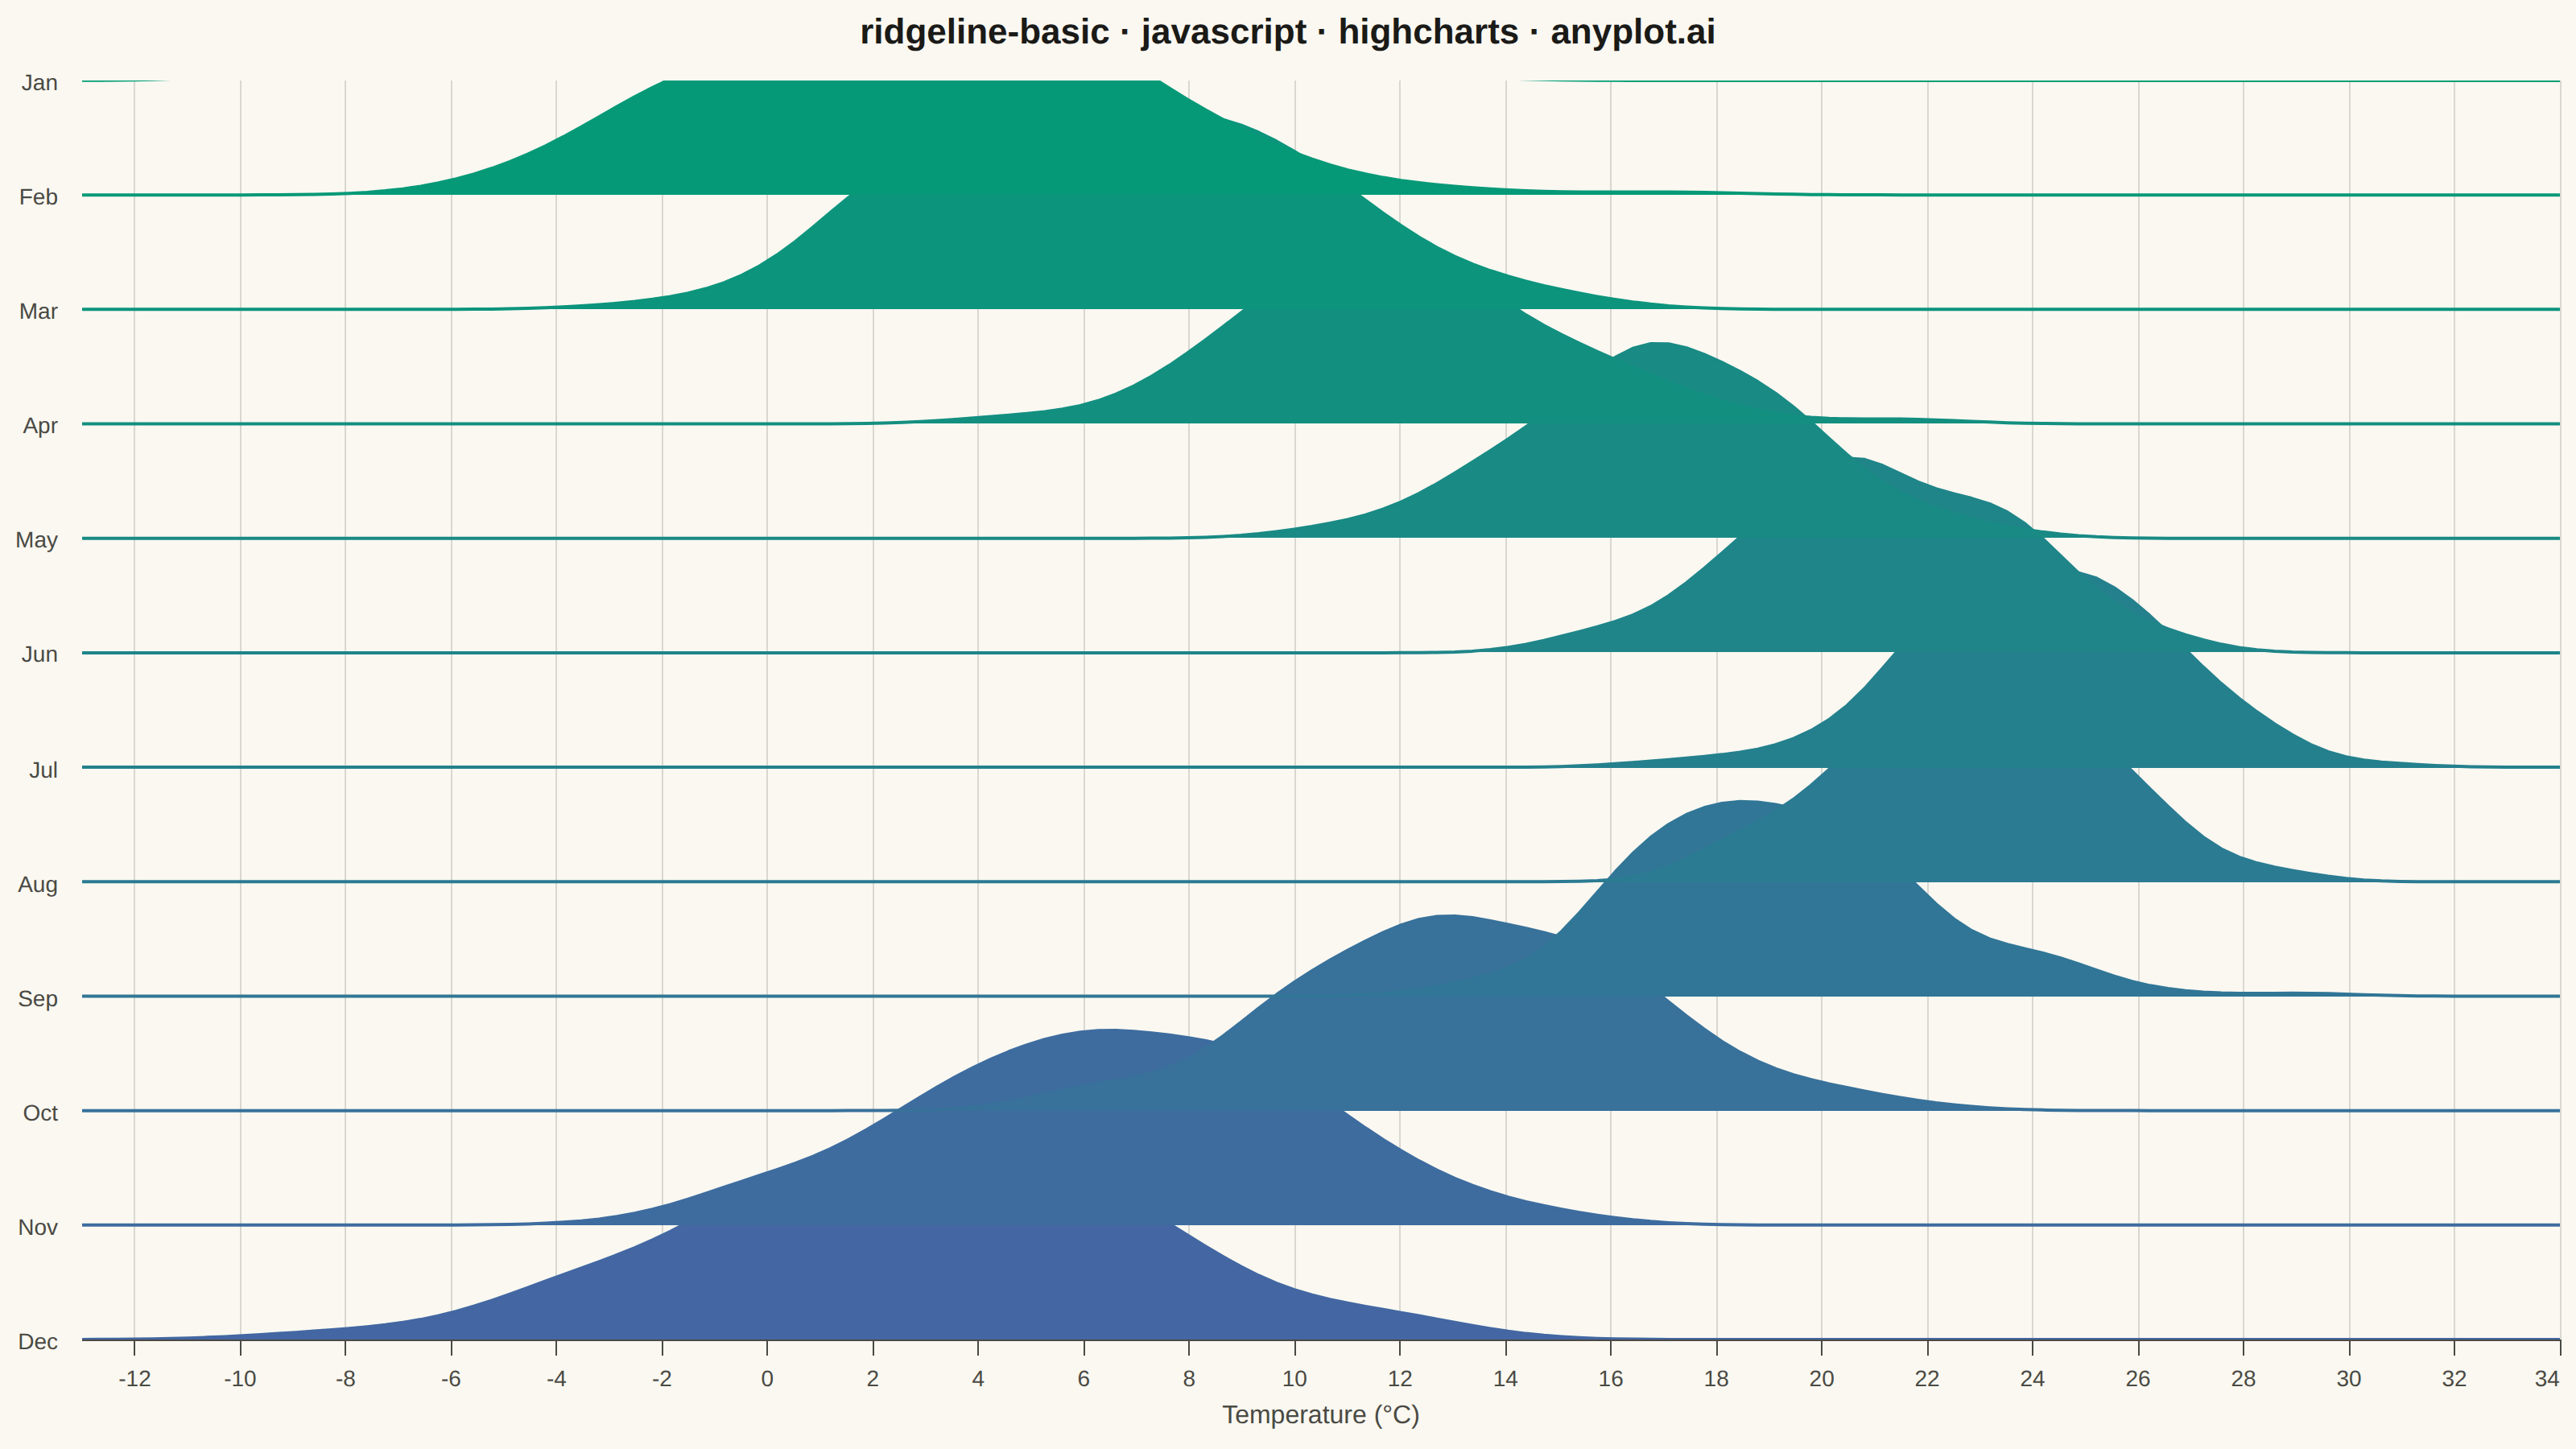
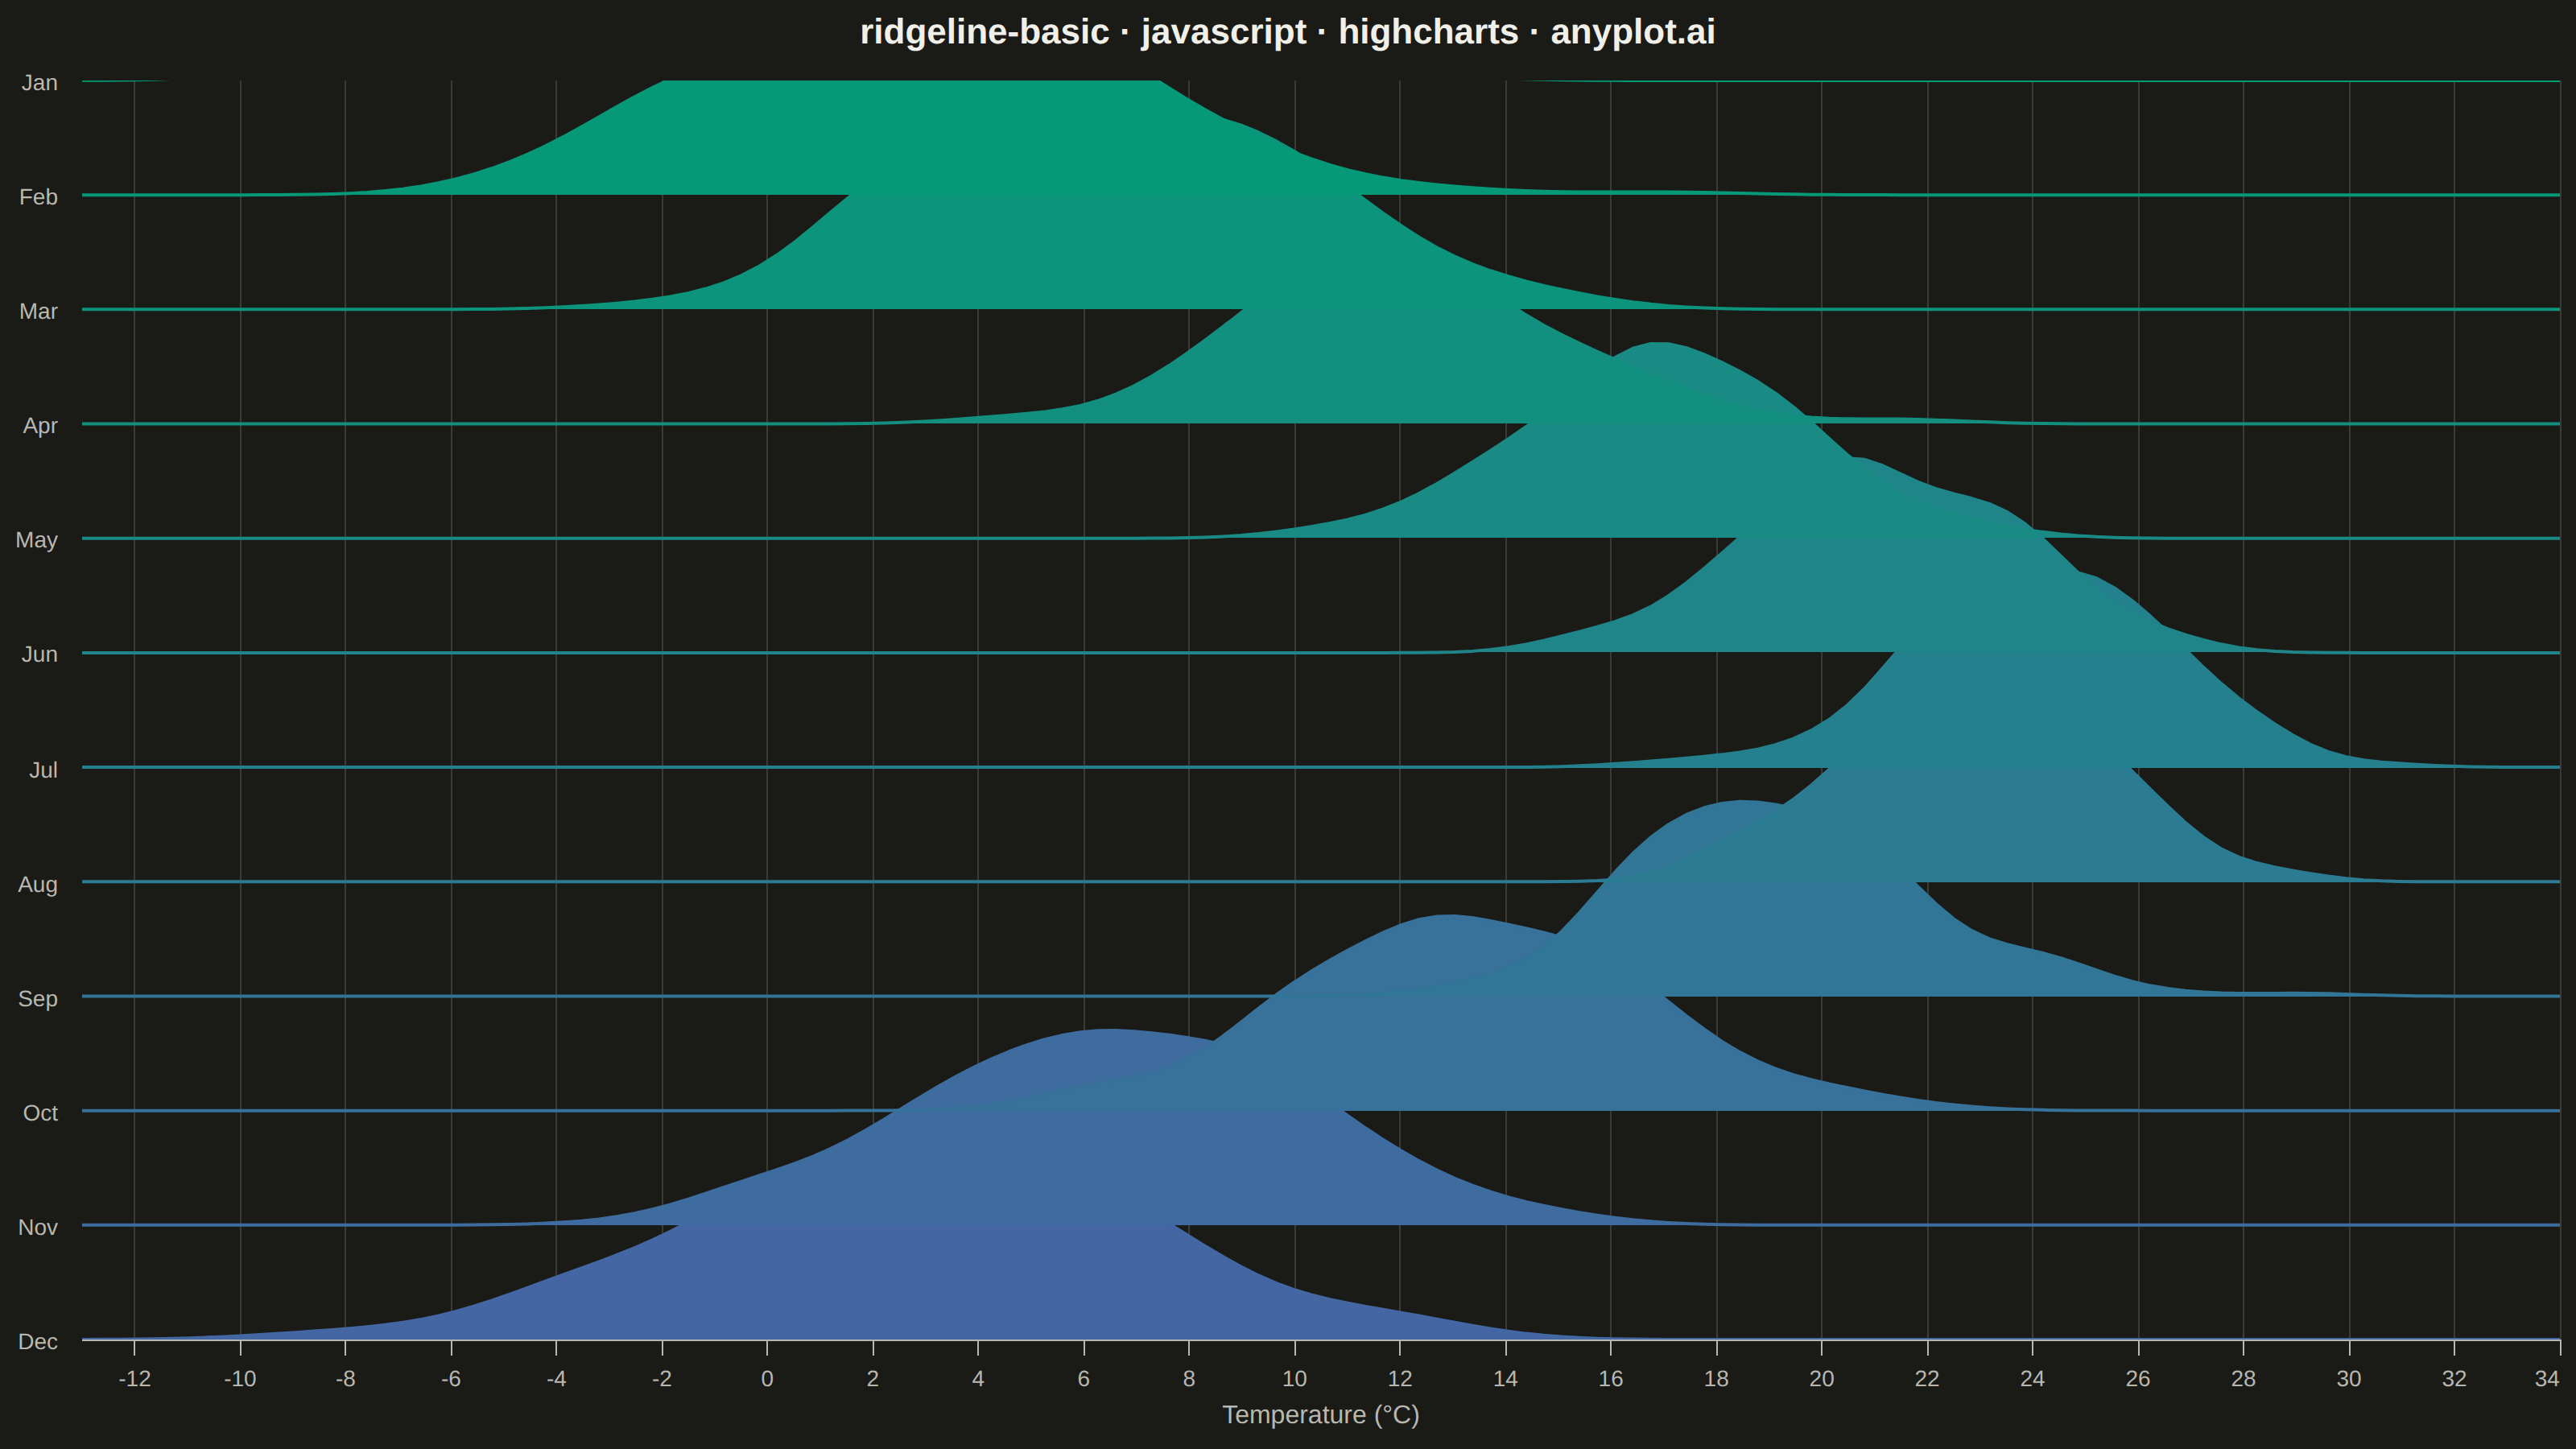
A ridgeline plot (also known as Joy Plot, named after the Joy Division album cover) displays the distribution of multiple groups by stacking partially overlapping density curves vertically. This creates a mountain ridge appearance that allows efficient comparison of many distributions simultaneously while maintaining a compact and visually striking presentation.
// anyplot.ai
// ridgeline-basic: Basic Ridgeline Plot
// Library: highcharts 12.6.0 | JavaScript 22.23.1
// Quality: 91/100 | Created: 2026-07-25

//# anyplot-orientation: landscape
const t = window.ANYPLOT_TOKENS;

// --- Data: monthly temperature distributions (seasonal pattern) ------------
// deterministic LCG (Numerical Recipes constants) — no seeded RNG in the browser
let seed = 42;
function nextUniform() {
  seed = (seed * 1664525 + 1013904223) % 4294967296;
  return seed / 4294967296;
}
function nextNormal() {
  const u1 = Math.max(nextUniform(), 1e-9);
  const u2 = nextUniform();
  return Math.sqrt(-2 * Math.log(u1)) * Math.cos(2 * Math.PI * u2);
}

const months = ["Jan", "Feb", "Mar", "Apr", "May", "Jun",
                "Jul", "Aug", "Sep", "Oct", "Nov", "Dec"];
const monthlyMeanC = [2, 3, 7, 12, 17, 21, 24, 23, 19, 13, 7, 3];
const monthlyStdC  = [4.2, 4.0, 3.6, 3.2, 2.8, 2.5, 2.3, 2.4, 2.7, 3.1, 3.6, 4.1];
const samplesPerMonth = 200;

const monthlySamples = months.map((_, i) =>
  Array.from({ length: samplesPerMonth },
    () => monthlyMeanC[i] + monthlyStdC[i] * nextNormal())
);

// --- Gaussian KDE, evaluated on a shared temperature grid -------------------
function gaussianKDE(samples, xGrid, bandwidth) {
  const norm = 1 / (samples.length * bandwidth * Math.sqrt(2 * Math.PI));
  return xGrid.map((x) => {
    let sum = 0;
    for (const s of samples) {
      const z = (x - s) / bandwidth;
      sum += Math.exp(-0.5 * z * z);
    }
    return sum * norm;
  });
}

const allSamples = monthlySamples.flat();
const xMin = Math.floor(Math.min(...allSamples) - 3);
const xMax = Math.ceil(Math.max(...allSamples) + 3);
const gridPoints = 140;
const xGrid = Array.from({ length: gridPoints },
  (_, i) => xMin + (i / (gridPoints - 1)) * (xMax - xMin));

// Silverman's rule of thumb per group keeps each ridge appropriately smooth
const bandwidths = monthlyStdC.map((std) => 1.06 * std * Math.pow(samplesPerMonth, -0.2));

// --- Stack ridges: one baseline offset per month, peaks scaled to overlap --
const rowStep = 1;
const ridgeHeight = 1.7; // ~65-70% overlap into the row(s) above
const offsets = months.map((_, i) => i * rowStep);

const ridgeColorFrom = Highcharts.color(t.seq[0]);
const ridgeColors = months.map((_, i) =>
  ridgeColorFrom.tweenTo(Highcharts.color(t.seq[1]), i / (months.length - 1))
);

const series = months.map((month, i) => {
  const density = gaussianKDE(monthlySamples[i], xGrid, bandwidths[i]);
  const peak = Math.max(...density);
  const offset = offsets[i];
  return {
    name: month,
    color: ridgeColors[i],
    fillColor: ridgeColors[i],
    fillOpacity: 0.92,
    lineWidth: 2,
    threshold: offset,
    data: xGrid.map((x, j) => [x, offset - (density[j] / peak) * ridgeHeight]),
  };
});

// Render back-to-front (Dec first, Jan last) so each ridge's peak tucks
// behind the ridge in the row above it, matching top-down chronological order.
const orderedSeries = series.slice().reverse();

// --- Chart -------------------------------------------------------------------
Highcharts.chart("container", {
  chart: {
    type: "area",
    backgroundColor: "transparent",
    animation: false,
    style: { fontFamily: "inherit" },
  },
  credits: { enabled: false },
  title: {
    text: "ridgeline-basic · javascript · highcharts · anyplot.ai",
    style: { color: t.ink, fontSize: "22px", fontWeight: "600" },
  },
  xAxis: {
    title: { text: "Temperature (°C)", style: { color: t.inkSoft, fontSize: "16px" } },
    min: xMin,
    max: xMax,
    lineColor: t.inkSoft,
    tickColor: t.inkSoft,
    gridLineColor: t.grid,
    gridLineWidth: 1,
    labels: { style: { color: t.inkSoft, fontSize: "14px" } },
  },
  yAxis: {
    title: { text: null },
    reversed: true,
    min: -ridgeHeight,
    max: offsets[offsets.length - 1] + rowStep,
    tickPositions: offsets,
    gridLineWidth: 0,
    lineWidth: 0,
    labels: {
      style: { color: t.inkSoft, fontSize: "14px" },
      formatter() {
        return months[Math.round(this.value / rowStep)];
      },
    },
  },
  legend: { enabled: false },
  plotOptions: {
    series: {
      animation: false,
      marker: { enabled: false, states: { hover: { enabled: false } } },
      enableMouseTracking: false,
    },
    area: { threshold: undefined },
  },
  series: orderedSeries,
});
Runnable source as JSON, for any HTTP client: https://api.anyplot.ai/specs/ridgeline-basic/highcharts/code. Any spec id and library id listed in llms-full.txt fit the same URL shape; every URL below is complete and callable.
{
  "spec_id": "ridgeline-basic",
  "language": "javascript",
  "library": "highcharts",
  "page": "https://anyplot.ai/ridgeline-basic/javascript/highcharts",
  "hub": "https://anyplot.ai/ridgeline-basic",
  "code_json": "https://api.anyplot.ai/specs/ridgeline-basic/highcharts/code",
  "spec_json": "https://api.anyplot.ai/specs/ridgeline-basic",
  "render_light_png": "https://storage.googleapis.com/anyplot-images/plots/ridgeline-basic/javascript/highcharts/plot-light.png",
  "render_dark_png": "https://storage.googleapis.com/anyplot-images/plots/ridgeline-basic/javascript/highcharts/plot-dark.png",
  "interactive_light_html": "https://storage.googleapis.com/anyplot-images/plots/ridgeline-basic/javascript/highcharts/plot-light.html",
  "interactive_dark_html": "https://storage.googleapis.com/anyplot-images/plots/ridgeline-basic/javascript/highcharts/plot-dark.html",
  "quality_score": 91.0,
  "license": "MIT",
  "guide": "https://anyplot.ai/llms.txt"
}
Part of Basic Ridgeline Plot on anyplot.ai.