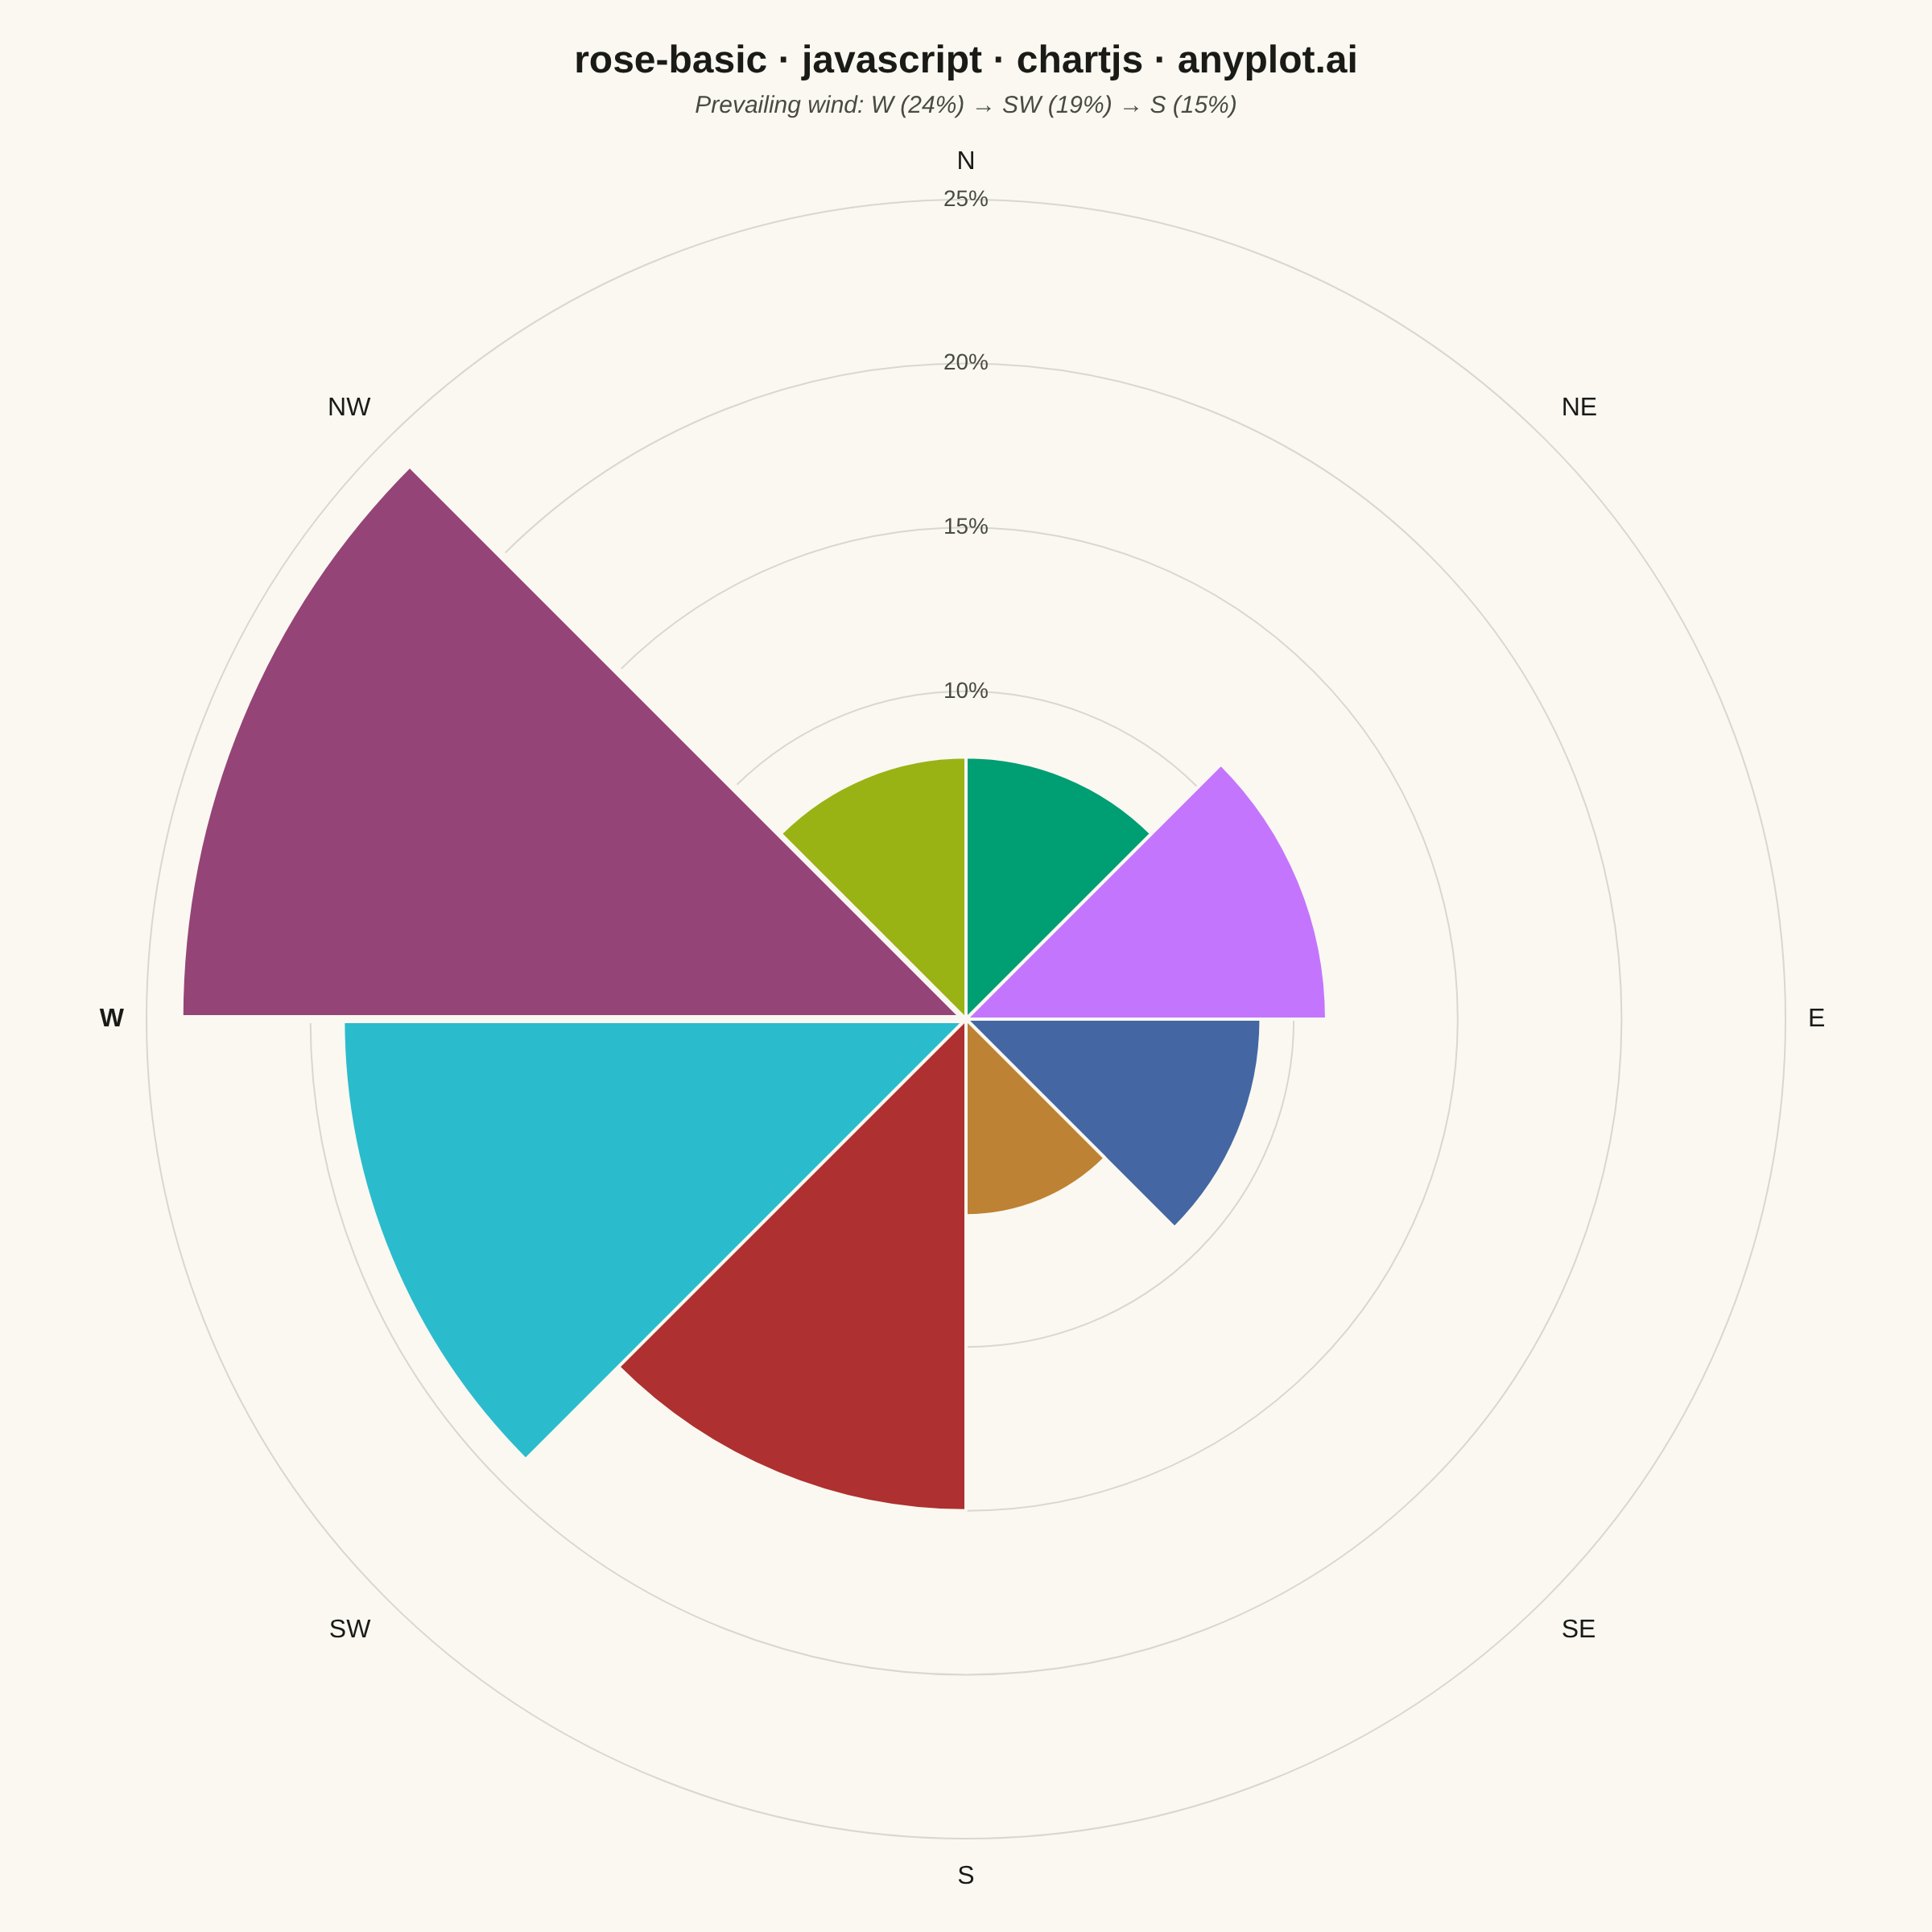
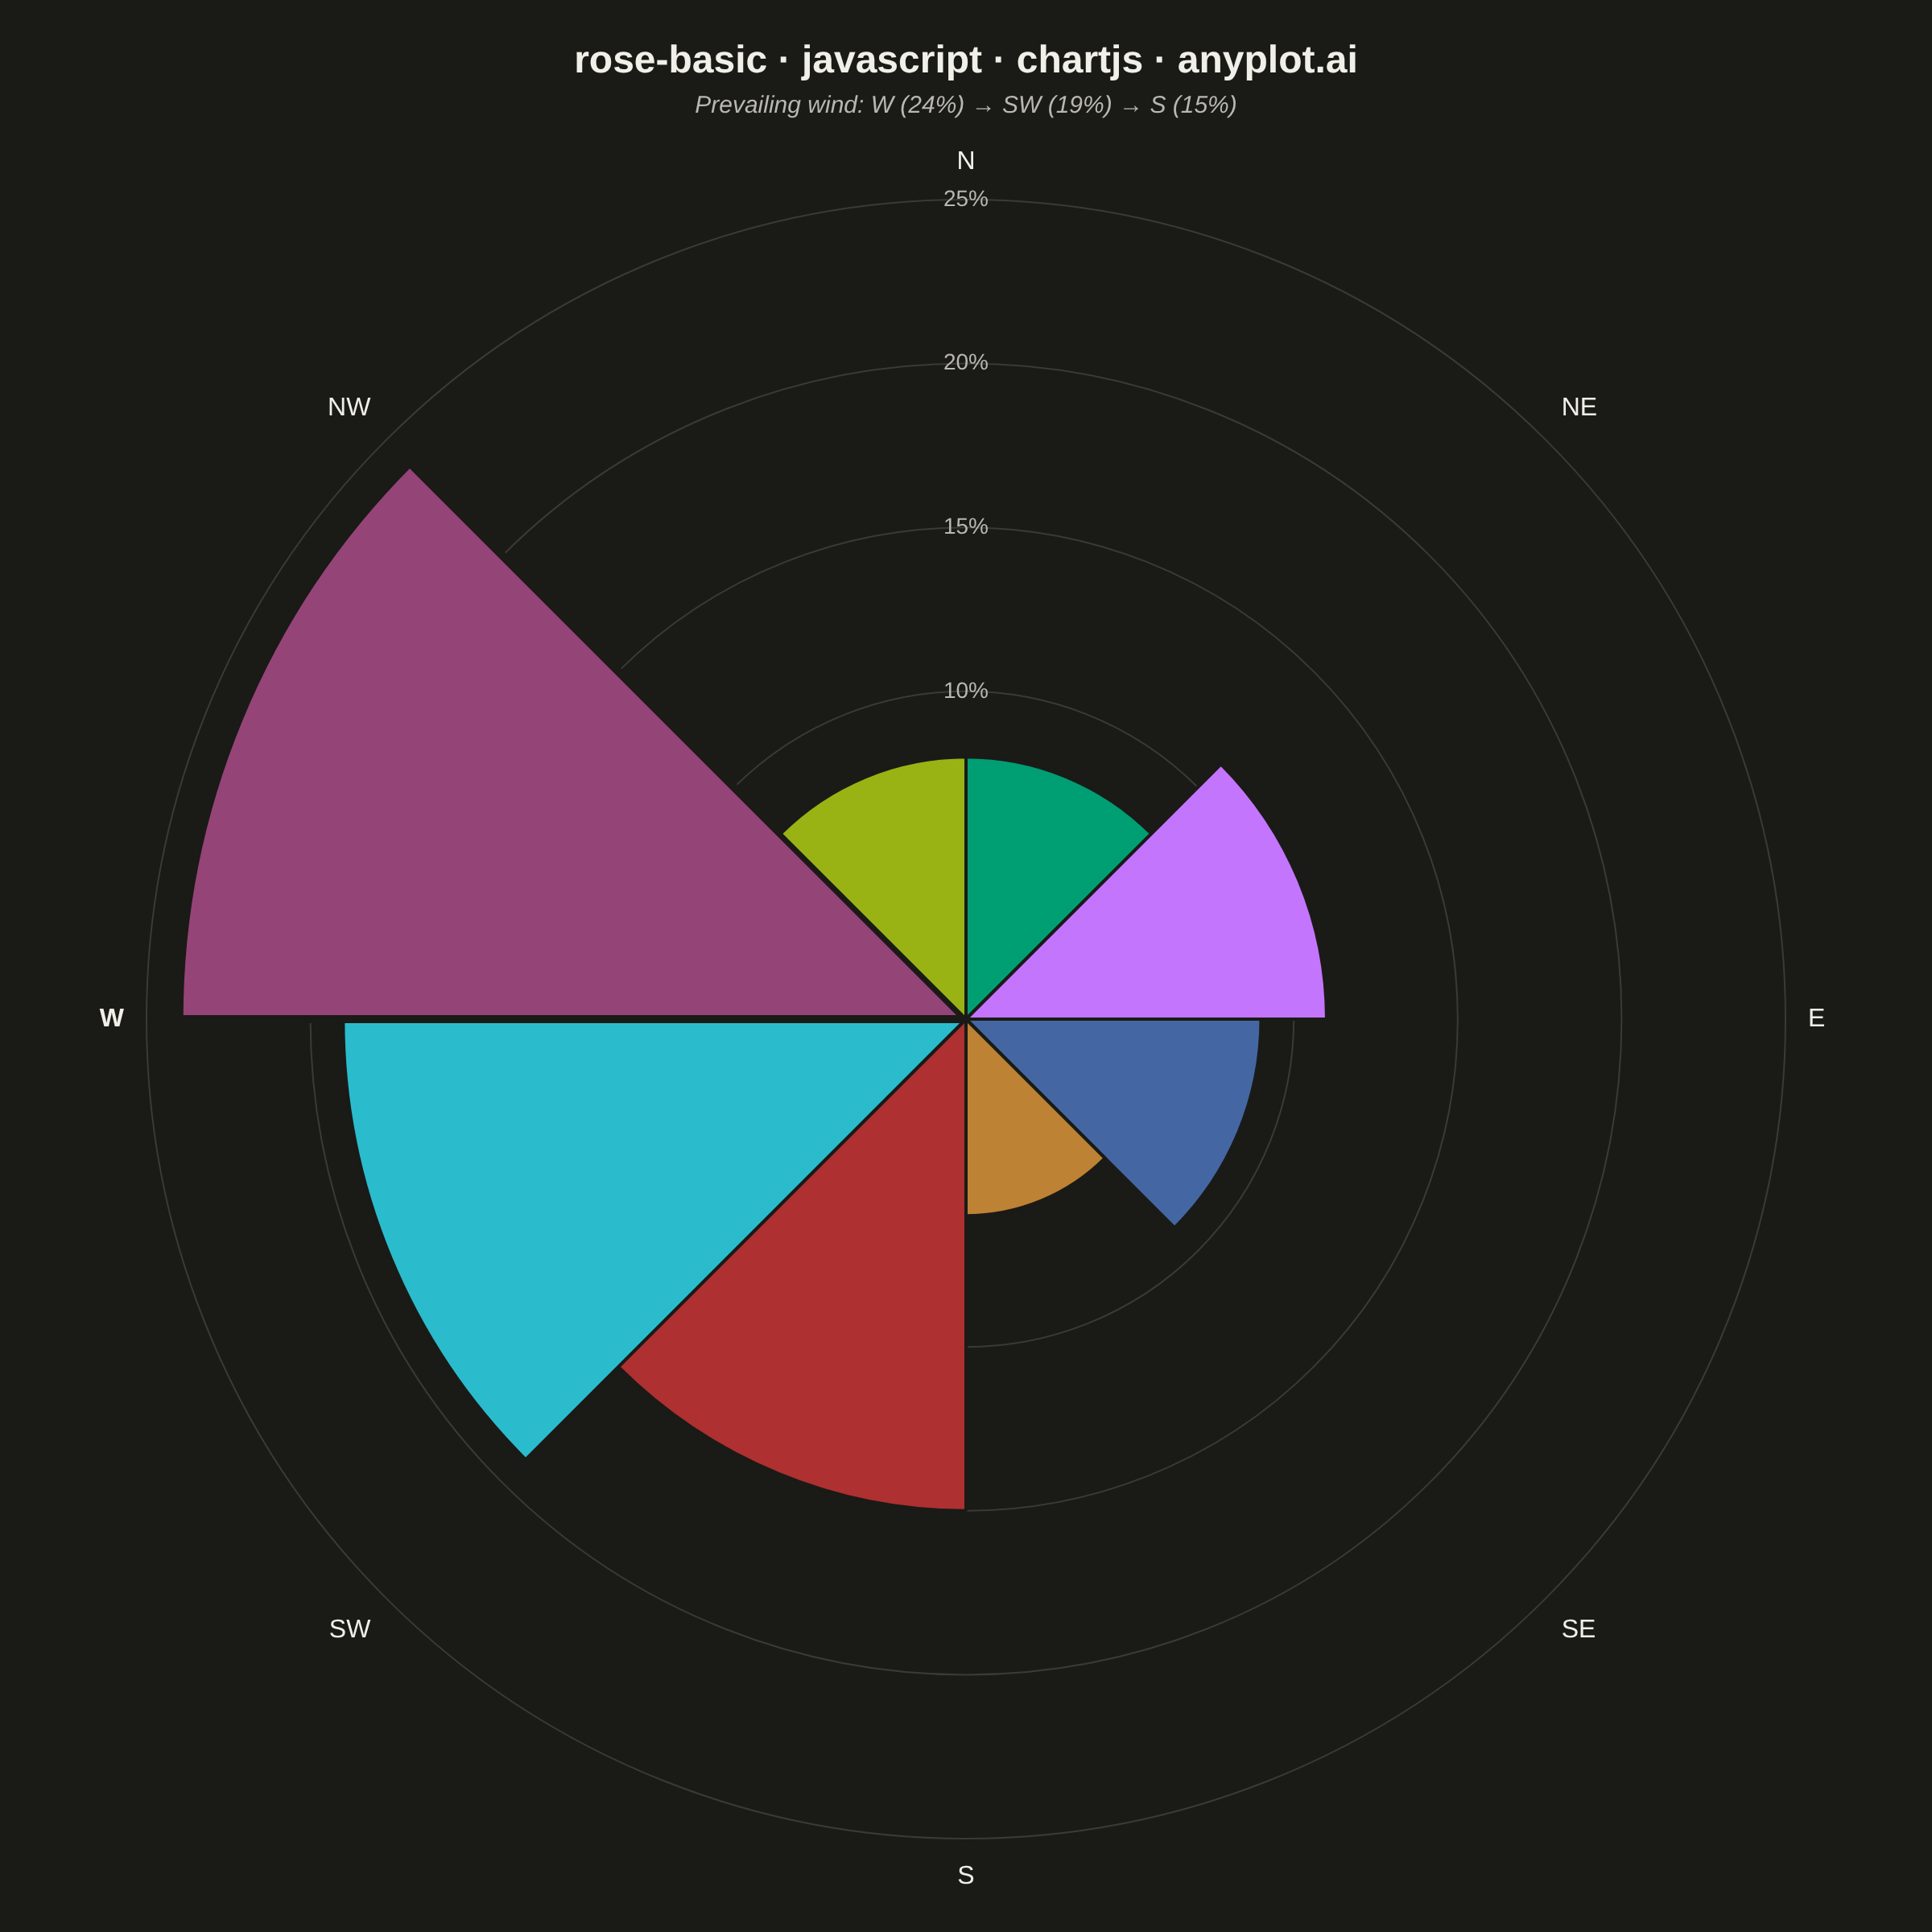
A rose chart (also called Nightingale or coxcomb diagram) displays categorical data in a circular format where segments are arranged around the center like pie slices, but with radius proportional to the value rather than angle. This visualization excels at showing cyclical or directional patterns where the circular arrangement has natural meaning. The equal-angle wedges make comparison of values across categories intuitive while emphasizing the periodic nature of the data.
Preview render from the Chart.js implementation.