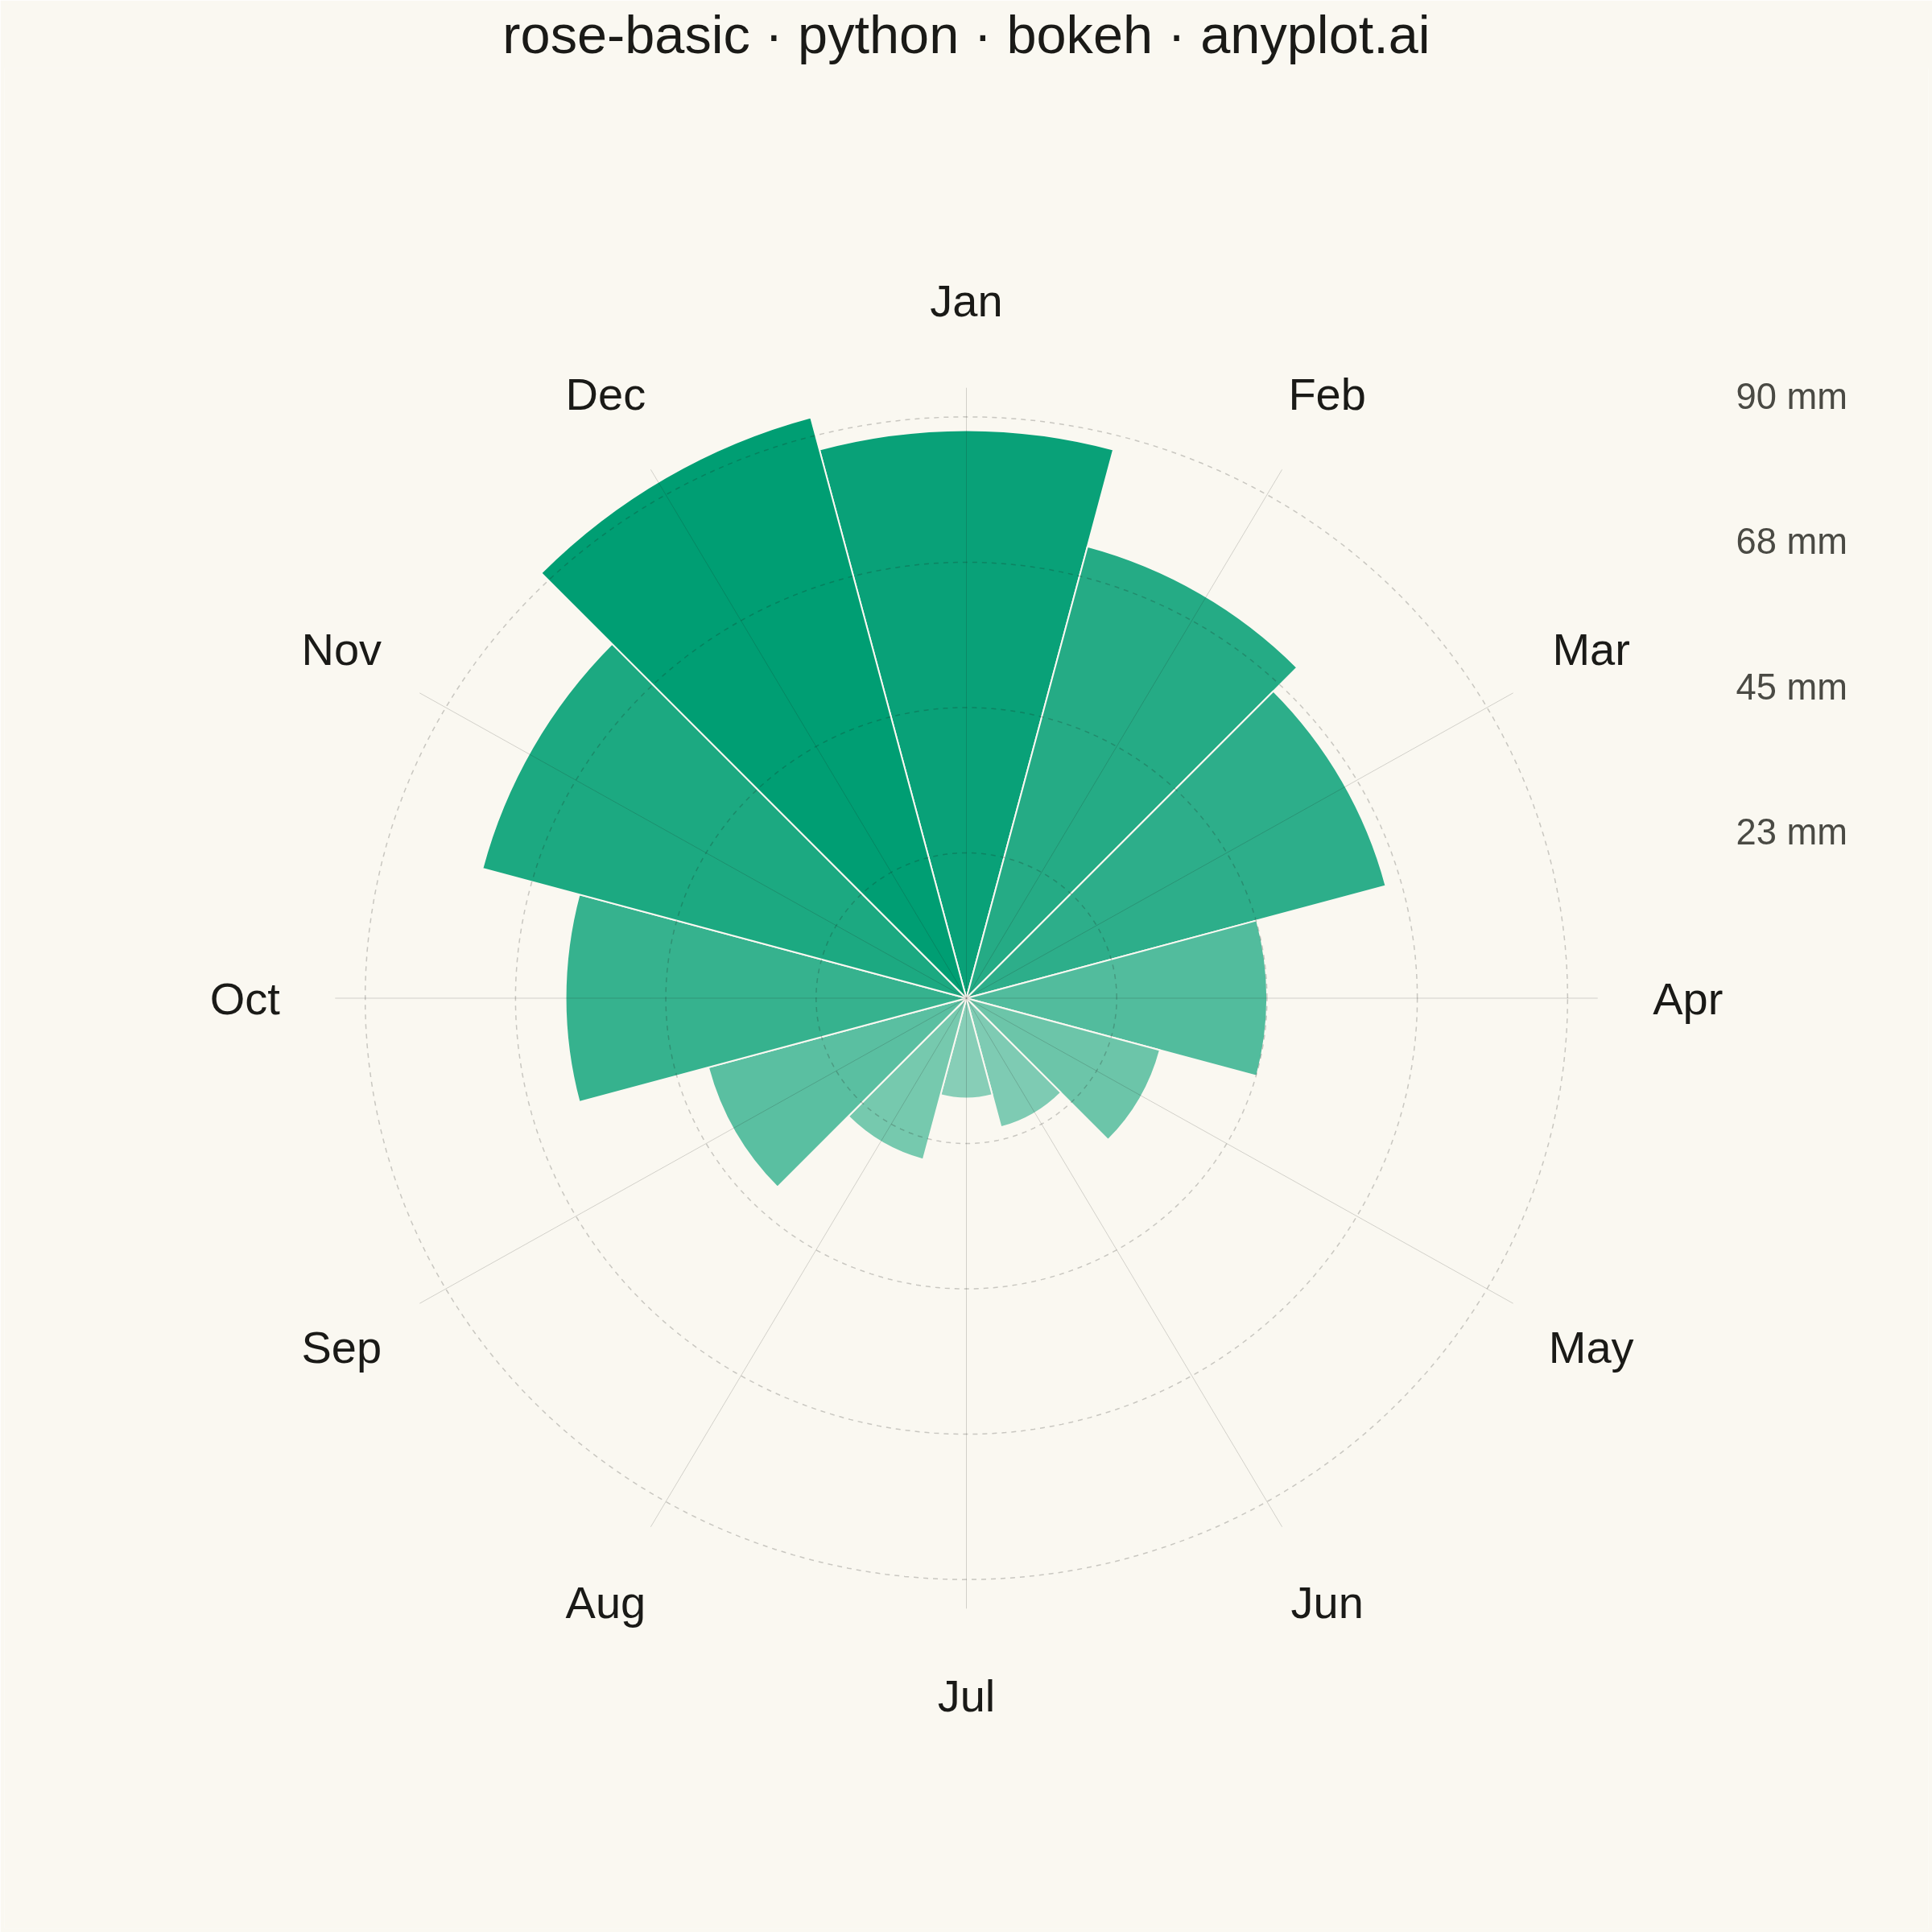
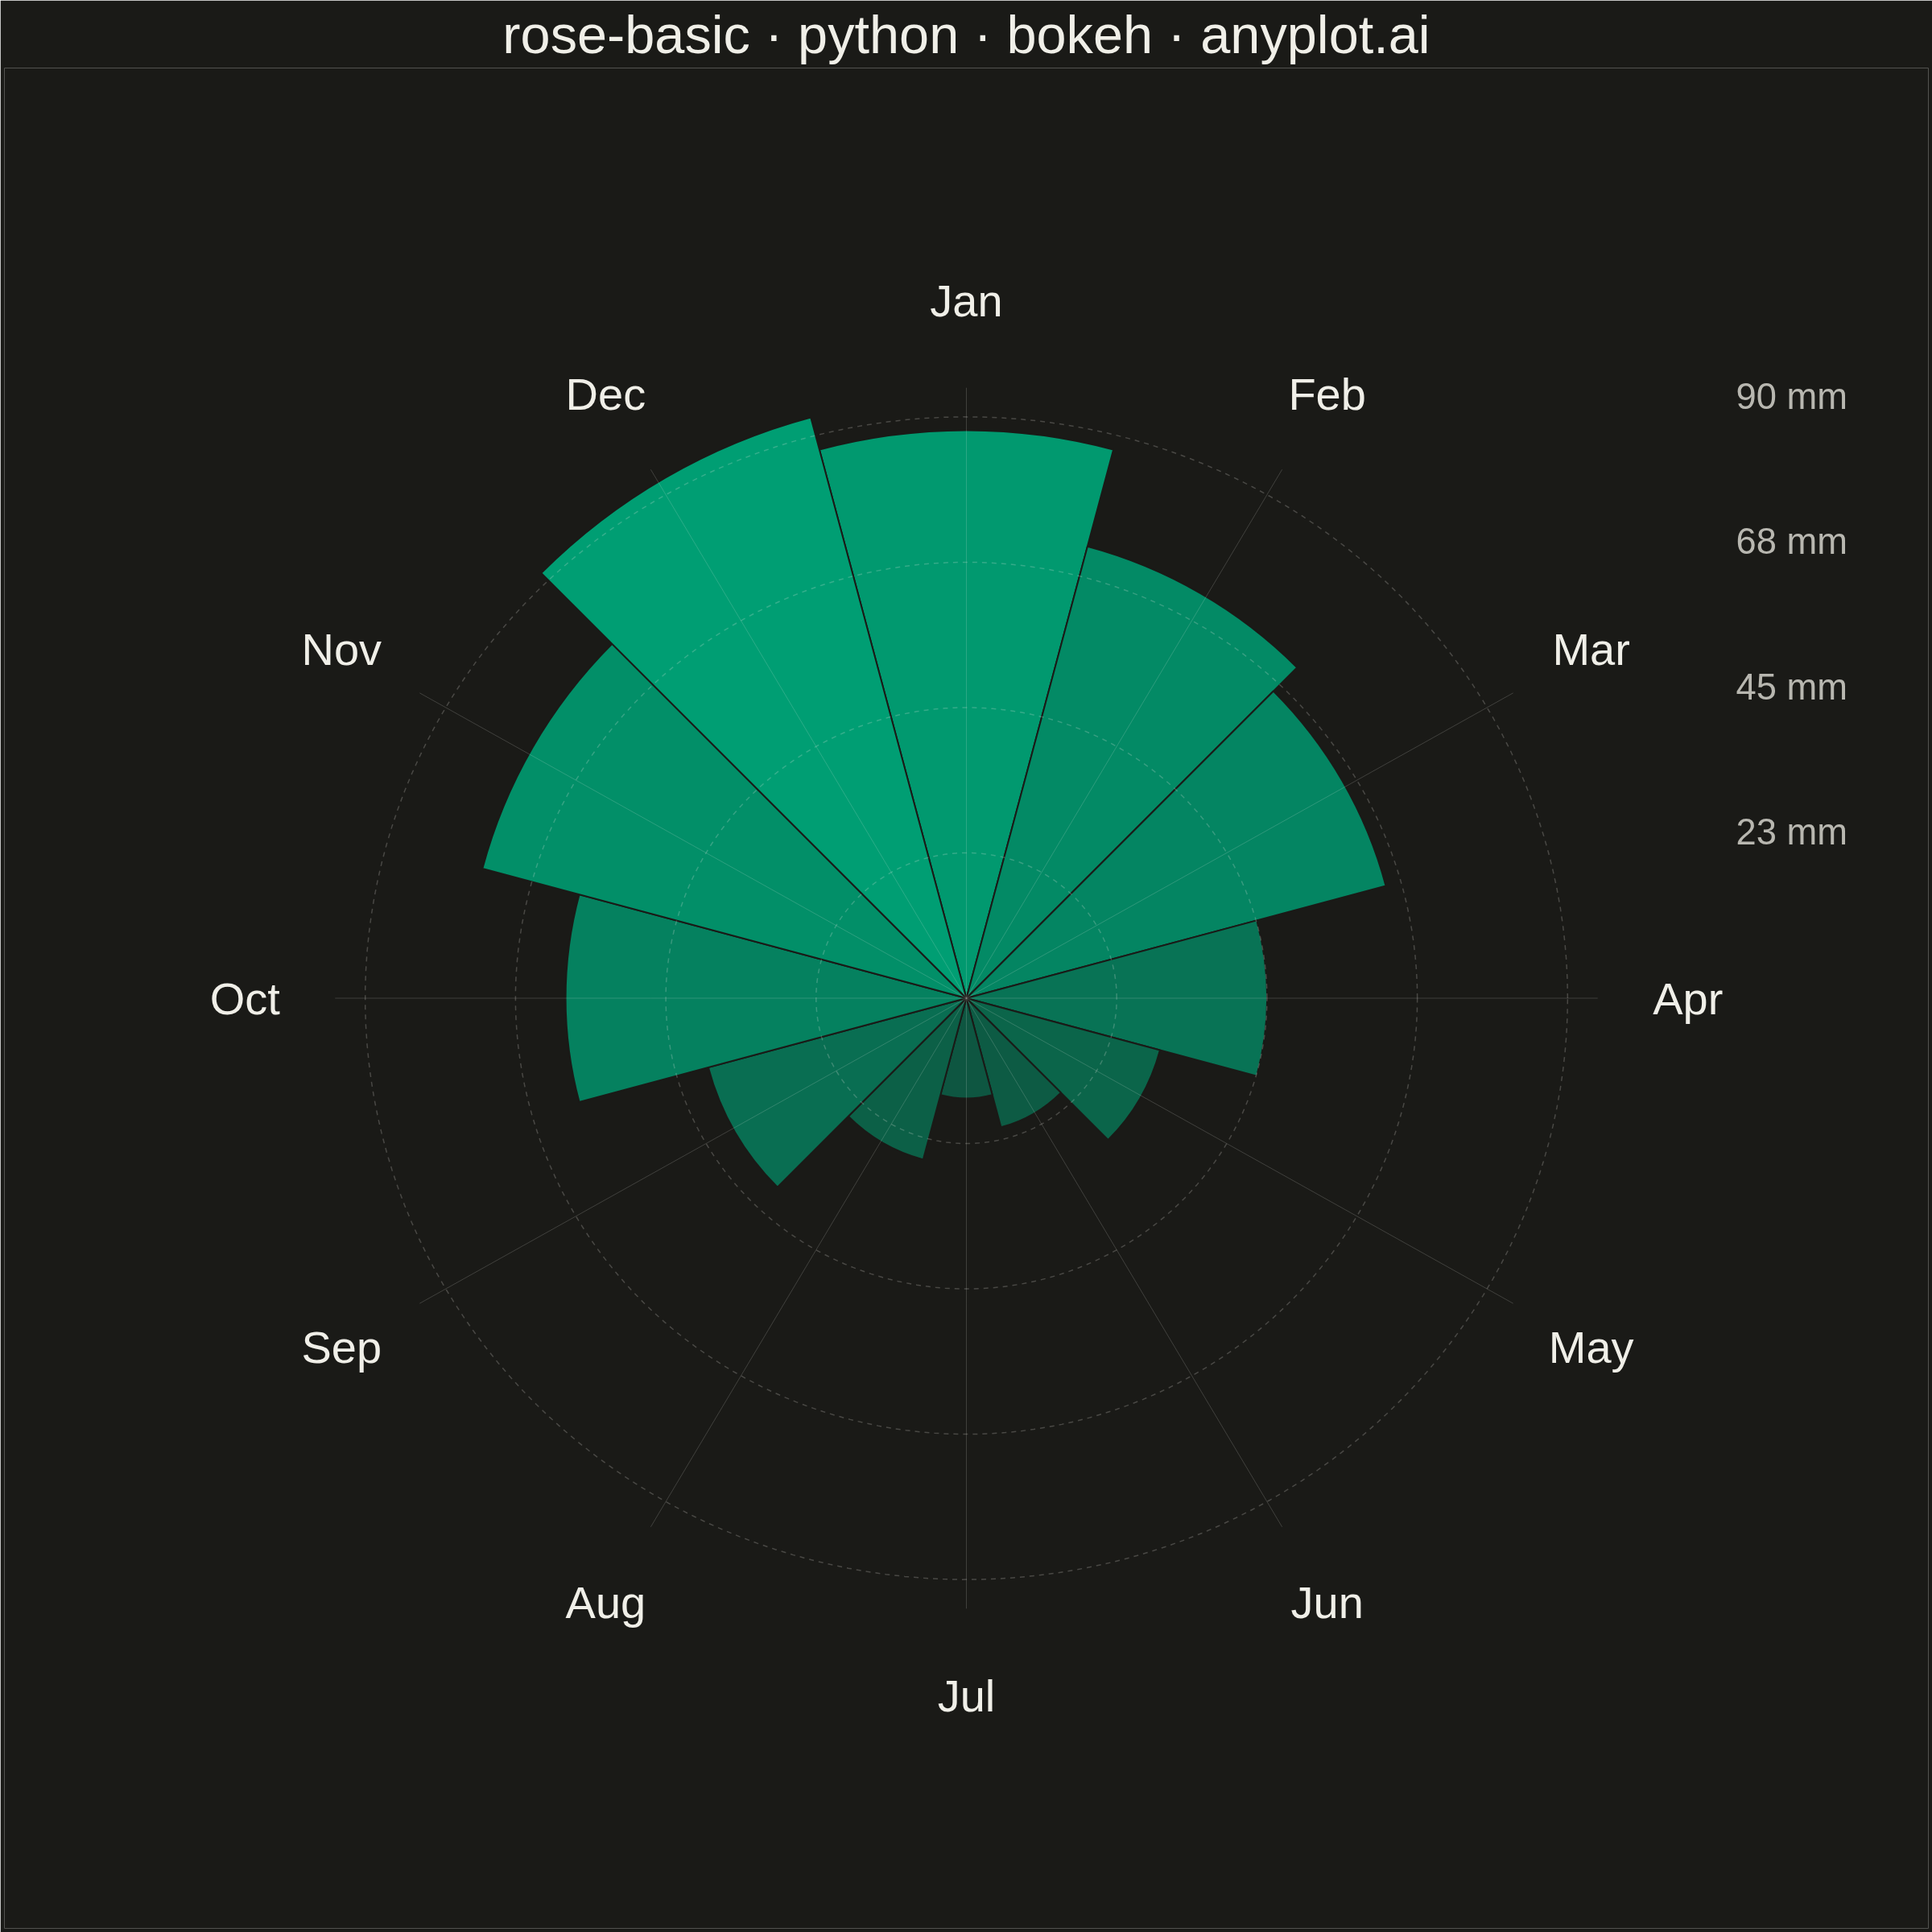
A rose chart (also called Nightingale or coxcomb diagram) displays categorical data in a circular format where segments are arranged around the center like pie slices, but with radius proportional to the value rather than angle. This visualization excels at showing cyclical or directional patterns where the circular arrangement has natural meaning. The equal-angle wedges make comparison of values across categories intuitive while emphasizing the periodic nature of the data.
""" anyplot.ai
rose-basic: Basic Rose Chart
Library: bokeh 3.9.1 | Python 3.13.14
Quality: 92/100 | Updated: 2026-07-25
"""

import os
import sys
import time
from pathlib import Path


# Remove this script's directory from sys.path to prevent bokeh.py from
# shadowing the installed bokeh package when Python adds the script dir.
_script_dir = os.path.dirname(os.path.abspath(__file__))
sys.path = [p for p in sys.path if os.path.abspath(p or ".") != _script_dir]

import numpy as np
from bokeh.io import output_file, save
from bokeh.models import ColumnDataSource, HoverTool
from bokeh.plotting import figure
from selenium import webdriver
from selenium.webdriver.chrome.options import Options


# Theme tokens
THEME = os.getenv("ANYPLOT_THEME", "light")
PAGE_BG = "#FAF8F1" if THEME == "light" else "#1A1A17"
INK = "#1A1A17" if THEME == "light" else "#F0EFE8"
INK_SOFT = "#4A4A44" if THEME == "light" else "#B8B7B0"
BRAND = "#009E73"

# Data - Monthly rainfall (mm) showing seasonal patterns
months = ["Jan", "Feb", "Mar", "Apr", "May", "Jun", "Jul", "Aug", "Sep", "Oct", "Nov", "Dec"]
values = [85, 70, 65, 45, 30, 20, 15, 25, 40, 60, 75, 90]
max_val = max(values)
n = len(months)
angle_width = 2 * np.pi / n

# Calculate wedge angles (equal slices, January centered at top/north)
start_angles = np.array([np.pi / 2 + angle_width / 2 - i * angle_width for i in range(n)])
end_angles = start_angles - angle_width
center_angles = (start_angles + end_angles) / 2

# Normalize values to radius (max value = 1.0)
radii = [v / max_val for v in values]

# Brand green with alpha varying by rainfall intensity
alphas = [0.35 + 0.65 * (v / max_val) for v in values]

source = ColumnDataSource(
    data={
        "start_angle": start_angles,
        "end_angle": end_angles,
        "radius": radii,
        "alphas": alphas,
        "month": months,
        "value": values,
    }
)

# Square canvas — rose charts are radially symmetric with no preferred
# horizontal axis, so a 2400x2400 square uses the frame better than a
# 16:9 landscape (which leaves unused margins beside the circle).
W = H = 2400

# Create figure
p = figure(
    width=W,
    height=H,
    title="rose-basic · python · bokeh · anyplot.ai",
    x_range=(-1.6, 1.6),
    y_range=(-1.6, 1.6),
    tools="",
    toolbar_location=None,
)

# Draw wedges (rose petals) with a hover tooltip — a genuinely bokeh-
# distinctive feature the static PNG can't show but the HTML artifact can.
wedge_renderer = p.wedge(
    x=0,
    y=0,
    radius="radius",
    start_angle="end_angle",
    end_angle="start_angle",
    source=source,
    fill_color=BRAND,
    fill_alpha="alphas",
    line_color=PAGE_BG,
    line_width=2,
    hover_fill_alpha=1.0,
    hover_line_color=INK,
)
p.add_tools(HoverTool(renderers=[wedge_renderer], tooltips=[("Month", "@month"), ("Rainfall", "@value mm")]))

# Radial gridlines (concentric circles)
theta = np.linspace(0, 2 * np.pi, 200)
for r in [0.25, 0.5, 0.75, 1.0]:
    p.line(r * np.cos(theta), r * np.sin(theta), line_color=INK, line_alpha=0.22, line_width=1.5, line_dash="dashed")

# Radial divider lines from center
for i in range(n):
    angle = np.pi / 2 - i * angle_width
    p.line([0, 1.05 * np.cos(angle)], [0, 1.05 * np.sin(angle)], line_color=INK, line_alpha=0.18, line_width=1)

# Month labels centered outside each wedge
label_radius = 1.2
for i, month in enumerate(months):
    angle = center_angles[i]
    p.text(
        x=[label_radius * np.cos(angle)],
        y=[label_radius * np.sin(angle)],
        text=[month],
        text_align="center",
        text_baseline="middle",
        text_font_size="42pt",
        text_color=INK,
    )

# Rainfall scale labels (actual mm values, right side)
for r in [0.25, 0.5, 0.75, 1.0]:
    val_label = f"{int(r * max_val + 0.5)} mm"
    p.text(x=[1.28], y=[r], text=[val_label], text_font_size="34pt", text_color=INK_SOFT, text_align="left")

# Title and chrome
p.title.text_font_size = "50pt"
p.title.align = "center"
p.title.text_color = INK
p.title.text_font_style = "normal"

p.background_fill_color = PAGE_BG
p.border_fill_color = PAGE_BG
p.outline_line_color = None

# Hide axes (not needed for rose chart)
p.axis.visible = False
p.grid.visible = False

# Write the interactive HTML (also a required catalog artifact)
output_file(f"plot-{THEME}.html")
save(p)

# Screenshot it with headless Chrome — export_png's chromedriver probe is
# unreliable in this environment, so render the saved HTML directly instead.
opts = Options()
for arg in (
    "--headless=new",
    "--no-sandbox",
    "--disable-dev-shm-usage",
    "--disable-gpu",
    f"--window-size={W},{H}",
    "--hide-scrollbars",
):
    opts.add_argument(arg)
driver = webdriver.Chrome(options=opts)
driver.set_window_size(W, H)
driver.get(f"file://{Path(f'plot-{THEME}.html').resolve()}")
# Headless Chrome's --window-size sets the OUTER window, which still reserves
# a phantom title-bar height even headless — pin the viewport exactly via CDP.
driver.execute_cdp_cmd(
    "Emulation.setDeviceMetricsOverride", {"width": W, "height": H, "deviceScaleFactor": 1, "mobile": False}
)
time.sleep(3)  # let bokeh's JS render the canvas
driver.save_screenshot(f"plot-{THEME}.png")
driver.quit()
Runnable source as JSON, for any HTTP client: https://api.anyplot.ai/specs/rose-basic/bokeh/code. Any spec id and library id listed in llms-full.txt fit the same URL shape; every URL below is complete and callable.
{
  "spec_id": "rose-basic",
  "language": "python",
  "library": "bokeh",
  "page": "https://anyplot.ai/rose-basic/python/bokeh",
  "hub": "https://anyplot.ai/rose-basic",
  "code_json": "https://api.anyplot.ai/specs/rose-basic/bokeh/code",
  "spec_json": "https://api.anyplot.ai/specs/rose-basic",
  "render_light_png": "https://storage.googleapis.com/anyplot-images/plots/rose-basic/python/bokeh/plot-light.png",
  "render_dark_png": "https://storage.googleapis.com/anyplot-images/plots/rose-basic/python/bokeh/plot-dark.png",
  "interactive_light_html": "https://storage.googleapis.com/anyplot-images/plots/rose-basic/python/bokeh/plot-light.html",
  "interactive_dark_html": "https://storage.googleapis.com/anyplot-images/plots/rose-basic/python/bokeh/plot-dark.html",
  "quality_score": 92.0,
  "license": "MIT",
  "guide": "https://anyplot.ai/llms.txt"
}
Part of Basic Rose Chart on anyplot.ai.