The same plot in 14 other libraries — JavaScript: Chart.js, D3.js, Apache ECharts, MUI X Charts; Python: Altair, Bokeh, lets-plot, Matplotlib, Plotly, plotnine, Pygal, Seaborn; R: ggplot2; Julia: Makie.jl. Compare all 15 side by side: Basic Rose Chart in Python, R, Julia and JavaScript.
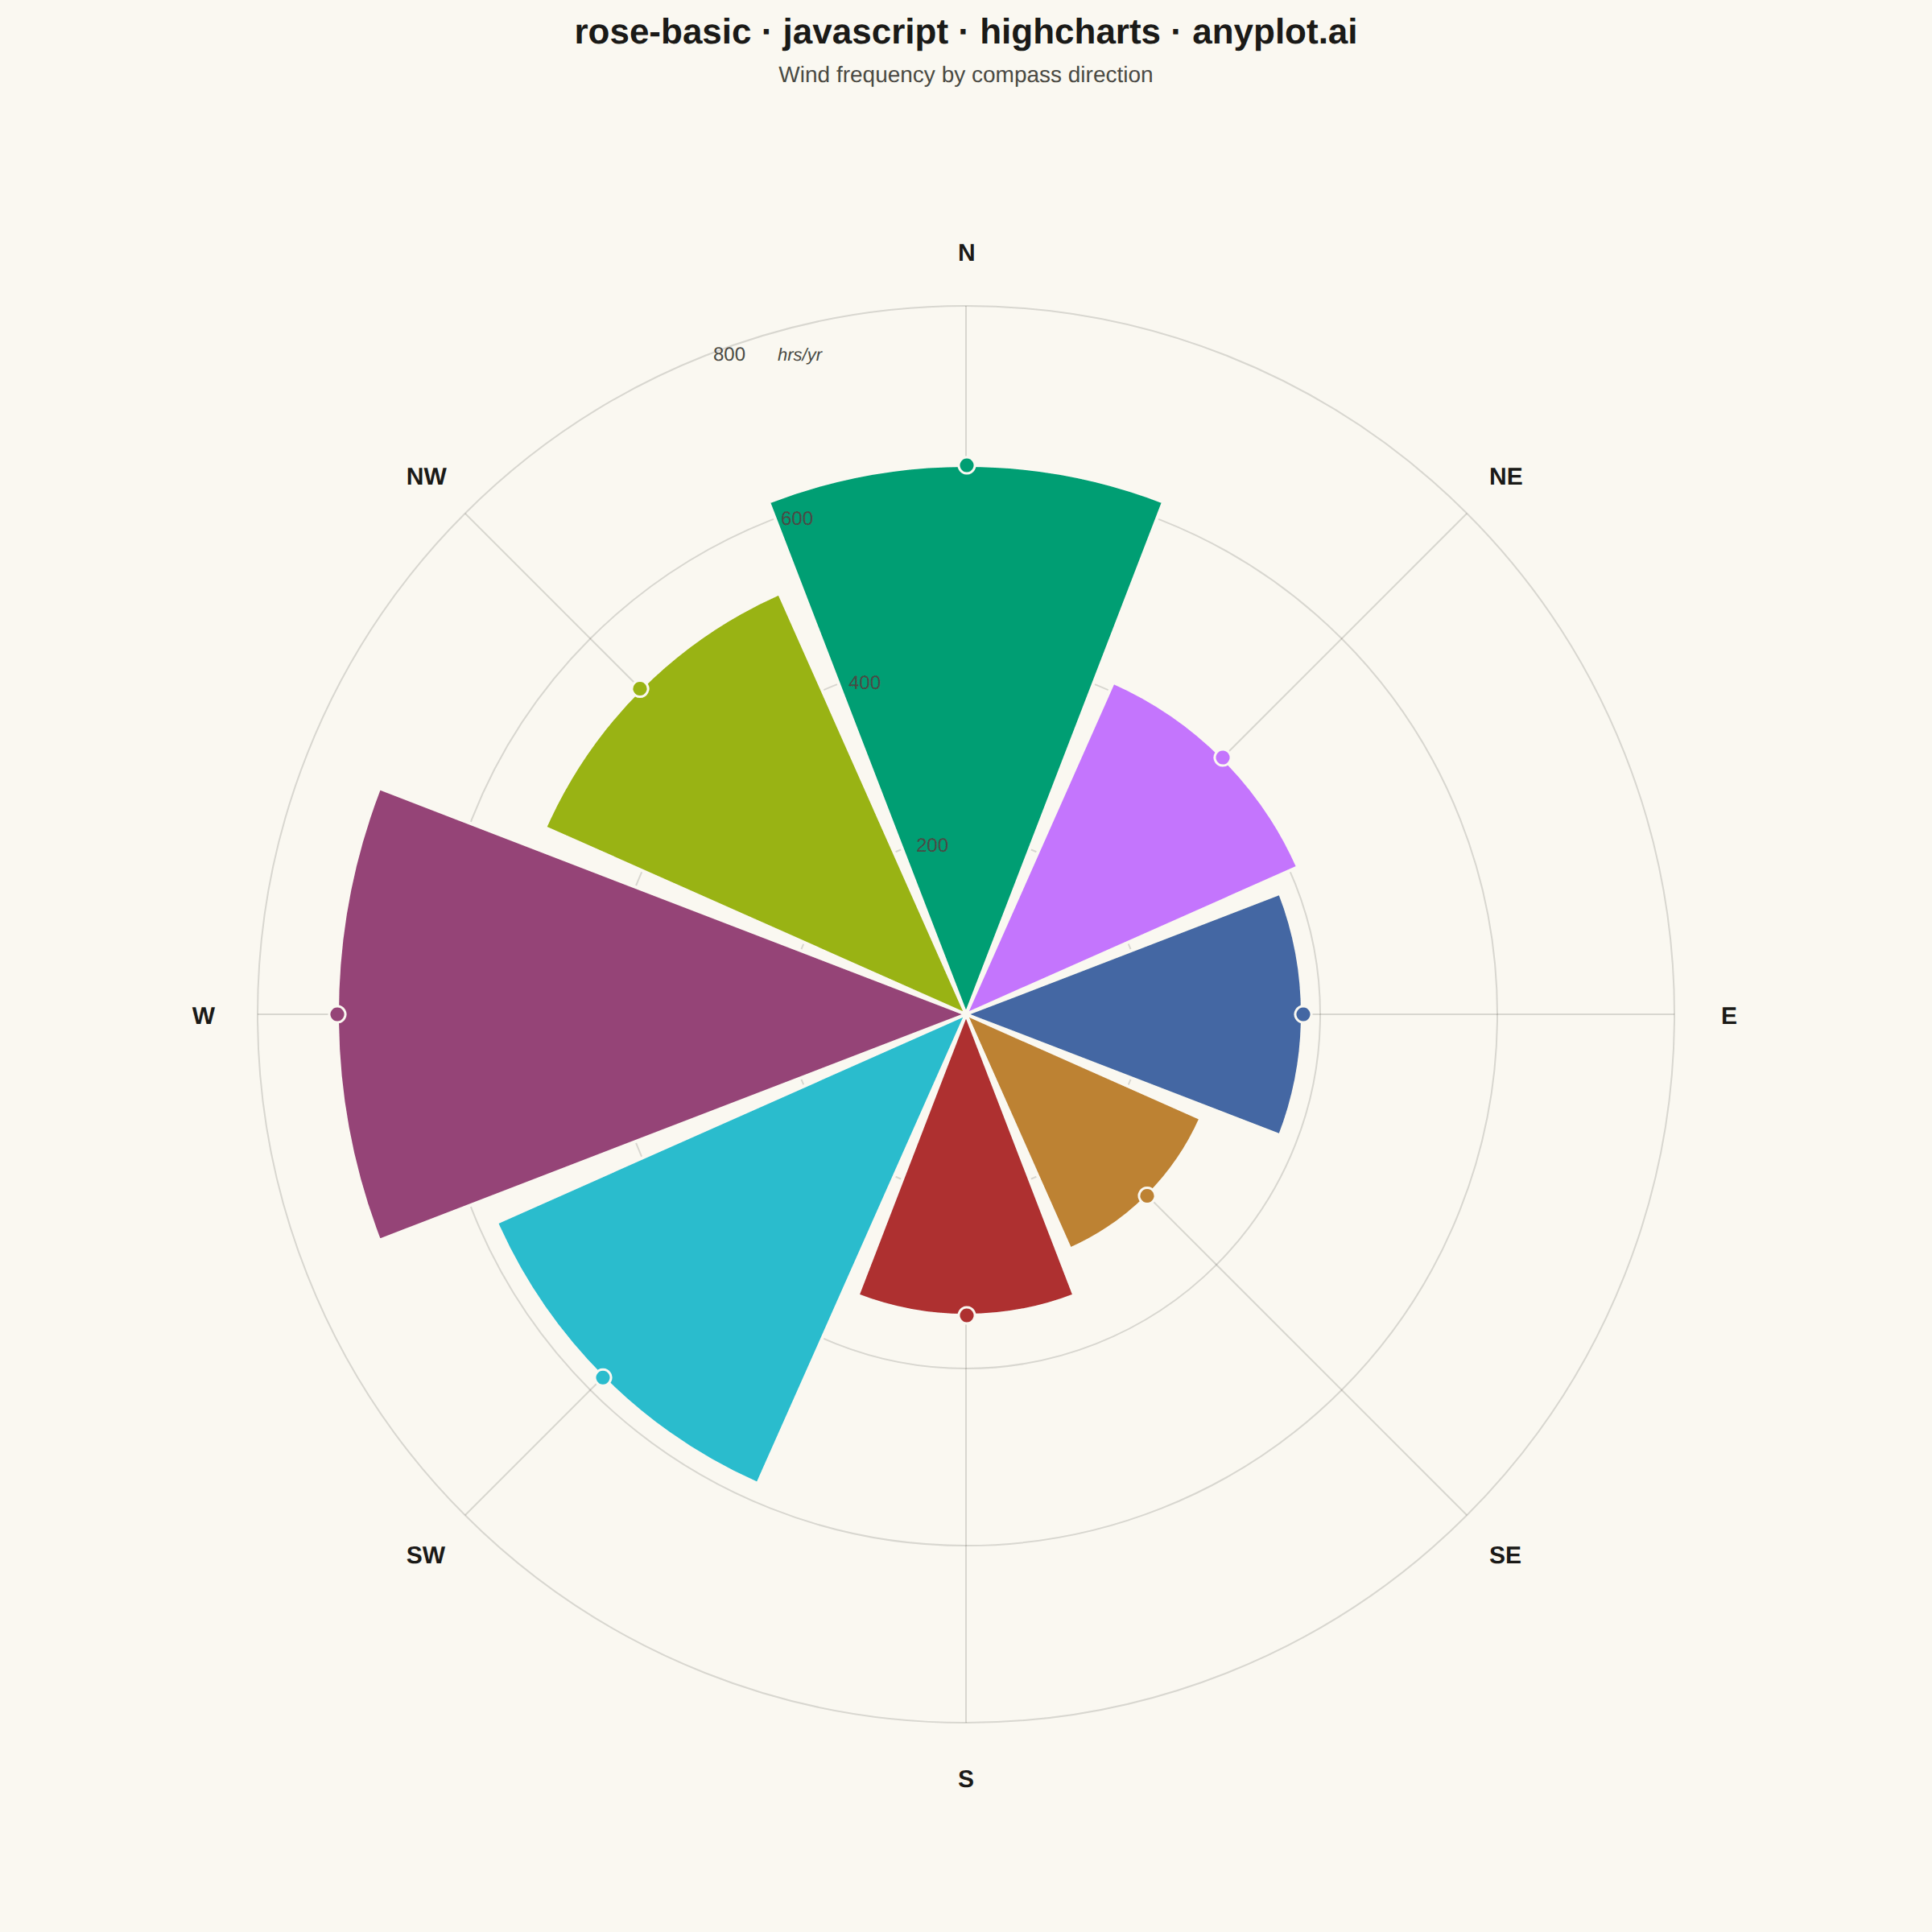
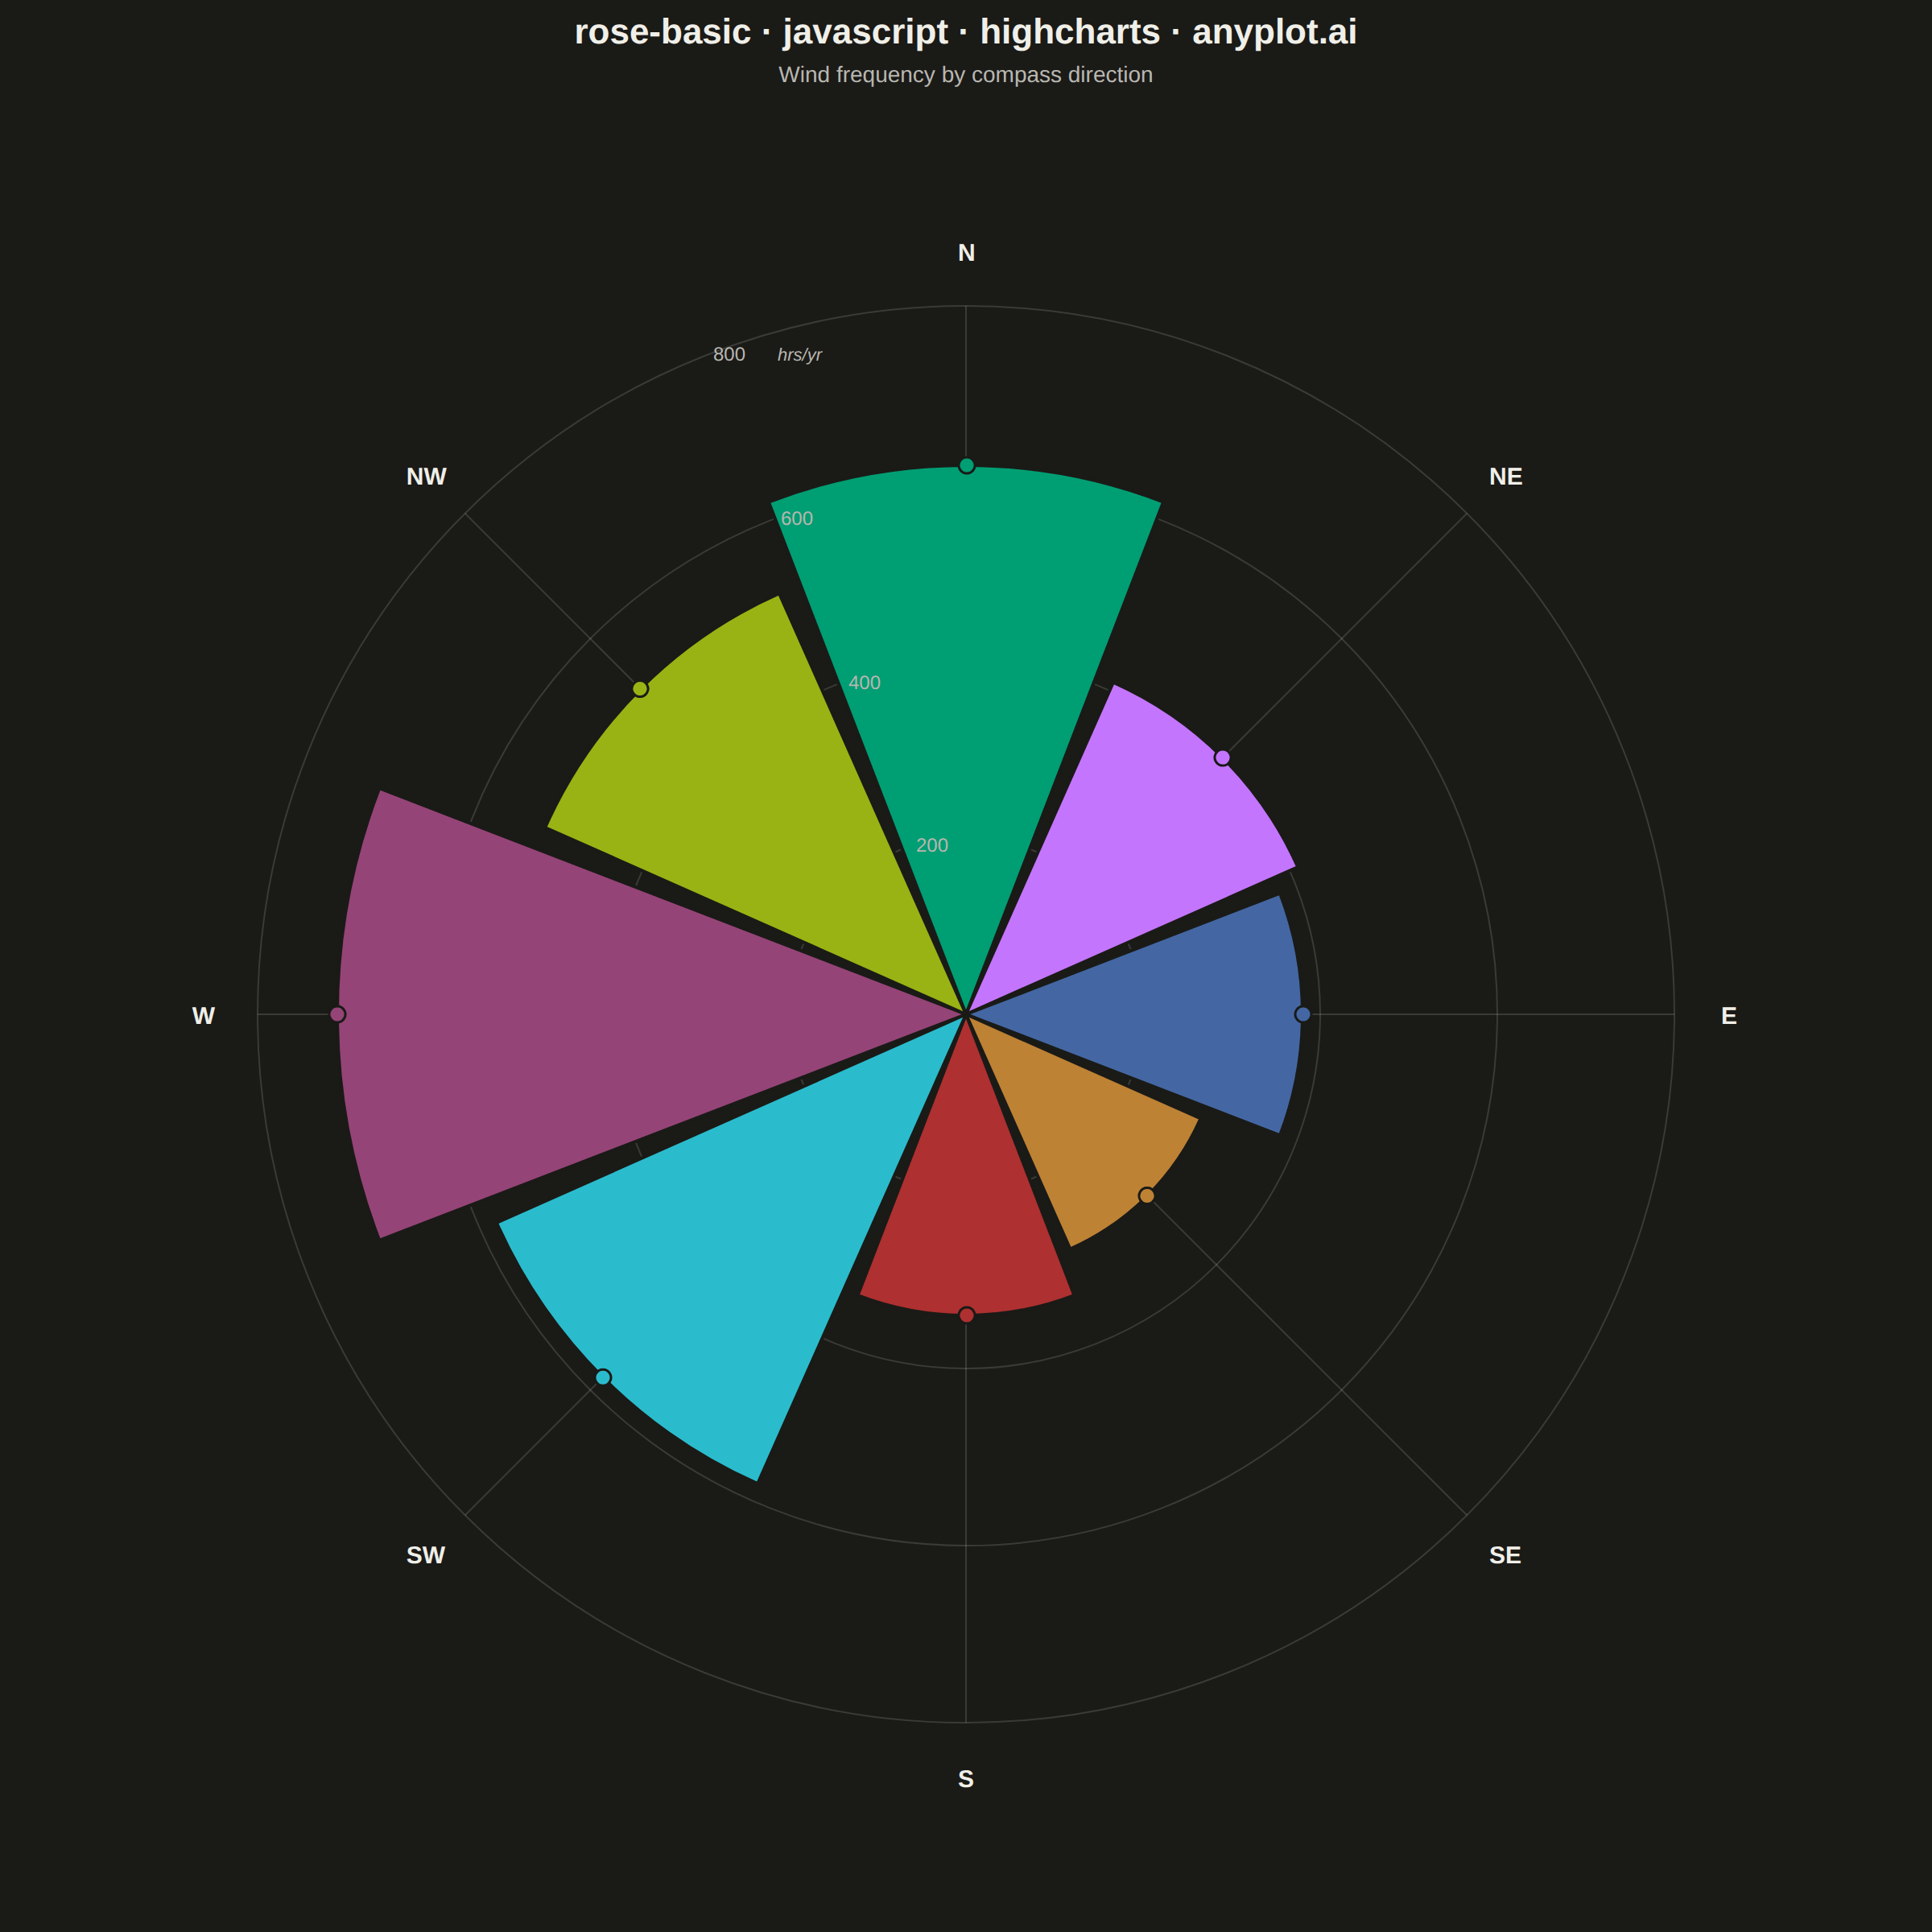
A rose chart (also called Nightingale or coxcomb diagram) displays categorical data in a circular format where segments are arranged around the center like pie slices, but with radius proportional to the value rather than angle. This visualization excels at showing cyclical or directional patterns where the circular arrangement has natural meaning. The equal-angle wedges make comparison of values across categories intuitive while emphasizing the periodic nature of the data.
// anyplot.ai
// rose-basic: Basic Rose Chart
// Library: highcharts 12.6.0 | JavaScript 22.23.1
// Quality: 91/100 | Created: 2026-07-25
//# anyplot-orientation: square

// Only the core `highcharts` bundle is loaded (no highcharts-more), so the
// native polar chart type isn't available. Each compass wedge is drawn with
// the SVG renderer's own `arc()` primitive (the same primitive Highcharts
// pie slices use internally), with radius scaled linearly to value so
// segment length — not area — encodes the data, per the spec. A real
// invisible-marker scatter point sits at each wedge tip so hover still
// produces a genuine Highcharts tooltip instead of a static image.
const t = window.ANYPLOT_TOKENS;

// --- Data (annual wind-observation hours by compass direction) -------------
const DIRECTIONS = ["N", "NE", "E", "SE", "S", "SW", "W", "NW"];
const FREQUENCY_HOURS = [620, 410, 380, 290, 340, 580, 710, 520];
const MAX_VALUE = 800;
const RING_LEVELS = [200, 400, 600, 800];
const SLICE_ANGLE = (2 * Math.PI) / DIRECTIONS.length;
const WEDGE_GAP = 0.025; // radians of empty space on each side of a wedge

const TITLE = "rose-basic · javascript · highcharts · anyplot.ai";
const titleFs = Math.round(22 * Math.min(1, 67 / TITLE.length)) + "px";

// --- Chart (empty core chart used as a canvas for the renderer overlay) ----
const chart = Highcharts.chart("container", {
  chart: {
    backgroundColor: "transparent",
    animation: false,
    style: { fontFamily: "inherit" },
    margin: [130, 90, 70, 90],
  },
  credits: { enabled: false },
  title: {
    text: TITLE,
    style: { color: t.ink, fontSize: titleFs, fontWeight: "600" },
  },
  subtitle: {
    text: "Wind frequency by compass direction",
    style: { color: t.inkSoft, fontSize: "14px" },
  },
  xAxis: { visible: false, gridLineWidth: 0, lineWidth: 0, tickLength: 0 },
  yAxis: { visible: false, gridLineWidth: 0, lineWidth: 0, tickLength: 0 },
  legend: { enabled: false },
  tooltip: {
    enabled: true,
    backgroundColor: t.elevatedBg,
    borderColor: t.grid,
    style: { color: t.ink },
    formatter() {
      return `<b>${this.point.name}</b><br/>${this.point.custom.hours} hrs/yr`;
    },
  },
  plotOptions: { series: { animation: false } },
  series: [],
});

// Fix the (visible: false) axes to a known pixel-space extent so the tooltip
// marker series below can be data-bound at the same projected coordinates
// the renderer overlay uses — keeps the PNG stable while giving the
// interactive HTML a genuine Highcharts series/tooltip.
chart.xAxis[0].setExtremes(0, chart.plotWidth, false);
chart.yAxis[0].setExtremes(0, chart.plotHeight, false);

// --- Geometry ----------------------------------------------------------------
const cx = chart.plotLeft + chart.plotWidth / 2;
const cy = chart.plotTop + chart.plotHeight / 2;
const outerR = Math.min(chart.plotWidth, chart.plotHeight) / 2 - 60;

// index 0 (N) points straight up; direction proceeds clockwise like a compass
const centerAngleOf = (i) => -Math.PI / 2 + i * SLICE_ANGLE;
const pointAt = (angle, radiusFrac) => [cx + outerR * radiusFrac * Math.cos(angle), cy + outerR * radiusFrac * Math.sin(angle)];
const toAxisXY = ([sx, sy]) => [sx - chart.plotLeft, chart.plotTop + chart.plotHeight - sy];

// --- Radial grid rings -------------------------------------------------------
RING_LEVELS.forEach((level) => {
  chart.renderer
    .circle(cx, cy, outerR * (level / MAX_VALUE))
    .attr({ stroke: t.grid, "stroke-width": 1, fill: "none", zIndex: 1 })
    .add();
});

// --- Angular spokes (one per compass direction) ------------------------------
DIRECTIONS.forEach((_, i) => {
  const [ox, oy] = pointAt(centerAngleOf(i), 1);
  chart.renderer
    .path(["M", cx, cy, "L", ox, oy])
    .attr({ stroke: t.grid, "stroke-width": 1, zIndex: 1 })
    .add();
});

// --- Wedges (radius proportional to value, not area) -------------------------
DIRECTIONS.forEach((direction, i) => {
  const center = centerAngleOf(i);
  const radius = outerR * (FREQUENCY_HOURS[i] / MAX_VALUE);
  chart.renderer
    .arc(cx, cy, radius, 0, center - SLICE_ANGLE / 2 + WEDGE_GAP, center + SLICE_ANGLE / 2 - WEDGE_GAP)
    .attr({ fill: t.palette[i], stroke: t.pageBg, "stroke-width": 2, zIndex: 2 })
    .add();
});

// --- Real Highcharts series ---------------------------------------------------
// 1) Wedge-tip markers: real data points bound at each wedge's outer radius,
//    giving a genuine hover tooltip (category + value) over the static shape.
const wedgeData = DIRECTIONS.map((direction, i) => {
  const angle = centerAngleOf(i);
  const [ax, ay] = toAxisXY(pointAt(angle, FREQUENCY_HOURS[i] / MAX_VALUE));
  return { x: ax, y: ay, name: direction, custom: { hours: FREQUENCY_HOURS[i] } };
});

chart.addSeries(
  {
    type: "scatter",
    name: "Wind frequency",
    zIndex: 3,
    enableMouseTracking: true,
    stickyTracking: false,
    animation: false,
    marker: {
      enabled: true,
      radius: 5,
      lineWidth: 1.5,
      lineColor: t.pageBg,
    },
    colors: t.palette,
    colorByPoint: true,
    dataLabels: { enabled: false },
    data: wedgeData,
  },
  false
);

// 2) Compass labels: the 8 direction letters just outside the outermost ring.
const directionLabelData = DIRECTIONS.map((direction, i) => {
  const [ax, ay] = toAxisXY(pointAt(centerAngleOf(i), 1 + 34 / outerR));
  return { x: ax, y: ay, dataLabels: { format: direction, align: "center", verticalAlign: "middle" } };
});

chart.addSeries(
  {
    type: "scatter",
    name: "Compass direction",
    zIndex: 4,
    enableMouseTracking: false,
    animation: false,
    marker: { enabled: false },
    dataLabels: {
      enabled: true,
      crop: false,
      overflow: "allow",
      style: { color: t.ink, fontSize: "15px", fontWeight: "600", textOutline: "none" },
    },
    data: directionLabelData,
  },
  false
);

// 3) Radial scale: the ring numbers plus one explicit unit label (VQ-06),
//    placed along a spoke-free bearing so they don't collide with a letter.
const scaleAngle = -Math.PI / 2 - SLICE_ANGLE / 2;
const ringLabelData = RING_LEVELS.map((level) => {
  const [ax, ay] = toAxisXY(pointAt(scaleAngle, level / MAX_VALUE));
  return { x: ax, y: ay, dataLabels: { format: String(level), align: "left", verticalAlign: "middle", x: 6, y: -4 } };
});
const [unitAx, unitAy] = toAxisXY(pointAt(scaleAngle, RING_LEVELS[RING_LEVELS.length - 1] / MAX_VALUE));
ringLabelData.push({
  x: unitAx,
  y: unitAy,
  dataLabels: {
    format: "hrs/yr",
    align: "left",
    verticalAlign: "middle",
    x: 46,
    y: -4,
    style: { color: t.inkSoft, fontSize: "11px", fontStyle: "italic", fontWeight: "400", textOutline: "none" },
  },
});

chart.addSeries(
  {
    type: "scatter",
    name: "Radial scale",
    zIndex: 2,
    enableMouseTracking: false,
    animation: false,
    marker: { enabled: false },
    dataLabels: {
      enabled: true,
      crop: false,
      overflow: "allow",
      style: { color: t.inkSoft, fontSize: "12px", fontWeight: "400", textOutline: "none" },
    },
    data: ringLabelData,
  },
  false
);

chart.redraw();
Runnable source as JSON, for any HTTP client: https://api.anyplot.ai/specs/rose-basic/highcharts/code. Any spec id and library id listed in llms-full.txt fit the same URL shape; every URL below is complete and callable.
{
  "spec_id": "rose-basic",
  "language": "javascript",
  "library": "highcharts",
  "page": "https://anyplot.ai/rose-basic/javascript/highcharts",
  "hub": "https://anyplot.ai/rose-basic",
  "code_json": "https://api.anyplot.ai/specs/rose-basic/highcharts/code",
  "spec_json": "https://api.anyplot.ai/specs/rose-basic",
  "render_light_png": "https://storage.googleapis.com/anyplot-images/plots/rose-basic/javascript/highcharts/plot-light.png",
  "render_dark_png": "https://storage.googleapis.com/anyplot-images/plots/rose-basic/javascript/highcharts/plot-dark.png",
  "interactive_light_html": "https://storage.googleapis.com/anyplot-images/plots/rose-basic/javascript/highcharts/plot-light.html",
  "interactive_dark_html": "https://storage.googleapis.com/anyplot-images/plots/rose-basic/javascript/highcharts/plot-dark.html",
  "quality_score": 91.0,
  "license": "MIT",
  "guide": "https://anyplot.ai/llms.txt"
}
Part of Basic Rose Chart on anyplot.ai.