The same plot in 14 other libraries — JavaScript: Chart.js, D3.js, Highcharts, MUI X Charts; Python: Altair, Bokeh, lets-plot, Matplotlib, Plotly, plotnine, Pygal, Seaborn; R: ggplot2; Julia: Makie.jl. Compare all 15 side by side: Basic Rose Chart in Python, R, Julia and JavaScript.
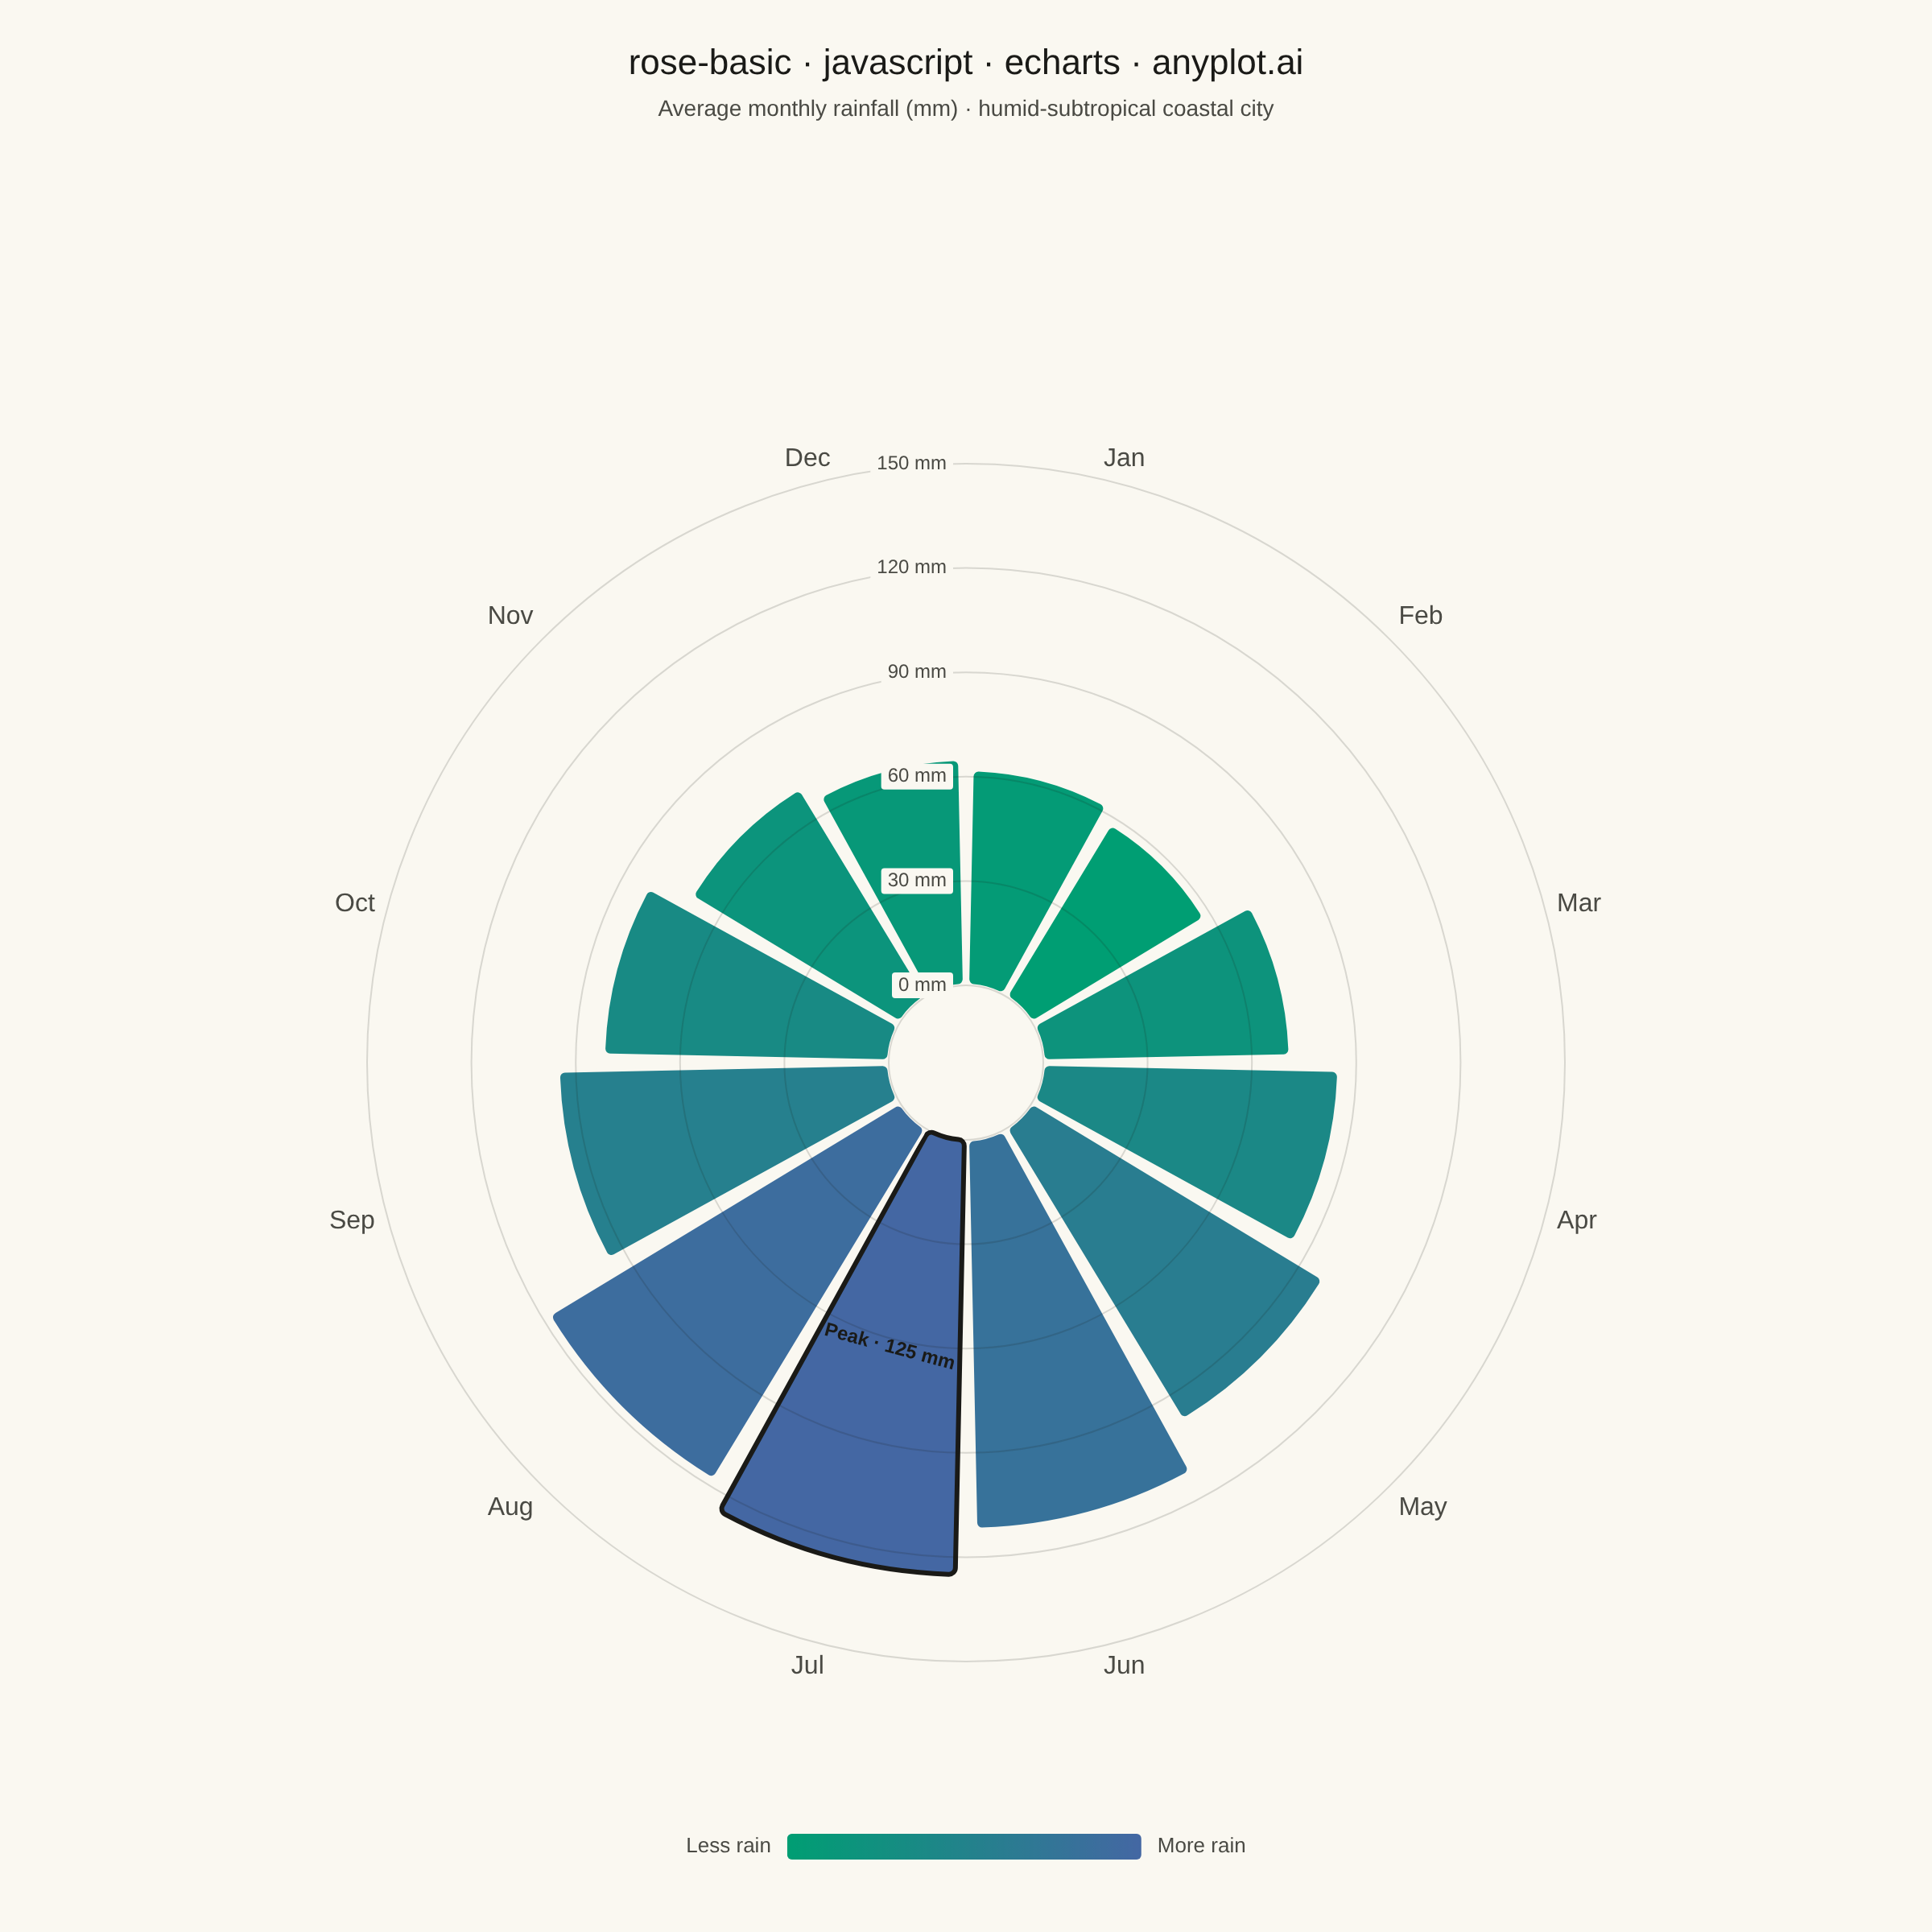
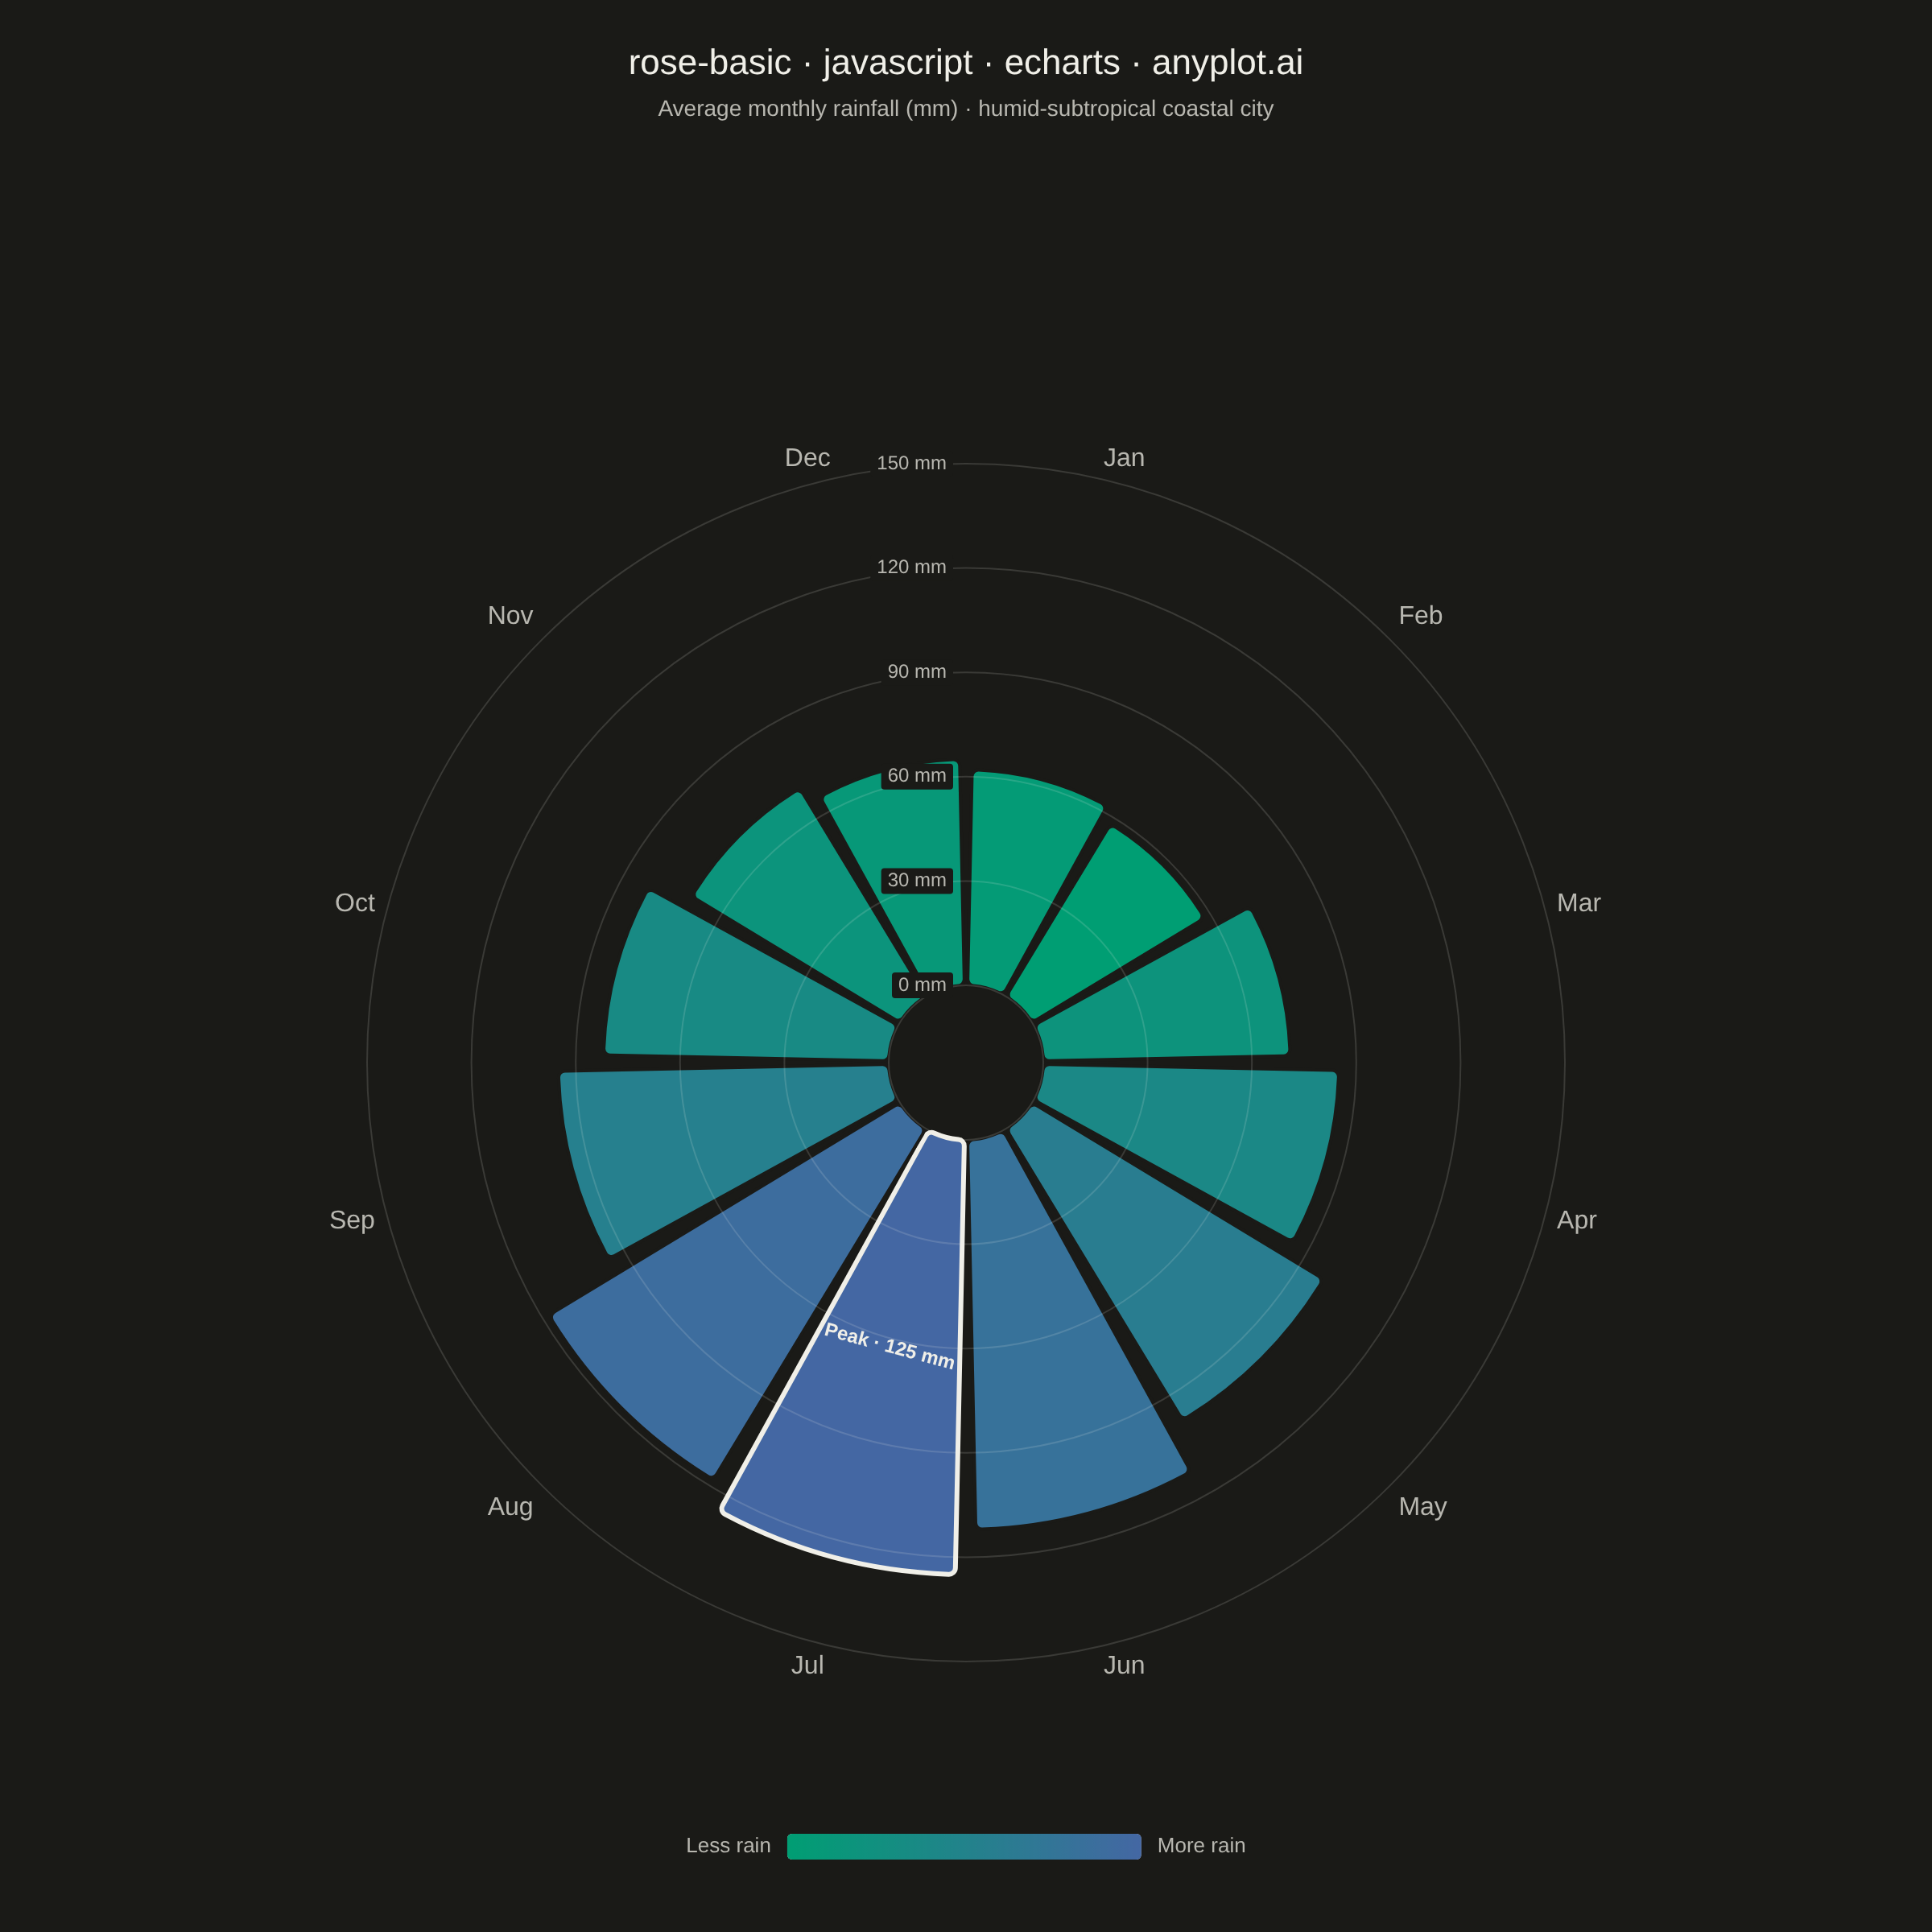
A rose chart (also called Nightingale or coxcomb diagram) displays categorical data in a circular format where segments are arranged around the center like pie slices, but with radius proportional to the value rather than angle. This visualization excels at showing cyclical or directional patterns where the circular arrangement has natural meaning. The equal-angle wedges make comparison of values across categories intuitive while emphasizing the periodic nature of the data.
// anyplot.ai
// rose-basic: Basic Rose Chart
// Library: echarts 6.1.0 | JavaScript 22.23.1
// Quality: 94/100 | Created: 2026-07-25

//# anyplot-orientation: square
const t = window.ANYPLOT_TOKENS;

// --- Data (in-memory, deterministic) ----------------------------------------
// Average monthly rainfall for a humid-subtropical coastal city (mm), Jan at
// the top, running clockwise — a classic natural-12-month cycle for a rose
// chart, with a monsoon-influenced Jun-Aug wet season.
const months = [
  "Jan", "Feb", "Mar", "Apr", "May", "Jun",
  "Jul", "Aug", "Sep", "Oct", "Nov", "Dec",
];
const rainfall = [62, 58, 71, 85, 98, 112, 125, 118, 95, 82, 70, 65];
const peakIndex = rainfall.indexOf(Math.max(...rainfall));

// Highlight the wettest month with an ink outline and an explicit callout —
// the dual radius+color encoding already tells the story, this makes it explicit.
const seriesData = rainfall.map((value, i) =>
  i === peakIndex
    ? {
        value,
        itemStyle: { borderColor: t.ink, borderWidth: 3 },
        label: {
          show: true,
          position: "middle",
          formatter: () => `Peak · ${value} mm`,
          color: t.ink,
          fontSize: 12,
          fontWeight: 600,
        },
      }
    : value,
);

// --- Init --------------------------------------------------------------------
const chart = echarts.init(document.getElementById("container"));

// --- Option --------------------------------------------------------------------
const title = "rose-basic · javascript · echarts · anyplot.ai";

chart.setOption({
  animation: false,
  backgroundColor: "transparent",
  title: {
    text: title,
    subtext: "Average monthly rainfall (mm) · humid-subtropical coastal city",
    left: "center",
    top: 24,
    textStyle: { color: t.ink, fontSize: 22, fontWeight: 500 },
    subtextStyle: { color: t.inkSoft, fontSize: 14, fontWeight: 400 },
  },
  tooltip: {
    formatter: (p) => `${p.name}: ${p.value} mm`,
  },
  polar: {
    center: ["50%", "55%"],
    radius: ["8%", "62%"],
  },
  angleAxis: {
    type: "category",
    data: months,
    startAngle: 90,
    clockwise: true,
    axisLine: { show: false },
    axisTick: { show: false },
    axisLabel: { color: t.inkSoft, fontSize: 16 },
    splitLine: { show: false },
  },
  radiusAxis: {
    type: "value",
    min: 0,
    max: 150,
    interval: 30,
    z: 10,
    axisLine: { show: false },
    axisTick: { show: false },
    axisLabel: {
      color: t.inkSoft,
      fontSize: 12,
      formatter: "{value} mm",
      backgroundColor: t.pageBg,
      padding: [2, 4],
      borderRadius: 2,
    },
    splitLine: { lineStyle: { color: t.grid } },
  },
  visualMap: {
    type: "continuous",
    min: Math.min(...rainfall),
    max: Math.max(...rainfall),
    dimension: 0,
    seriesIndex: 0,
    orient: "horizontal",
    left: "center",
    bottom: 30,
    itemWidth: 16,
    itemHeight: 220,
    text: ["More rain", "Less rain"],
    textStyle: { color: t.inkSoft, fontSize: 13 },
    inRange: { color: t.seq },
  },
  series: [
    {
      type: "bar",
      coordinateSystem: "polar",
      z: 2,
      data: seriesData,
      barCategoryGap: "8%",
      itemStyle: {
        borderColor: t.pageBg,
        borderWidth: 2,
        borderRadius: 4,
      },
      emphasis: { itemStyle: { borderColor: t.ink, borderWidth: 2 } },
    },
  ],
});
Runnable source as JSON, for any HTTP client: https://api.anyplot.ai/specs/rose-basic/echarts/code. Any spec id and library id listed in llms-full.txt fit the same URL shape; every URL below is complete and callable.
{
  "spec_id": "rose-basic",
  "language": "javascript",
  "library": "echarts",
  "page": "https://anyplot.ai/rose-basic/javascript/echarts",
  "hub": "https://anyplot.ai/rose-basic",
  "code_json": "https://api.anyplot.ai/specs/rose-basic/echarts/code",
  "spec_json": "https://api.anyplot.ai/specs/rose-basic",
  "render_light_png": "https://storage.googleapis.com/anyplot-images/plots/rose-basic/javascript/echarts/plot-light.png",
  "render_dark_png": "https://storage.googleapis.com/anyplot-images/plots/rose-basic/javascript/echarts/plot-dark.png",
  "interactive_light_html": "https://storage.googleapis.com/anyplot-images/plots/rose-basic/javascript/echarts/plot-light.html",
  "interactive_dark_html": "https://storage.googleapis.com/anyplot-images/plots/rose-basic/javascript/echarts/plot-dark.html",
  "quality_score": 94.0,
  "license": "MIT",
  "guide": "https://anyplot.ai/llms.txt"
}
Part of Basic Rose Chart on anyplot.ai.