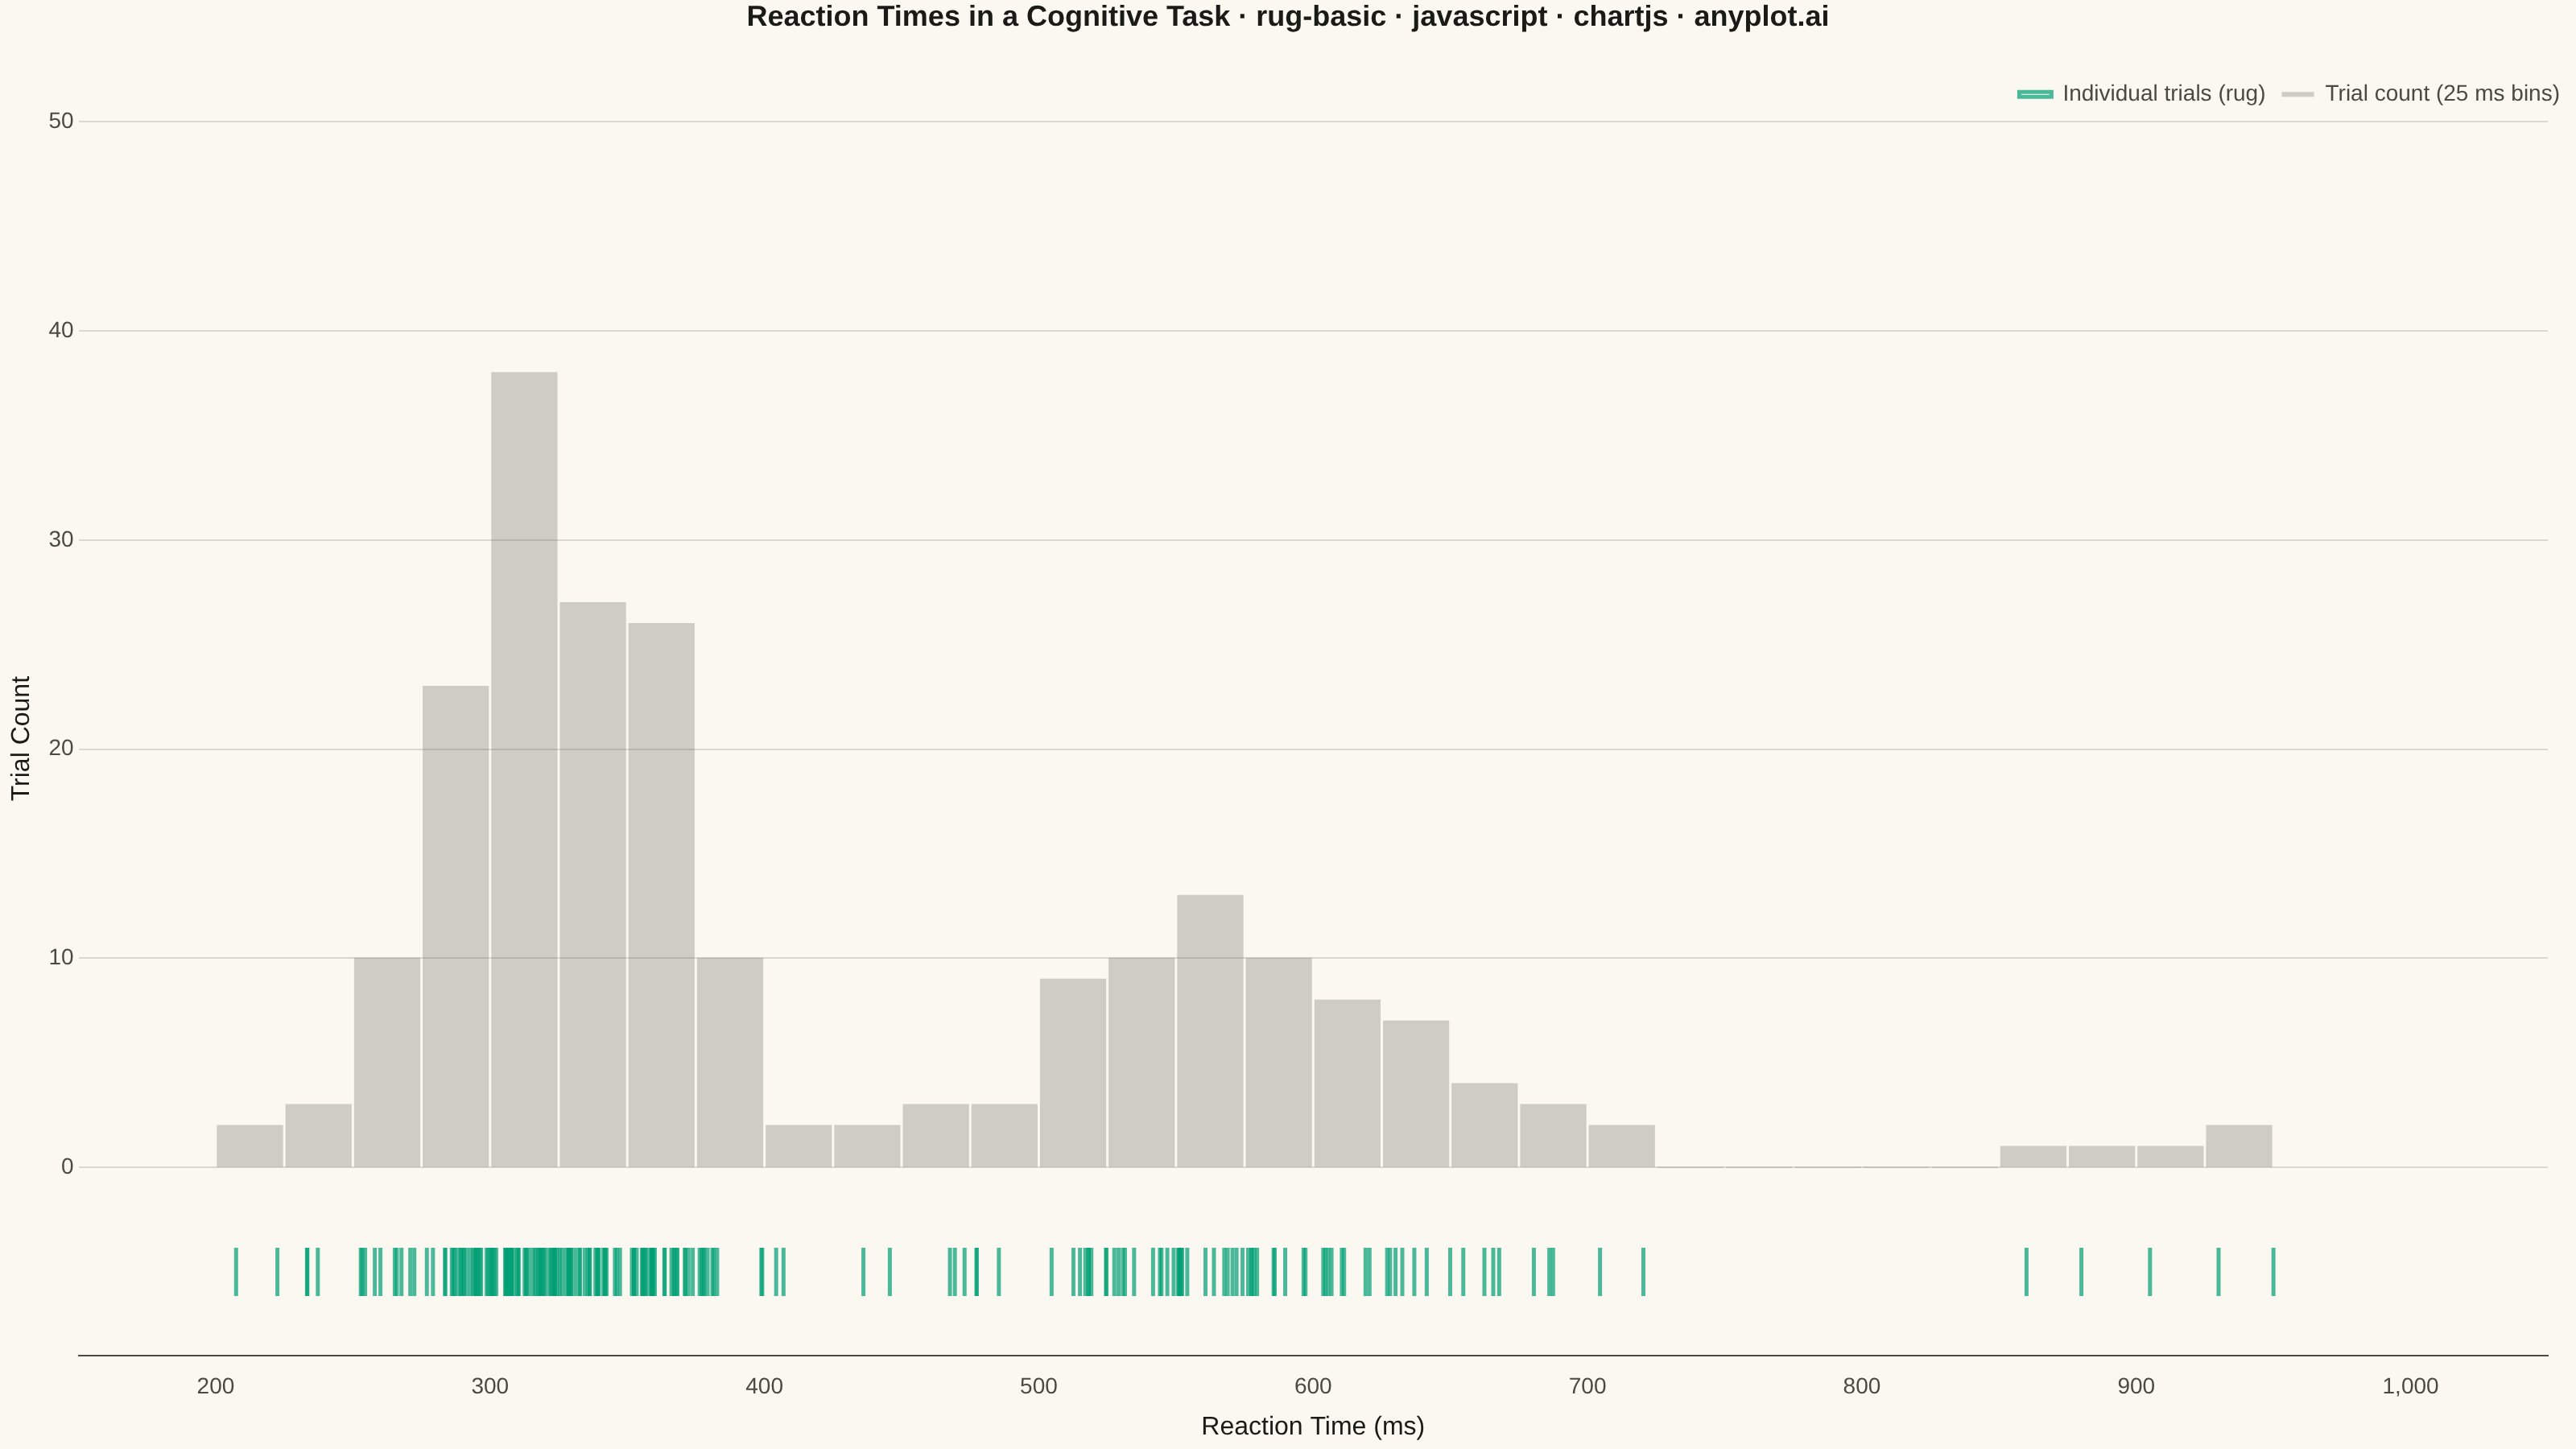
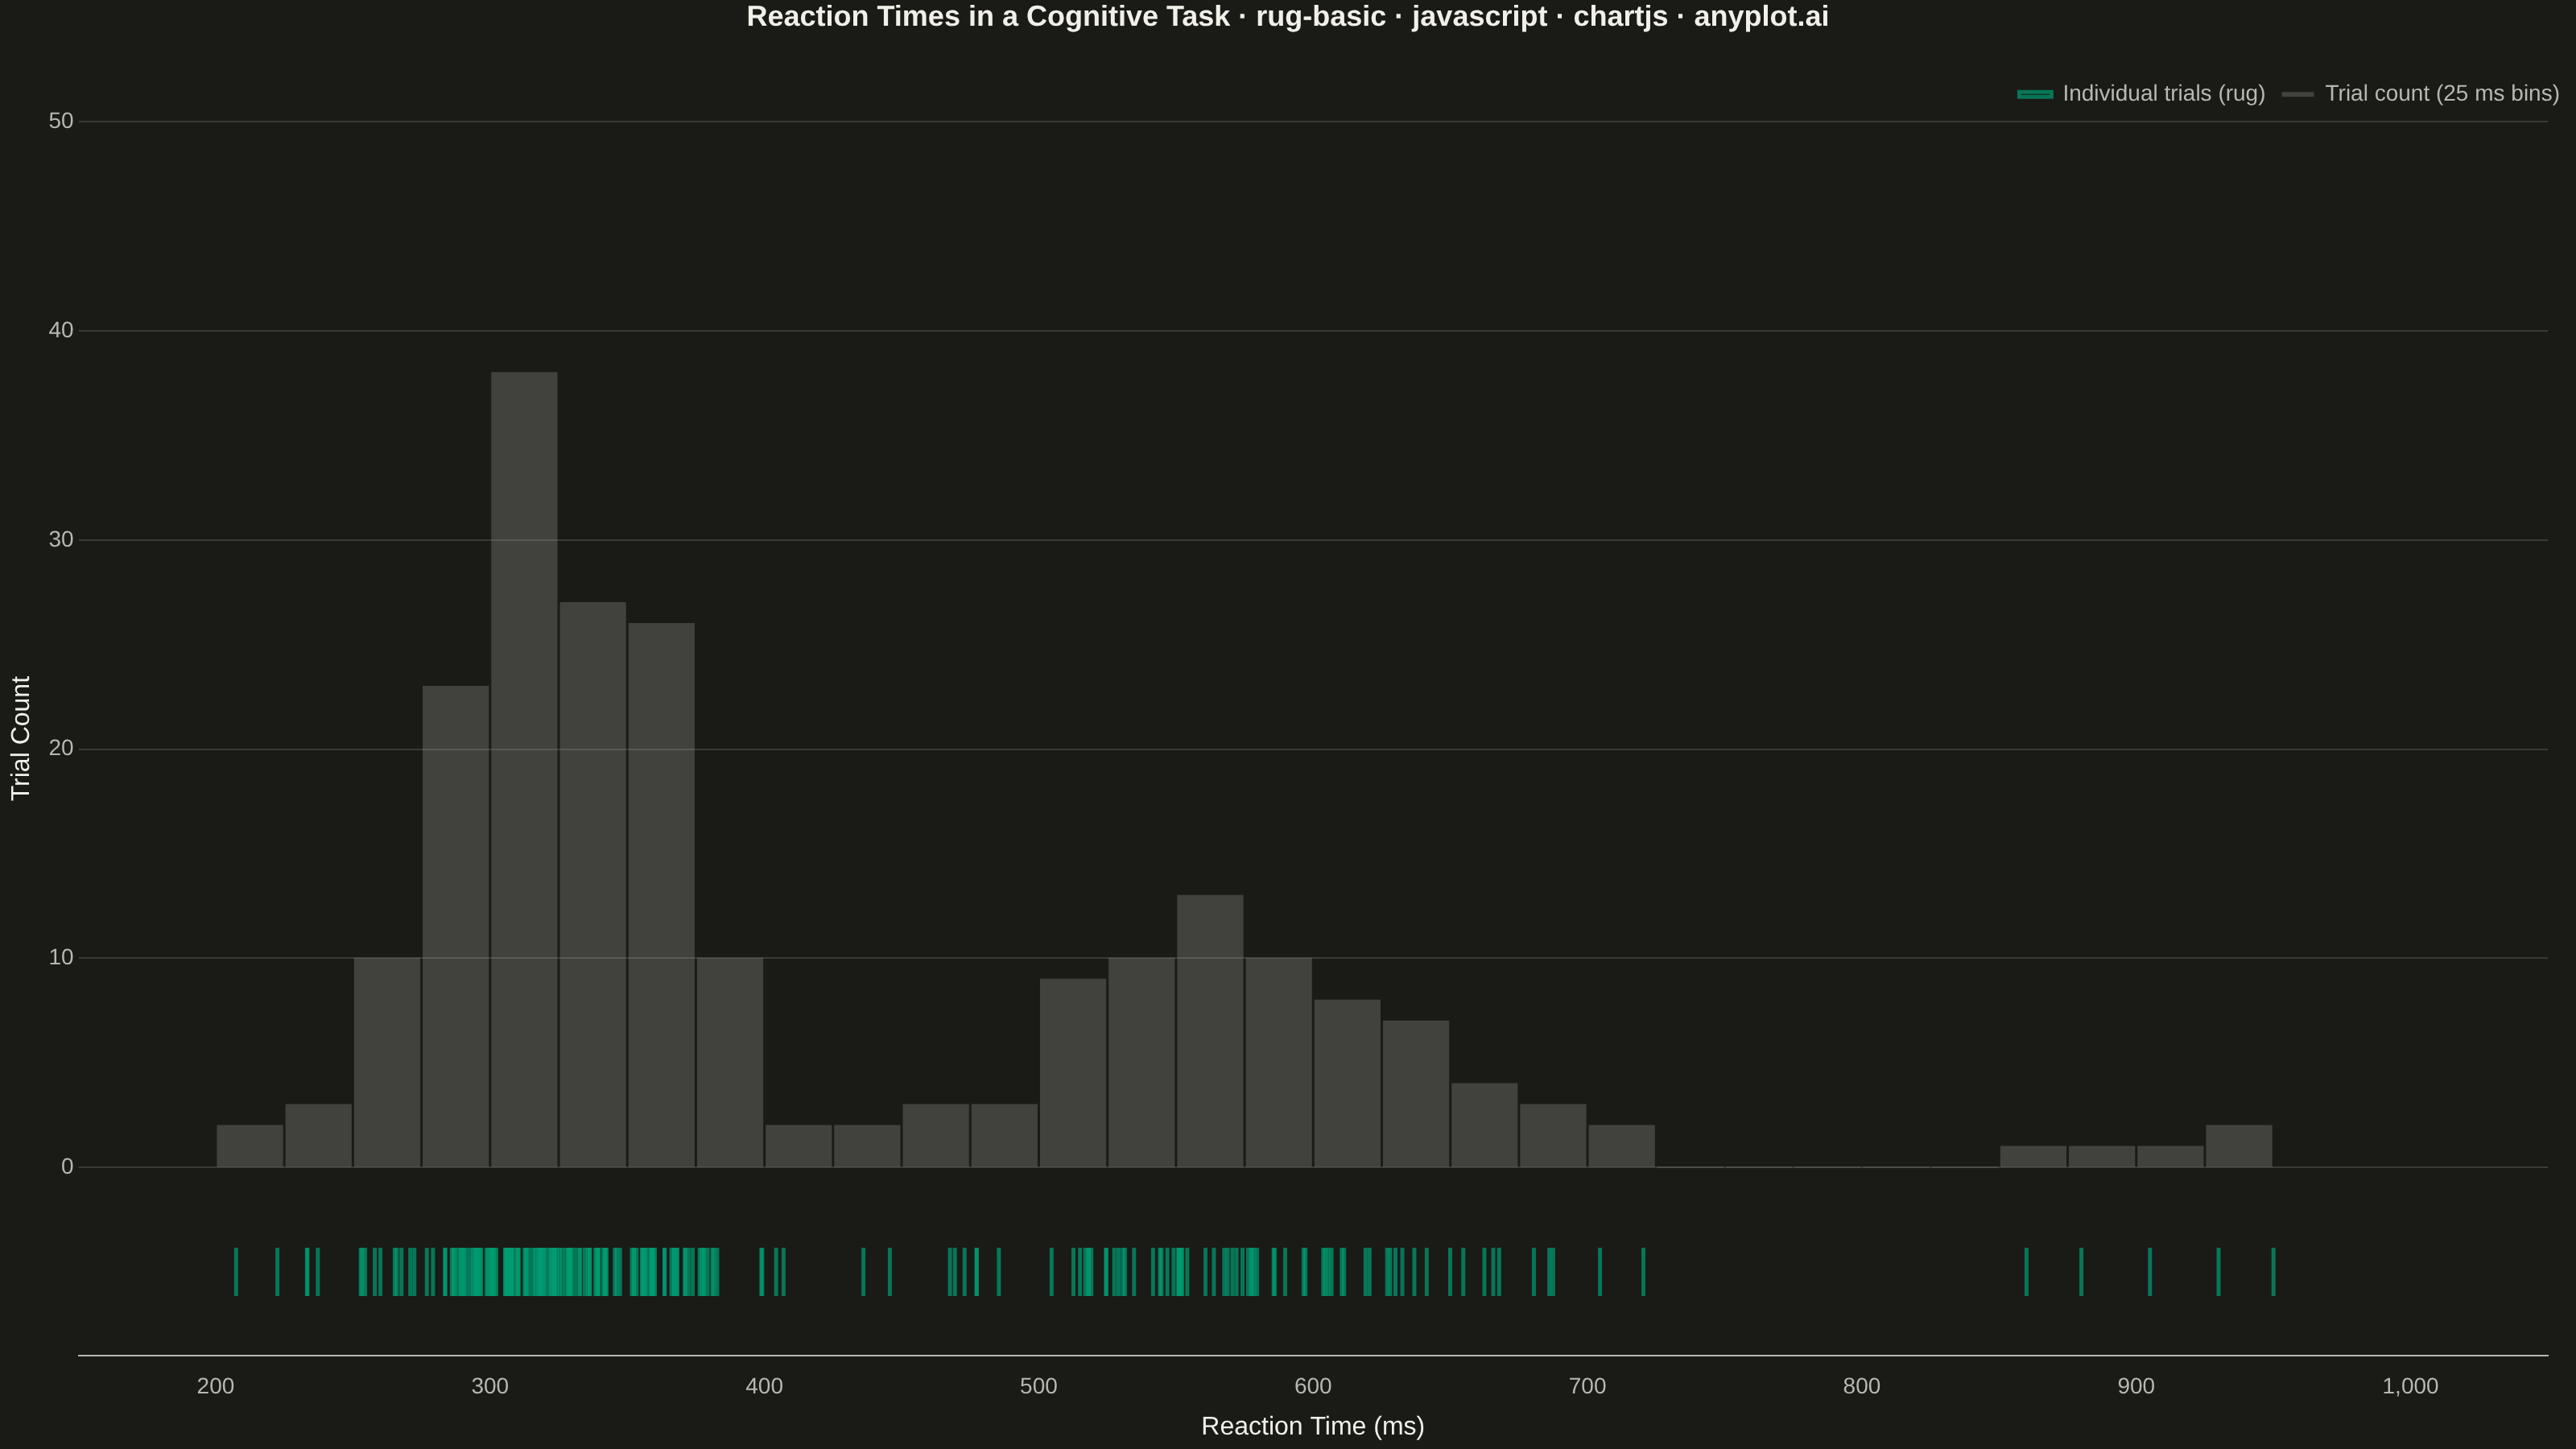
The same plot in 14 other libraries — JavaScript: D3.js, Apache ECharts, Highcharts, MUI X Charts; Python: Altair, Bokeh, lets-plot, Matplotlib, Plotly, plotnine, Pygal, Seaborn; R: ggplot2; Julia: Makie.jl. Compare all 15 side by side: Basic Rug Plot in Python, R, Julia and JavaScript.
A rug plot displays individual data points as small tick marks along an axis, typically at the bottom or side of another plot. Unlike histograms or density plots that bin data, rug plots show the exact location of every observation. They reveal clustering patterns, gaps in data, and the precise distribution of values with minimal visual footprint.
// anyplot.ai
// rug-basic: Basic Rug Plot
// Library: chartjs 4.4.7 | JavaScript 22.23.1
// Quality: 91/100 | Created: 2026-07-25

const t = window.ANYPLOT_TOKENS;

// --- Data (in-memory, deterministic fixed-seed LCG) -------------------------
// Reaction times (ms) from a two-alternative choice task: most responses are
// fast, a slower "lapse" cluster shows attentional dips, and a handful of
// outliers sit far past the main mass. The rug marks the exact position of
// every trial; the translucent histogram behind it gives the shape context
// that binning alone would hide the individual points for.
function lcg(seed) {
  let state = seed >>> 0;
  return function () {
    state = (1664525 * state + 1013904223) >>> 0;
    return state / 4294967296;
  };
}
const rand = lcg(42);
function gaussian(mean, sd) {
  const u1 = Math.max(rand(), 1e-9);
  const u2 = rand();
  const z = Math.sqrt(-2 * Math.log(u1)) * Math.cos(2 * Math.PI * u2);
  return mean + z * sd;
}

const reactionTimes = [];
for (let i = 0; i < 140; i++) reactionTimes.push(Math.max(140, gaussian(320, 42)));
for (let i = 0; i < 75; i++) reactionTimes.push(Math.max(140, gaussian(560, 65)));
reactionTimes.push(880, 905, 930, 860, 950); // slow outliers

const binWidth = 25;
const binStart = Math.floor(Math.min(...reactionTimes) / binWidth) * binWidth;
const binEnd = Math.ceil(Math.max(...reactionTimes) / binWidth) * binWidth;
const binCount = (binEnd - binStart) / binWidth;
const counts = new Array(binCount).fill(0);
reactionTimes.forEach((v) => {
  const idx = Math.min(binCount - 1, Math.floor((v - binStart) / binWidth));
  counts[idx]++;
});
const histogram = counts.map((count, i) => ({ x: binStart + (i + 0.5) * binWidth, y: count }));

const maxCount = Math.max(...counts);
const yMax = Math.ceil((maxCount * 1.15) / 10) * 10;
const yMin = -Math.ceil(maxCount * 0.22);
const rugY = -Math.ceil(maxCount * 0.11);
const rugPoints = reactionTimes.map((v) => ({ x: v, y: rugY }));

// --- Mount -------------------------------------------------------------------
const canvas = document.createElement("canvas");
document.getElementById("container").appendChild(canvas);

// --- Chart ---------------------------------------------------------------
const title = "Reaction Times in a Cognitive Task · rug-basic · javascript · chartjs · anyplot.ai";
const titleFontSize = Math.round(22 * Math.min(1, 67 / title.length));

new Chart(canvas, {
  data: {
    datasets: [
      {
        type: "bar",
        label: "Trial count (25 ms bins)",
        data: histogram,
        backgroundColor: `${t.inkSoft}40`, // translucent context shape, not a data series
        borderWidth: 0,
        barThickness: "flex",
        categoryPercentage: 1.0,
        barPercentage: 0.95,
        order: 2,
      },
      {
        type: "scatter",
        label: "Individual trials (rug)",
        data: rugPoints,
        pointStyle: "line",
        rotation: 90,
        pointRadius: 15,
        borderWidth: 2.5,
        borderColor: `${t.palette[0]}B3`, // brand green, semi-transparent for overlap density
        backgroundColor: "transparent",
        order: 1,
      },
    ],
  },
  options: {
    responsive: true,
    maintainAspectRatio: false,
    animation: false,
    plugins: {
      title: {
        display: true,
        text: title,
        color: t.ink,
        font: { size: titleFontSize },
        padding: { bottom: 20 },
      },
      legend: {
        display: true,
        position: "top",
        align: "end",
        labels: { color: t.inkSoft, font: { size: 14 }, boxWidth: 20, boxHeight: 3 },
      },
      tooltip: { enabled: false },
    },
    scales: {
      x: {
        type: "linear",
        title: { display: true, text: "Reaction Time (ms)", color: t.ink, font: { size: 16 } },
        ticks: { color: t.inkSoft, font: { size: 14 } },
        grid: { display: false },
        border: { color: t.inkSoft },
      },
      y: {
        min: yMin,
        max: yMax,
        title: { display: true, text: "Trial Count", color: t.ink, font: { size: 16 } },
        ticks: {
          color: t.inkSoft,
          font: { size: 14 },
          callback: (value) => (value < 0 ? "" : value),
        },
        grid: { color: t.grid, drawTicks: false },
        border: { display: false },
      },
    },
  },
});
Runnable source as JSON, for any HTTP client: https://api.anyplot.ai/specs/rug-basic/chartjs/code. Any spec id and library id listed in llms-full.txt fit the same URL shape; every URL below is complete and callable.
{
  "spec_id": "rug-basic",
  "language": "javascript",
  "library": "chartjs",
  "page": "https://anyplot.ai/rug-basic/javascript/chartjs",
  "hub": "https://anyplot.ai/rug-basic",
  "code_json": "https://api.anyplot.ai/specs/rug-basic/chartjs/code",
  "spec_json": "https://api.anyplot.ai/specs/rug-basic",
  "render_light_png": "https://storage.googleapis.com/anyplot-images/plots/rug-basic/javascript/chartjs/plot-light.png",
  "render_dark_png": "https://storage.googleapis.com/anyplot-images/plots/rug-basic/javascript/chartjs/plot-dark.png",
  "interactive_light_html": "https://storage.googleapis.com/anyplot-images/plots/rug-basic/javascript/chartjs/plot-light.html",
  "interactive_dark_html": "https://storage.googleapis.com/anyplot-images/plots/rug-basic/javascript/chartjs/plot-dark.html",
  "quality_score": 91.0,
  "license": "MIT",
  "guide": "https://anyplot.ai/llms.txt"
}
Part of Basic Rug Plot on anyplot.ai.