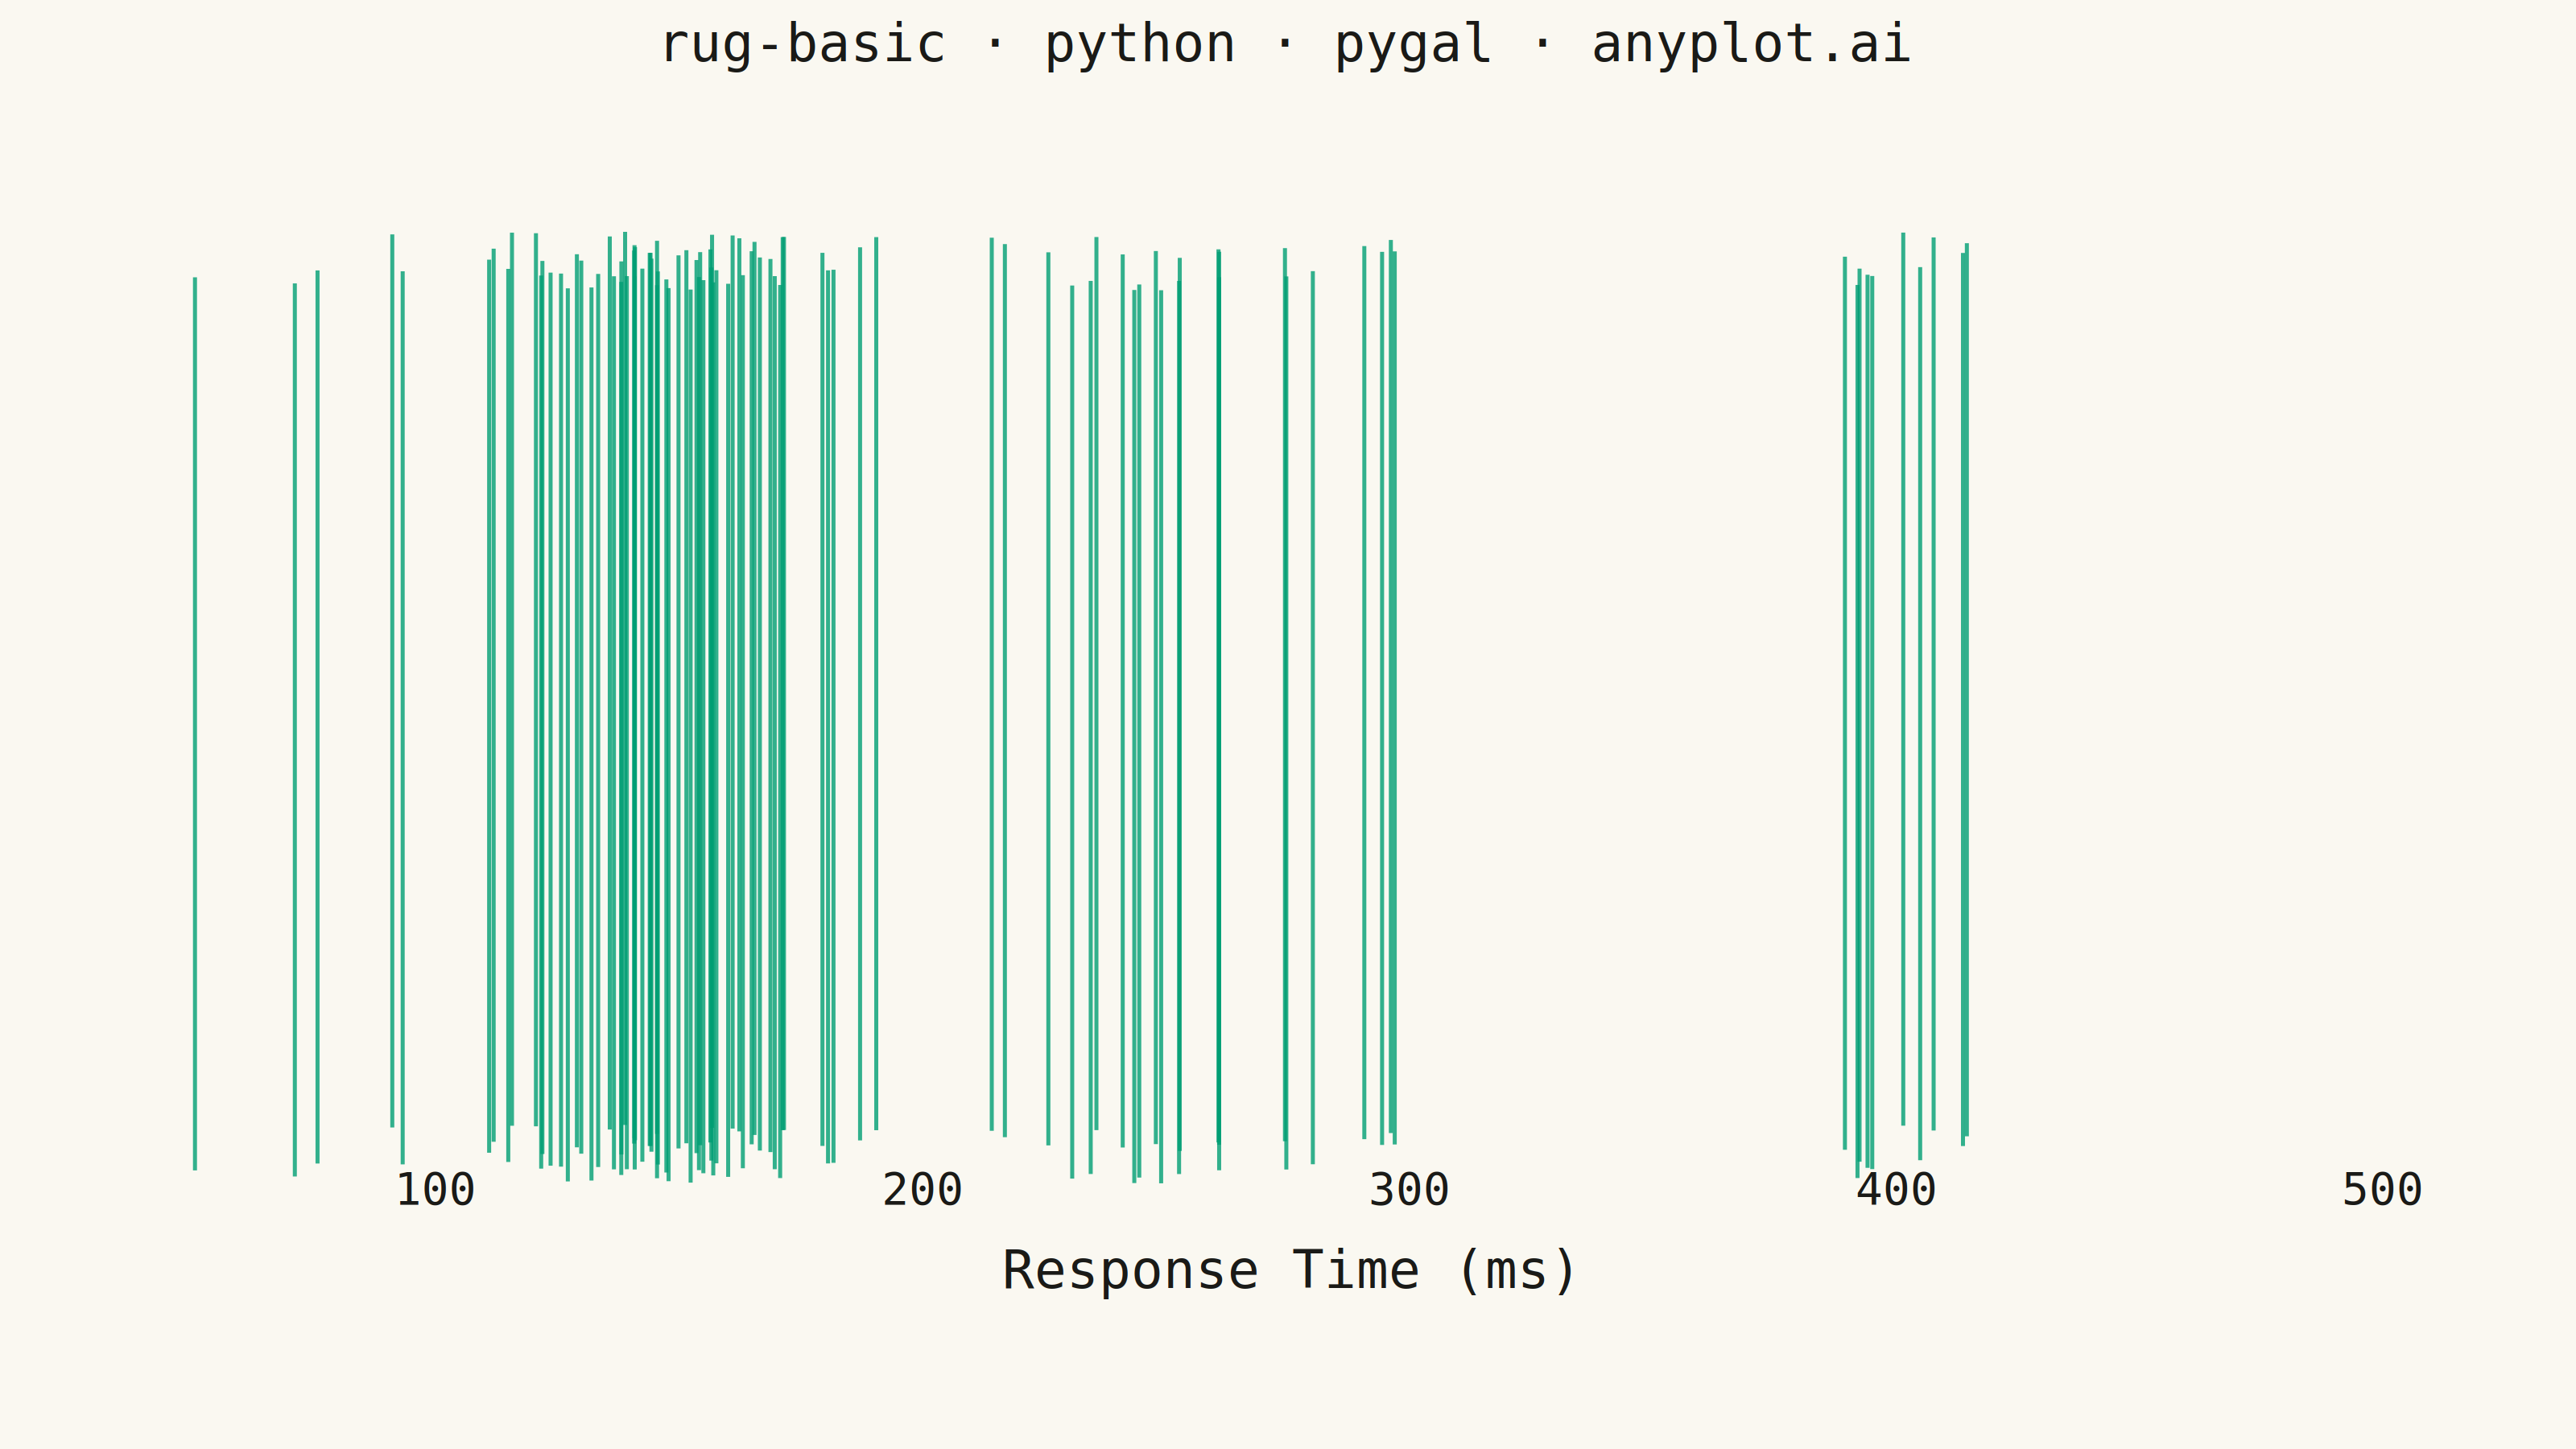
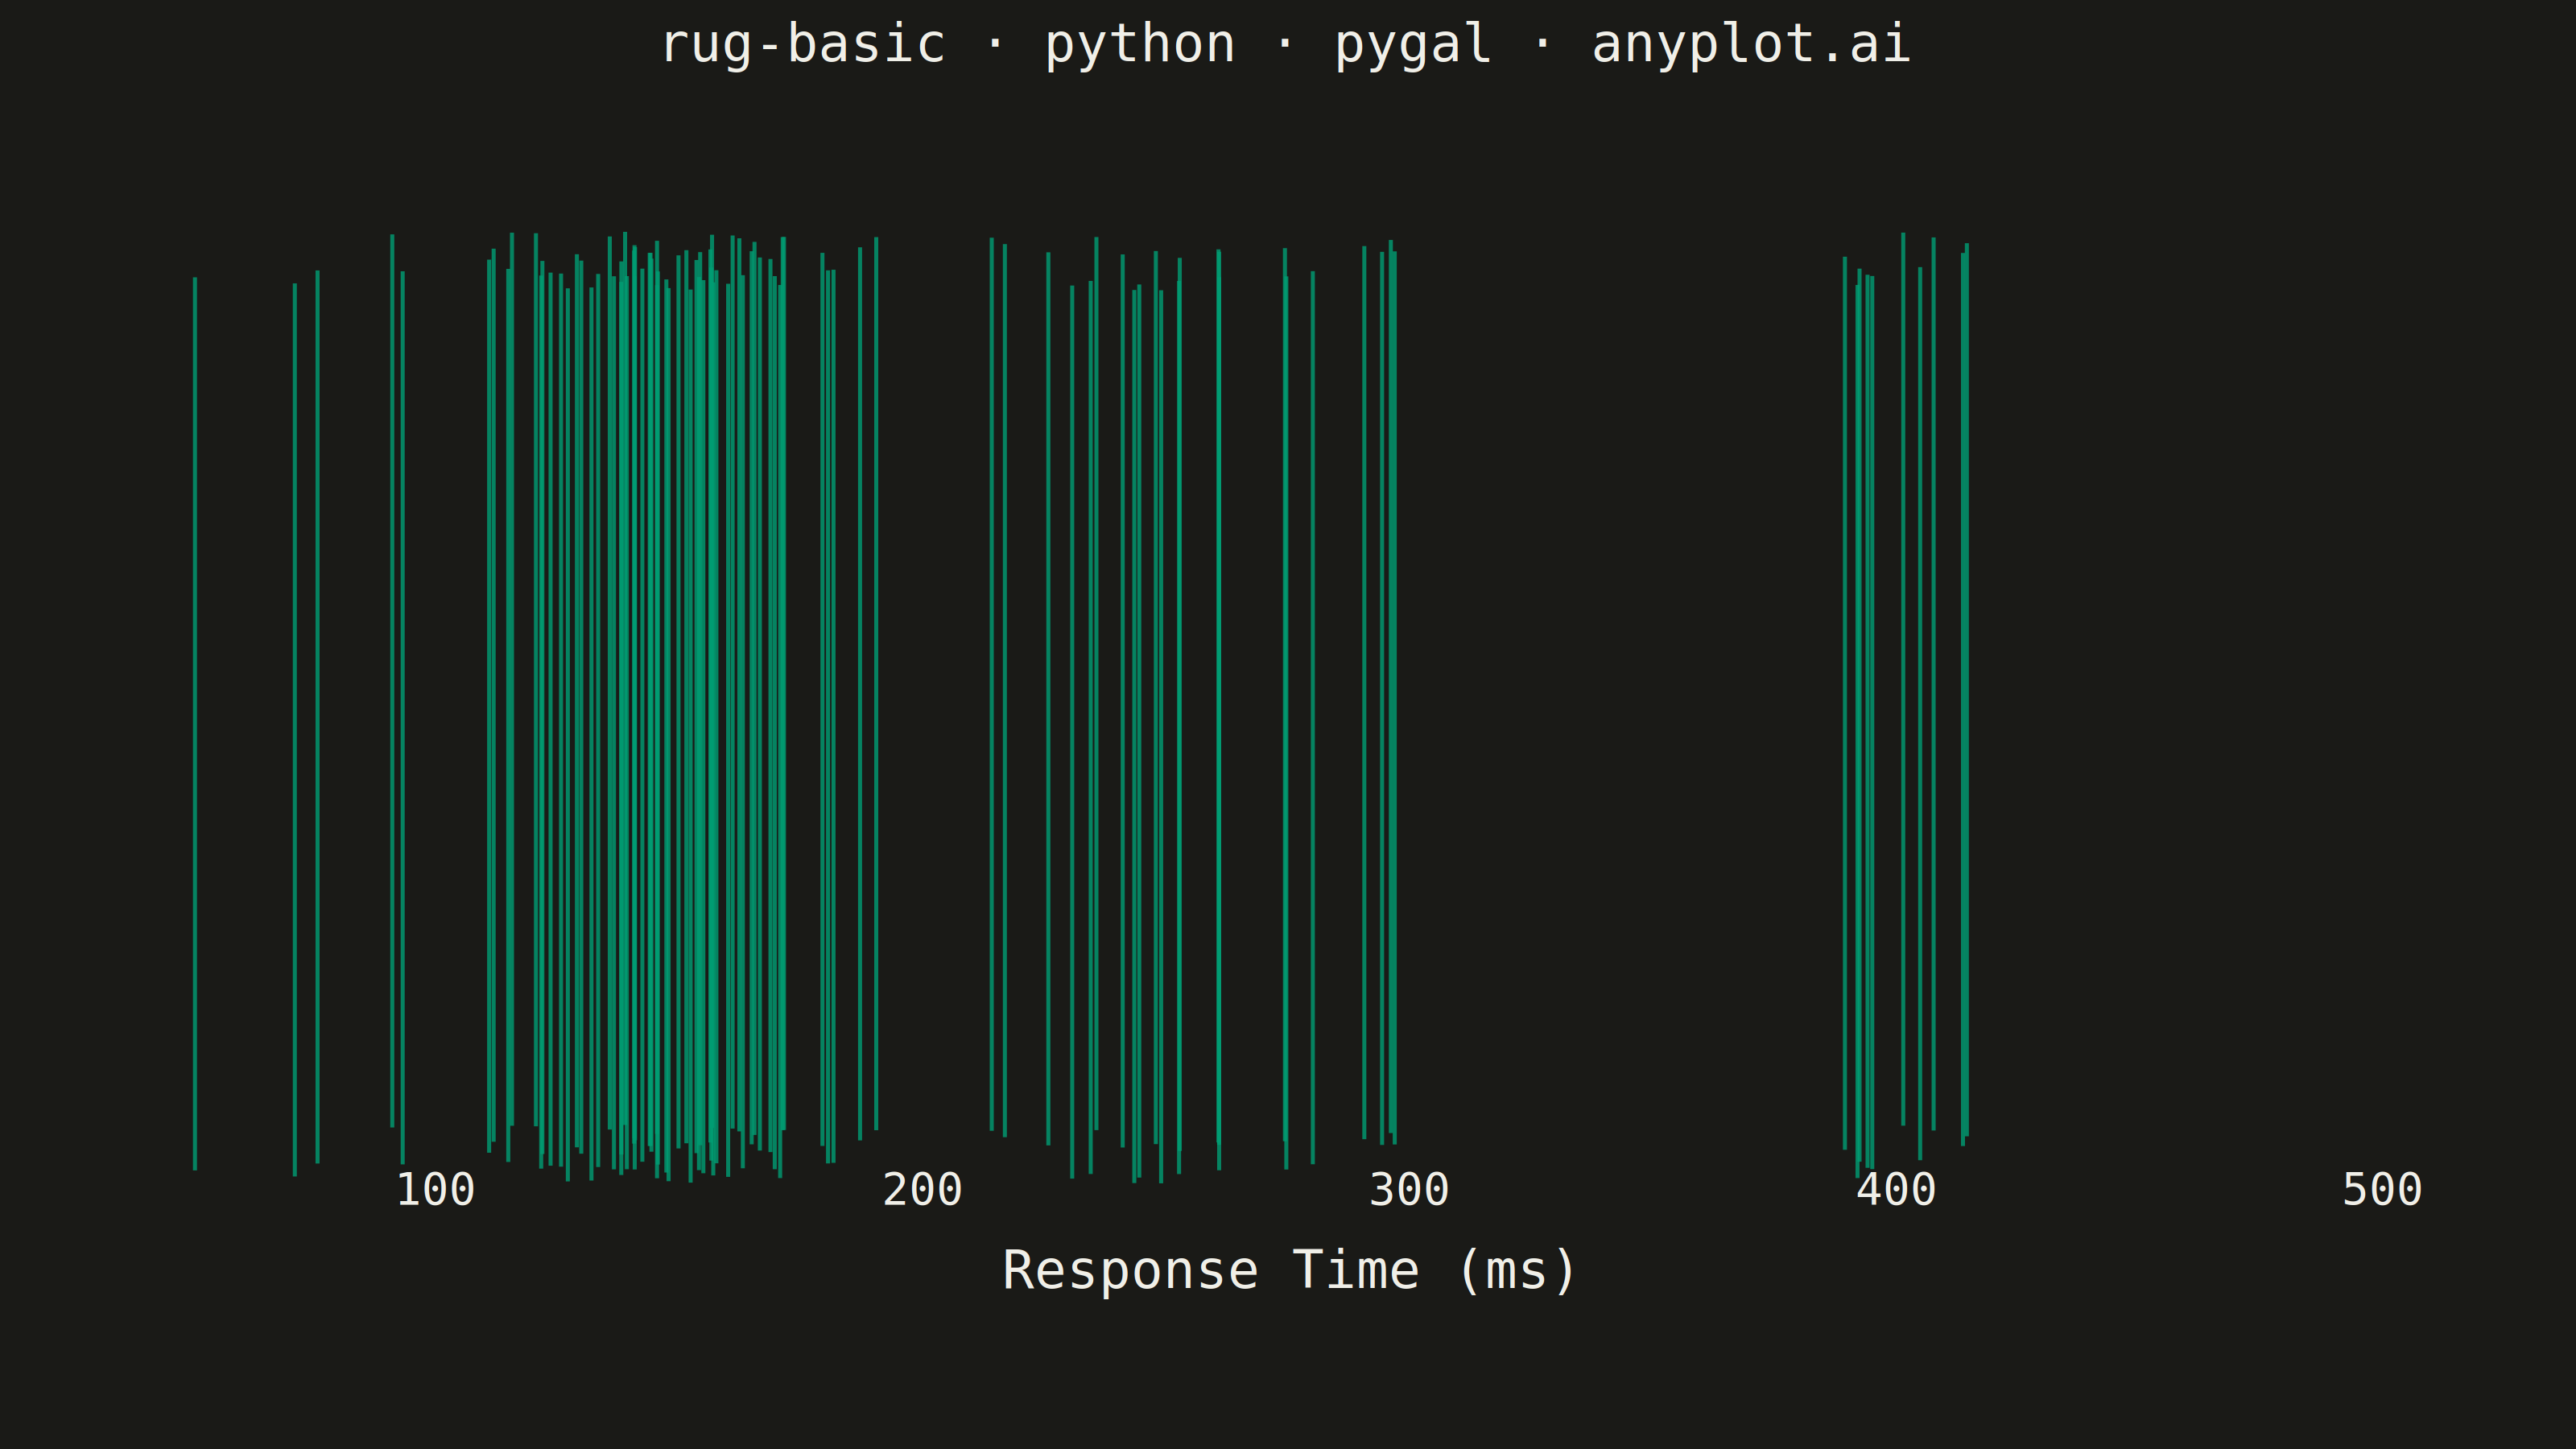
A rug plot displays individual data points as small tick marks along an axis, typically at the bottom or side of another plot. Unlike histograms or density plots that bin data, rug plots show the exact location of every observation. They reveal clustering patterns, gaps in data, and the precise distribution of values with minimal visual footprint.
""" anyplot.ai
rug-basic: Basic Rug Plot
Library: pygal 3.1.3 | Python 3.13.14
Quality: 87/100 | Updated: 2026-07-25
"""

import os
import sys


# Pop script directory so local pygal.py doesn't shadow the installed package
_script_dir = sys.path.pop(0)
import cairosvg
import pygal
from pygal.style import Style


sys.path.insert(0, _script_dir)

import numpy as np


# Theme tokens
THEME = os.getenv("ANYPLOT_THEME", "light")
PAGE_BG = "#FAF8F1" if THEME == "light" else "#1A1A17"
INK = "#1A1A17" if THEME == "light" else "#F0EFE8"
INK_MUTED = "#6B6A63" if THEME == "light" else "#A8A79F"
BRAND = "#009E73"  # Imprint palette position 1

# Data - API response times (ms) with realistic multi-modal distribution
np.random.seed(42)
values = np.concatenate(
    [
        np.random.normal(150, 20, 60),  # Typical fast responses
        np.random.normal(250, 30, 25),  # Medium responses
        np.random.normal(400, 15, 10),  # Slow outlier cluster
        np.random.uniform(50, 100, 5),  # Very fast cache hits
    ]
)
values = np.clip(values, 30, 500)
values = np.sort(values)

# Small vertical jitter (tick length stays fixed, only the baseline shifts) so
# overlapping ticks in the densest cluster stay visually separable instead of
# fusing into one solid block, while adding a subtle non-default texture.
jitter = np.random.uniform(-0.003, 0.003, size=len(values))

# Style - each rug tick is added as its own series (pygal has no native rug
# mark), so the color tuple must repeat brand green once per point. Pygal
# auto-darkens colors when the list runs out (`Style.get_colors`), which would
# otherwise fade the ticks from green toward black across the x-axis.
custom_style = Style(
    background=PAGE_BG,
    plot_background=PAGE_BG,
    foreground=INK,
    foreground_strong=INK,
    foreground_subtle=INK_MUTED,
    colors=(BRAND,) * len(values),
    title_font_size=66,
    label_font_size=56,
    major_label_font_size=44,
    legend_font_size=44,
    value_font_size=36,
    stroke_width=5,
    opacity=0.7,
)

# Plot - XY chart used as rug plot
chart = pygal.XY(
    width=3200,
    height=1800,
    style=custom_style,
    title="rug-basic · python · pygal · anyplot.ai",
    x_title="Response Time (ms)",
    y_title=None,
    show_legend=False,
    show_dots=False,
    stroke=True,
    show_x_guides=False,
    show_y_guides=False,
    show_y_labels=False,
    print_values=False,
    explicit_size=True,
    margin=60,
    margin_top=100,
    margin_bottom=200,
    xrange=(30, 520),
    range=(0, 0.1),
)

# Rug ticks - short vertical marks along the x-axis, filling most of the range.
# Tick length stays fixed (0.09); only the baseline is jittered per point.
tick_length = 0.09

for val, dy in zip(values, jitter, strict=True):
    chart.add(
        f"{val:.1f} ms", [(float(val), dy), (float(val), dy + tick_length)], stroke_style={"width": 5}, show_dots=False
    )

# Post-process SVG: pygal draws a full border rect around the plot area with no
# built-in option to suppress it, so hide the rect stroke via CSS injection.
# It also draws a full-height axis baseline (`.axis.x path.line`) at the plot's
# left edge regardless of the data range, which floats above the jittered tick
# band - suppress every path in the x-axis group the same way.
_svg = chart.render()
_frame_css = (
    b'<style type="text/css">'
    b".graph .plot .background{stroke:none!important}"
    b".graph .plot rect.background{stroke:none!important}"
    b".graph .axis.x path{stroke:none!important}"
    b"</style>"
)
_svg_patched = (
    _svg.replace(b"</defs>", _frame_css + b"</defs>", 1)
    if b"</defs>" in _svg
    else _svg.replace(b"</svg>", _frame_css + b"</svg>", 1)
)

# Save
cairosvg.svg2png(bytestring=_svg_patched, write_to=f"plot-{THEME}.png")
with open(f"plot-{THEME}.html", "wb") as f:
    f.write(_svg_patched)
Runnable source as JSON, for any HTTP client: https://api.anyplot.ai/specs/rug-basic/pygal/code. Any spec id and library id listed in llms-full.txt fit the same URL shape; every URL below is complete and callable.
{
  "spec_id": "rug-basic",
  "language": "python",
  "library": "pygal",
  "page": "https://anyplot.ai/rug-basic/python/pygal",
  "hub": "https://anyplot.ai/rug-basic",
  "code_json": "https://api.anyplot.ai/specs/rug-basic/pygal/code",
  "spec_json": "https://api.anyplot.ai/specs/rug-basic",
  "render_light_png": "https://storage.googleapis.com/anyplot-images/plots/rug-basic/python/pygal/plot-light.png",
  "render_dark_png": "https://storage.googleapis.com/anyplot-images/plots/rug-basic/python/pygal/plot-dark.png",
  "interactive_light_html": "https://storage.googleapis.com/anyplot-images/plots/rug-basic/python/pygal/plot-light.html",
  "interactive_dark_html": "https://storage.googleapis.com/anyplot-images/plots/rug-basic/python/pygal/plot-dark.html",
  "quality_score": 87.0,
  "license": "MIT",
  "guide": "https://anyplot.ai/llms.txt"
}
Part of Basic Rug Plot on anyplot.ai.