The same plot in 14 other libraries — Python: Altair, Bokeh, lets-plot, Matplotlib, Plotly, plotnine, Pygal, Seaborn; Julia: Makie.jl; JavaScript: Chart.js, D3.js, Apache ECharts, Highcharts, MUI X Charts. Compare all 15 side by side: Basic Rug Plot in Python, R, Julia and JavaScript.
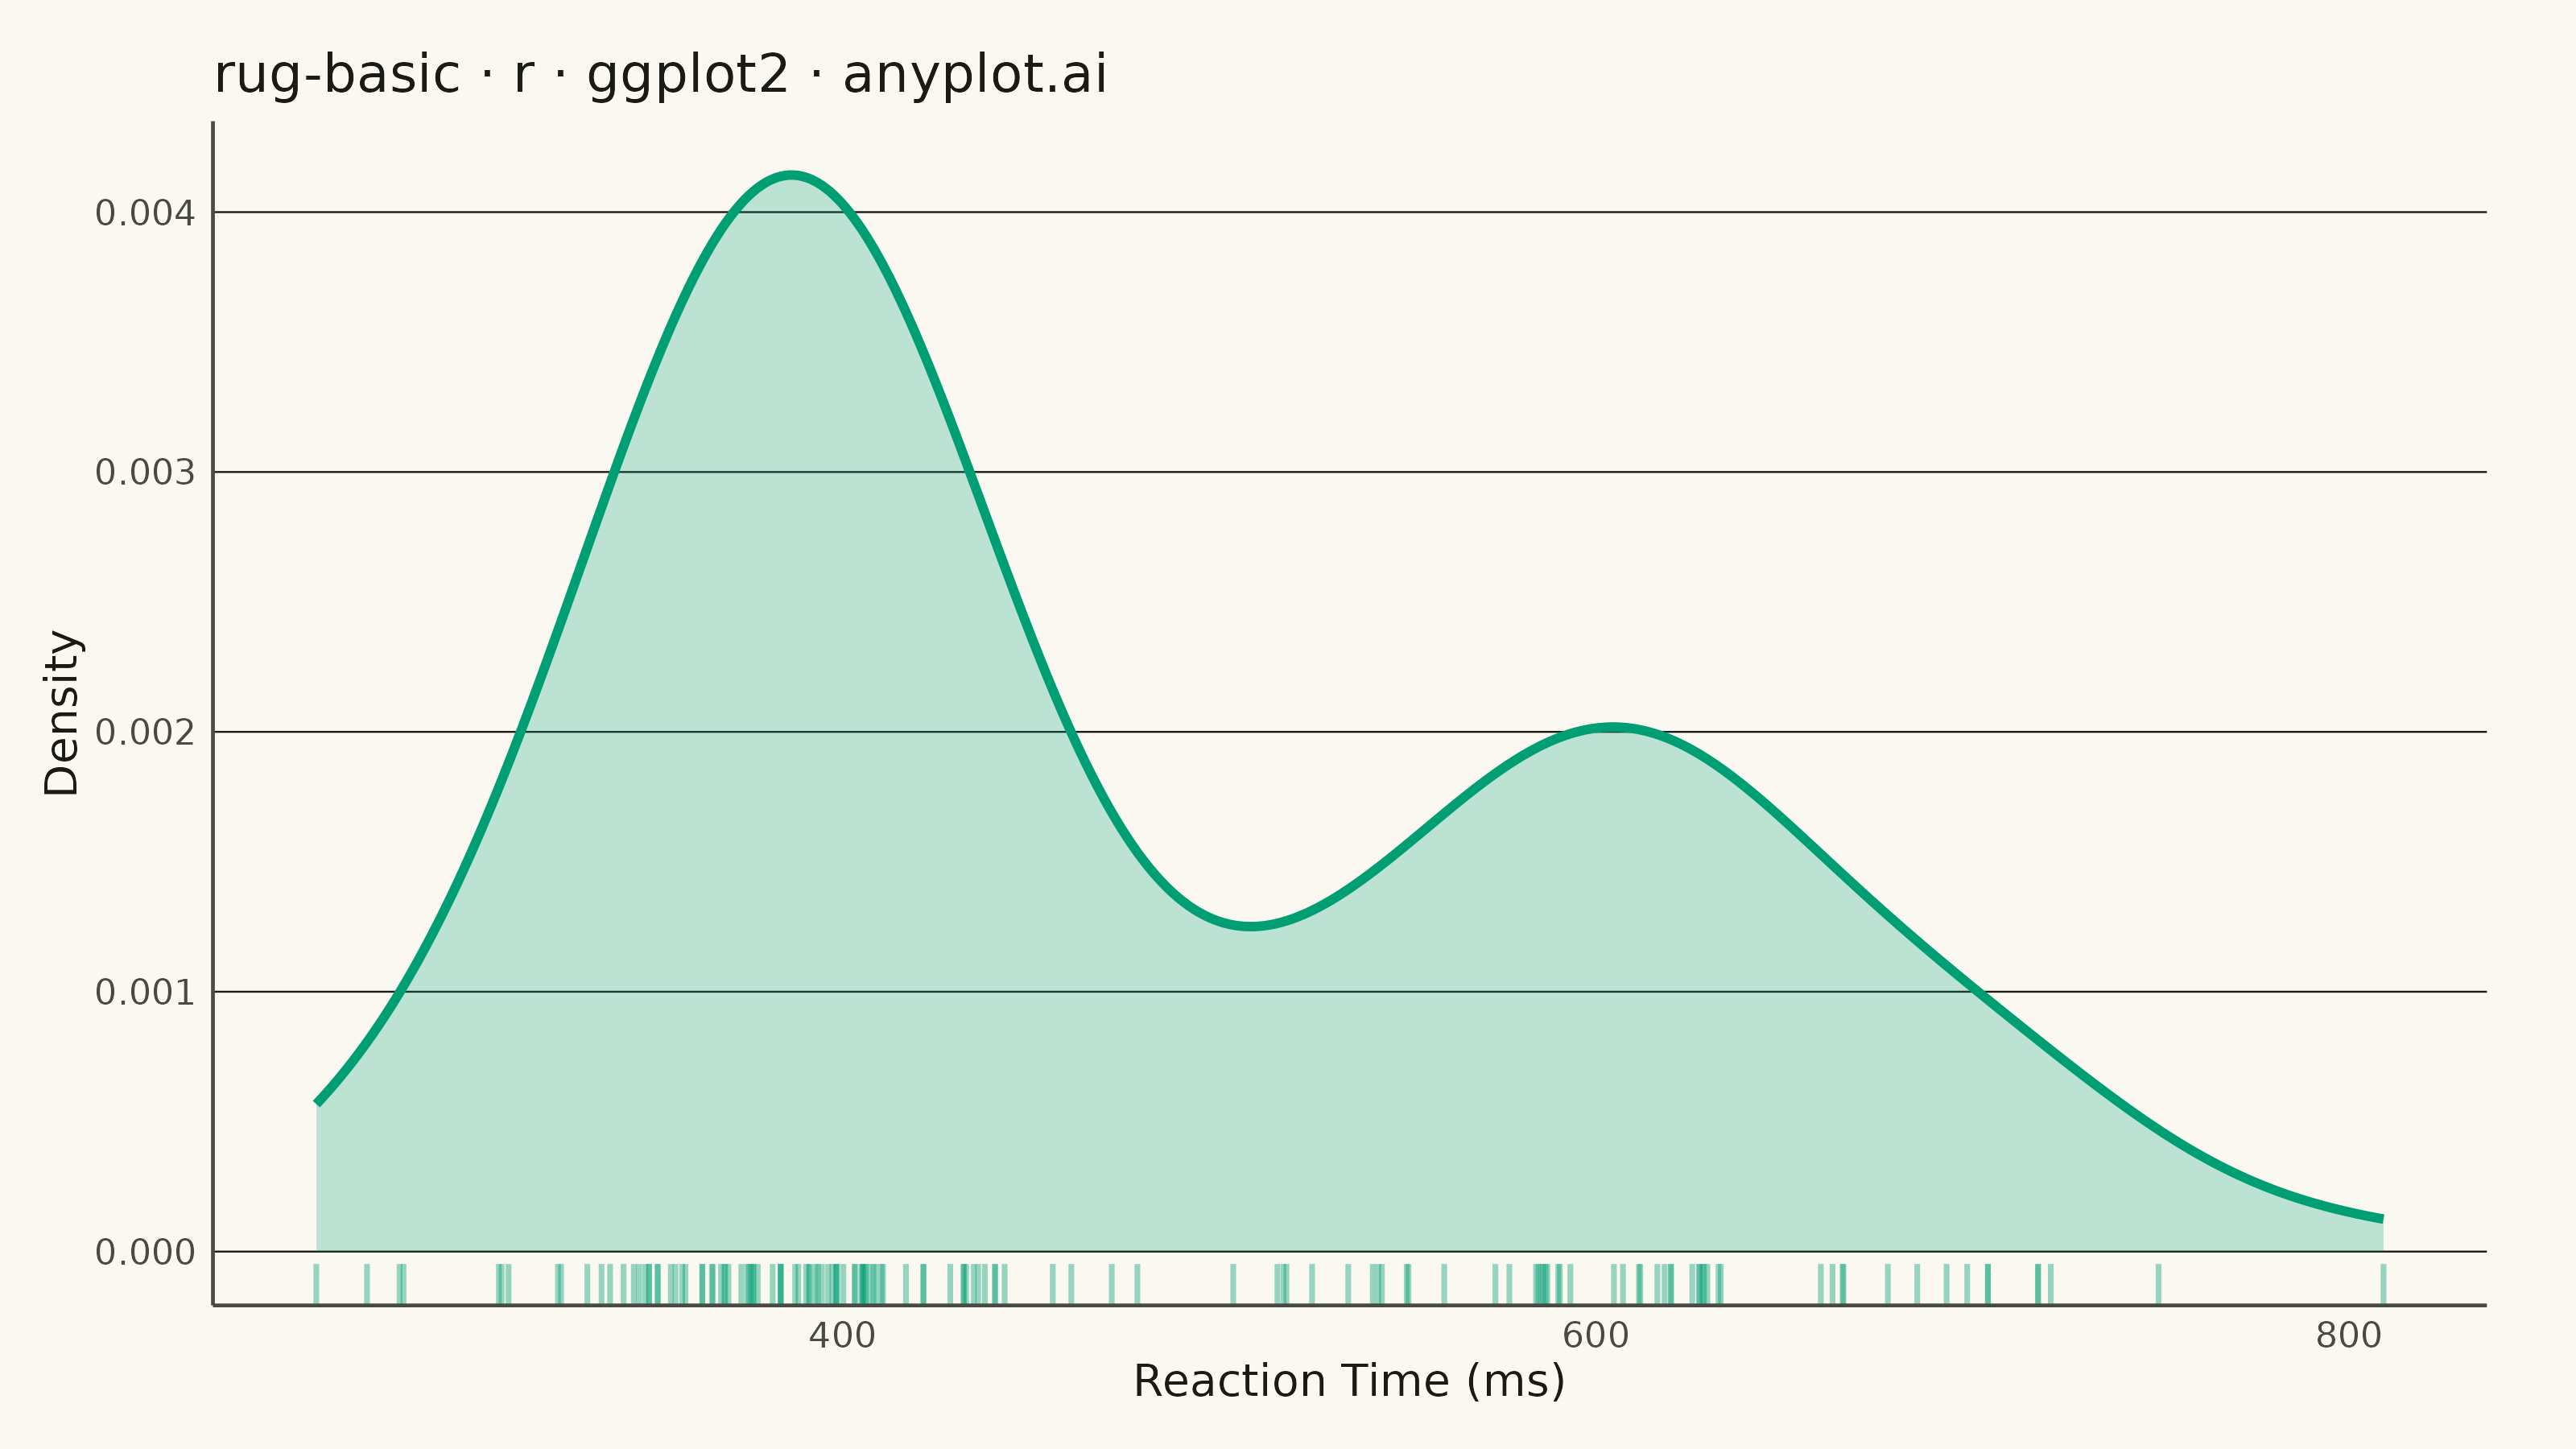
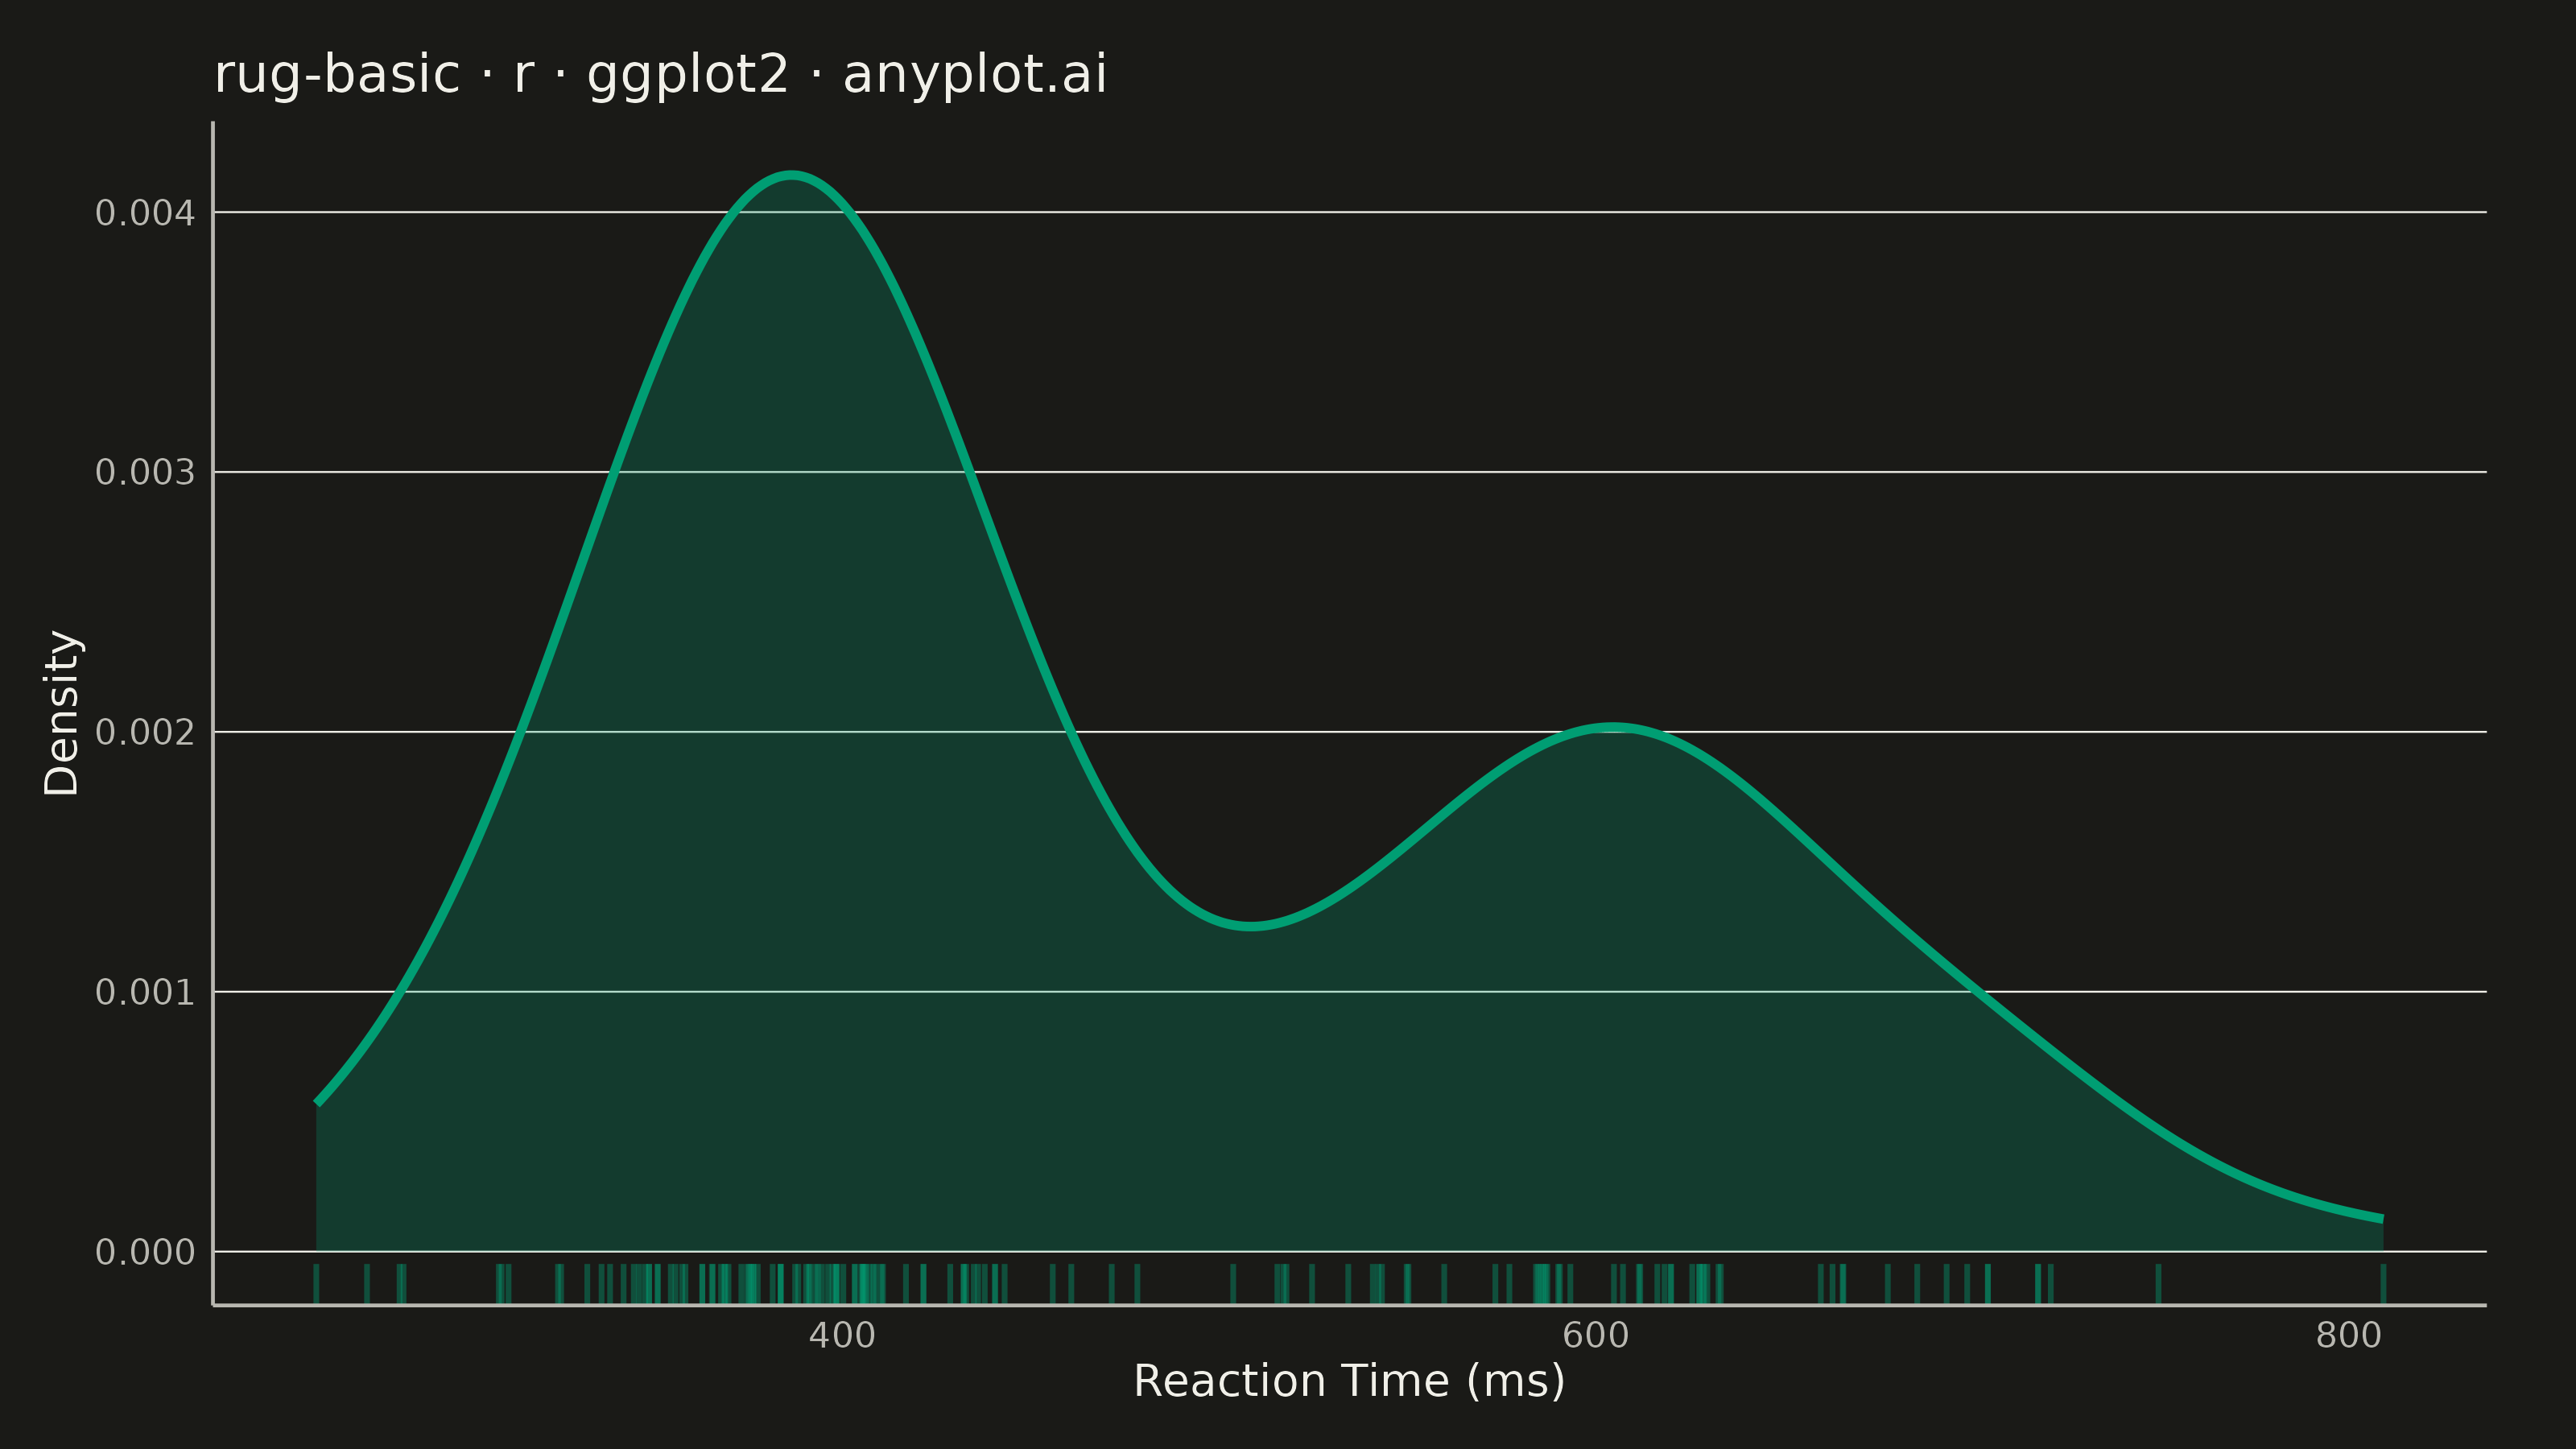
A rug plot displays individual data points as small tick marks along an axis, typically at the bottom or side of another plot. Unlike histograms or density plots that bin data, rug plots show the exact location of every observation. They reveal clustering patterns, gaps in data, and the precise distribution of values with minimal visual footprint.
#' anyplot.ai
#' rug-basic: Basic Rug Plot
#' Library: ggplot2 3.5.1 | R 4.4.1
#' Quality: 86/100 | Created: 2026-07-25

library(ggplot2)
library(tibble)
library(ragg)

set.seed(42)

# --- Theme tokens -------------------------------------------------------
THEME     <- Sys.getenv("ANYPLOT_THEME", "light")
PAGE_BG   <- if (THEME == "light") "#FAF8F1" else "#1A1A17"
INK       <- if (THEME == "light") "#1A1A17" else "#F0EFE8"
INK_SOFT  <- if (THEME == "light") "#4A4A44" else "#B8B7B0"
INK_FAINT <- if (THEME == "light") "#1A1A1726" else "#F0EFE826"  # INK at ~15% alpha, for gridlines

IMPRINT_PALETTE <- c(
  "#009E73", "#C475FD", "#4467A3", "#BD8233",
  "#AE3030", "#2ABCCD", "#954477", "#99B314"
)
BRAND <- IMPRINT_PALETTE[1]

# --- Data -----------------------------------------------------------------
# Reaction times from a cognitive test: a fast, practiced group and a
# slower, hesitant group combine into a bimodal distribution. The rug
# marks reveal that clustering directly, something the smooth density
# curve alone would blur into a single wide hump.
reaction_ms <- c(
  rnorm(85, mean = 380, sd = 40),
  rnorm(55, mean = 620, sd = 70)
)
df <- tibble(reaction_ms = reaction_ms)

# --- Plot -------------------------------------------------------------------
p <- ggplot(df, aes(x = reaction_ms)) +
  geom_density(fill = BRAND, color = BRAND, alpha = 0.25, linewidth = 1.0) +
  geom_rug(
    sides     = "b",
    color     = BRAND,
    alpha     = 0.3,
    linewidth = 0.6,
    length    = unit(0.035, "npc")
  ) +
  labs(
    title = "rug-basic · r · ggplot2 · anyplot.ai",
    x     = "Reaction Time (ms)",
    y     = "Density"
  ) +
  theme_minimal(base_size = 8) +
  theme(
    plot.background     = element_rect(fill = PAGE_BG, color = PAGE_BG),
    panel.background    = element_rect(fill = PAGE_BG, color = NA),
    panel.grid.major.x  = element_blank(),
    panel.grid.minor    = element_blank(),
    panel.grid.major.y  = element_line(color = INK_FAINT, linewidth = 0.2),
    axis.line           = element_line(color = INK_SOFT, linewidth = 0.4),
    axis.title          = element_text(color = INK, size = 10),
    axis.text           = element_text(color = INK_SOFT, size = 8),
    plot.title          = element_text(color = INK, size = 12),
    plot.margin         = margin(t = 12, r = 20, b = 10, l = 10)
  )

# --- Save -------------------------------------------------------------------
ggsave(
  filename = sprintf("plot-%s.png", THEME),
  plot     = p,
  device   = ragg::agg_png,
  width    = 8,
  height   = 4.5,
  units    = "in",
  dpi      = 400
)
Runnable source as JSON, for any HTTP client: https://api.anyplot.ai/specs/rug-basic/ggplot2/code. Any spec id and library id listed in llms-full.txt fit the same URL shape; every URL below is complete and callable.
{
  "spec_id": "rug-basic",
  "language": "r",
  "library": "ggplot2",
  "page": "https://anyplot.ai/rug-basic/r/ggplot2",
  "hub": "https://anyplot.ai/rug-basic",
  "code_json": "https://api.anyplot.ai/specs/rug-basic/ggplot2/code",
  "spec_json": "https://api.anyplot.ai/specs/rug-basic",
  "render_light_png": "https://storage.googleapis.com/anyplot-images/plots/rug-basic/r/ggplot2/plot-light.png",
  "render_dark_png": "https://storage.googleapis.com/anyplot-images/plots/rug-basic/r/ggplot2/plot-dark.png",
  "quality_score": 86.0,
  "license": "MIT",
  "guide": "https://anyplot.ai/llms.txt"
}
Part of Basic Rug Plot on anyplot.ai.