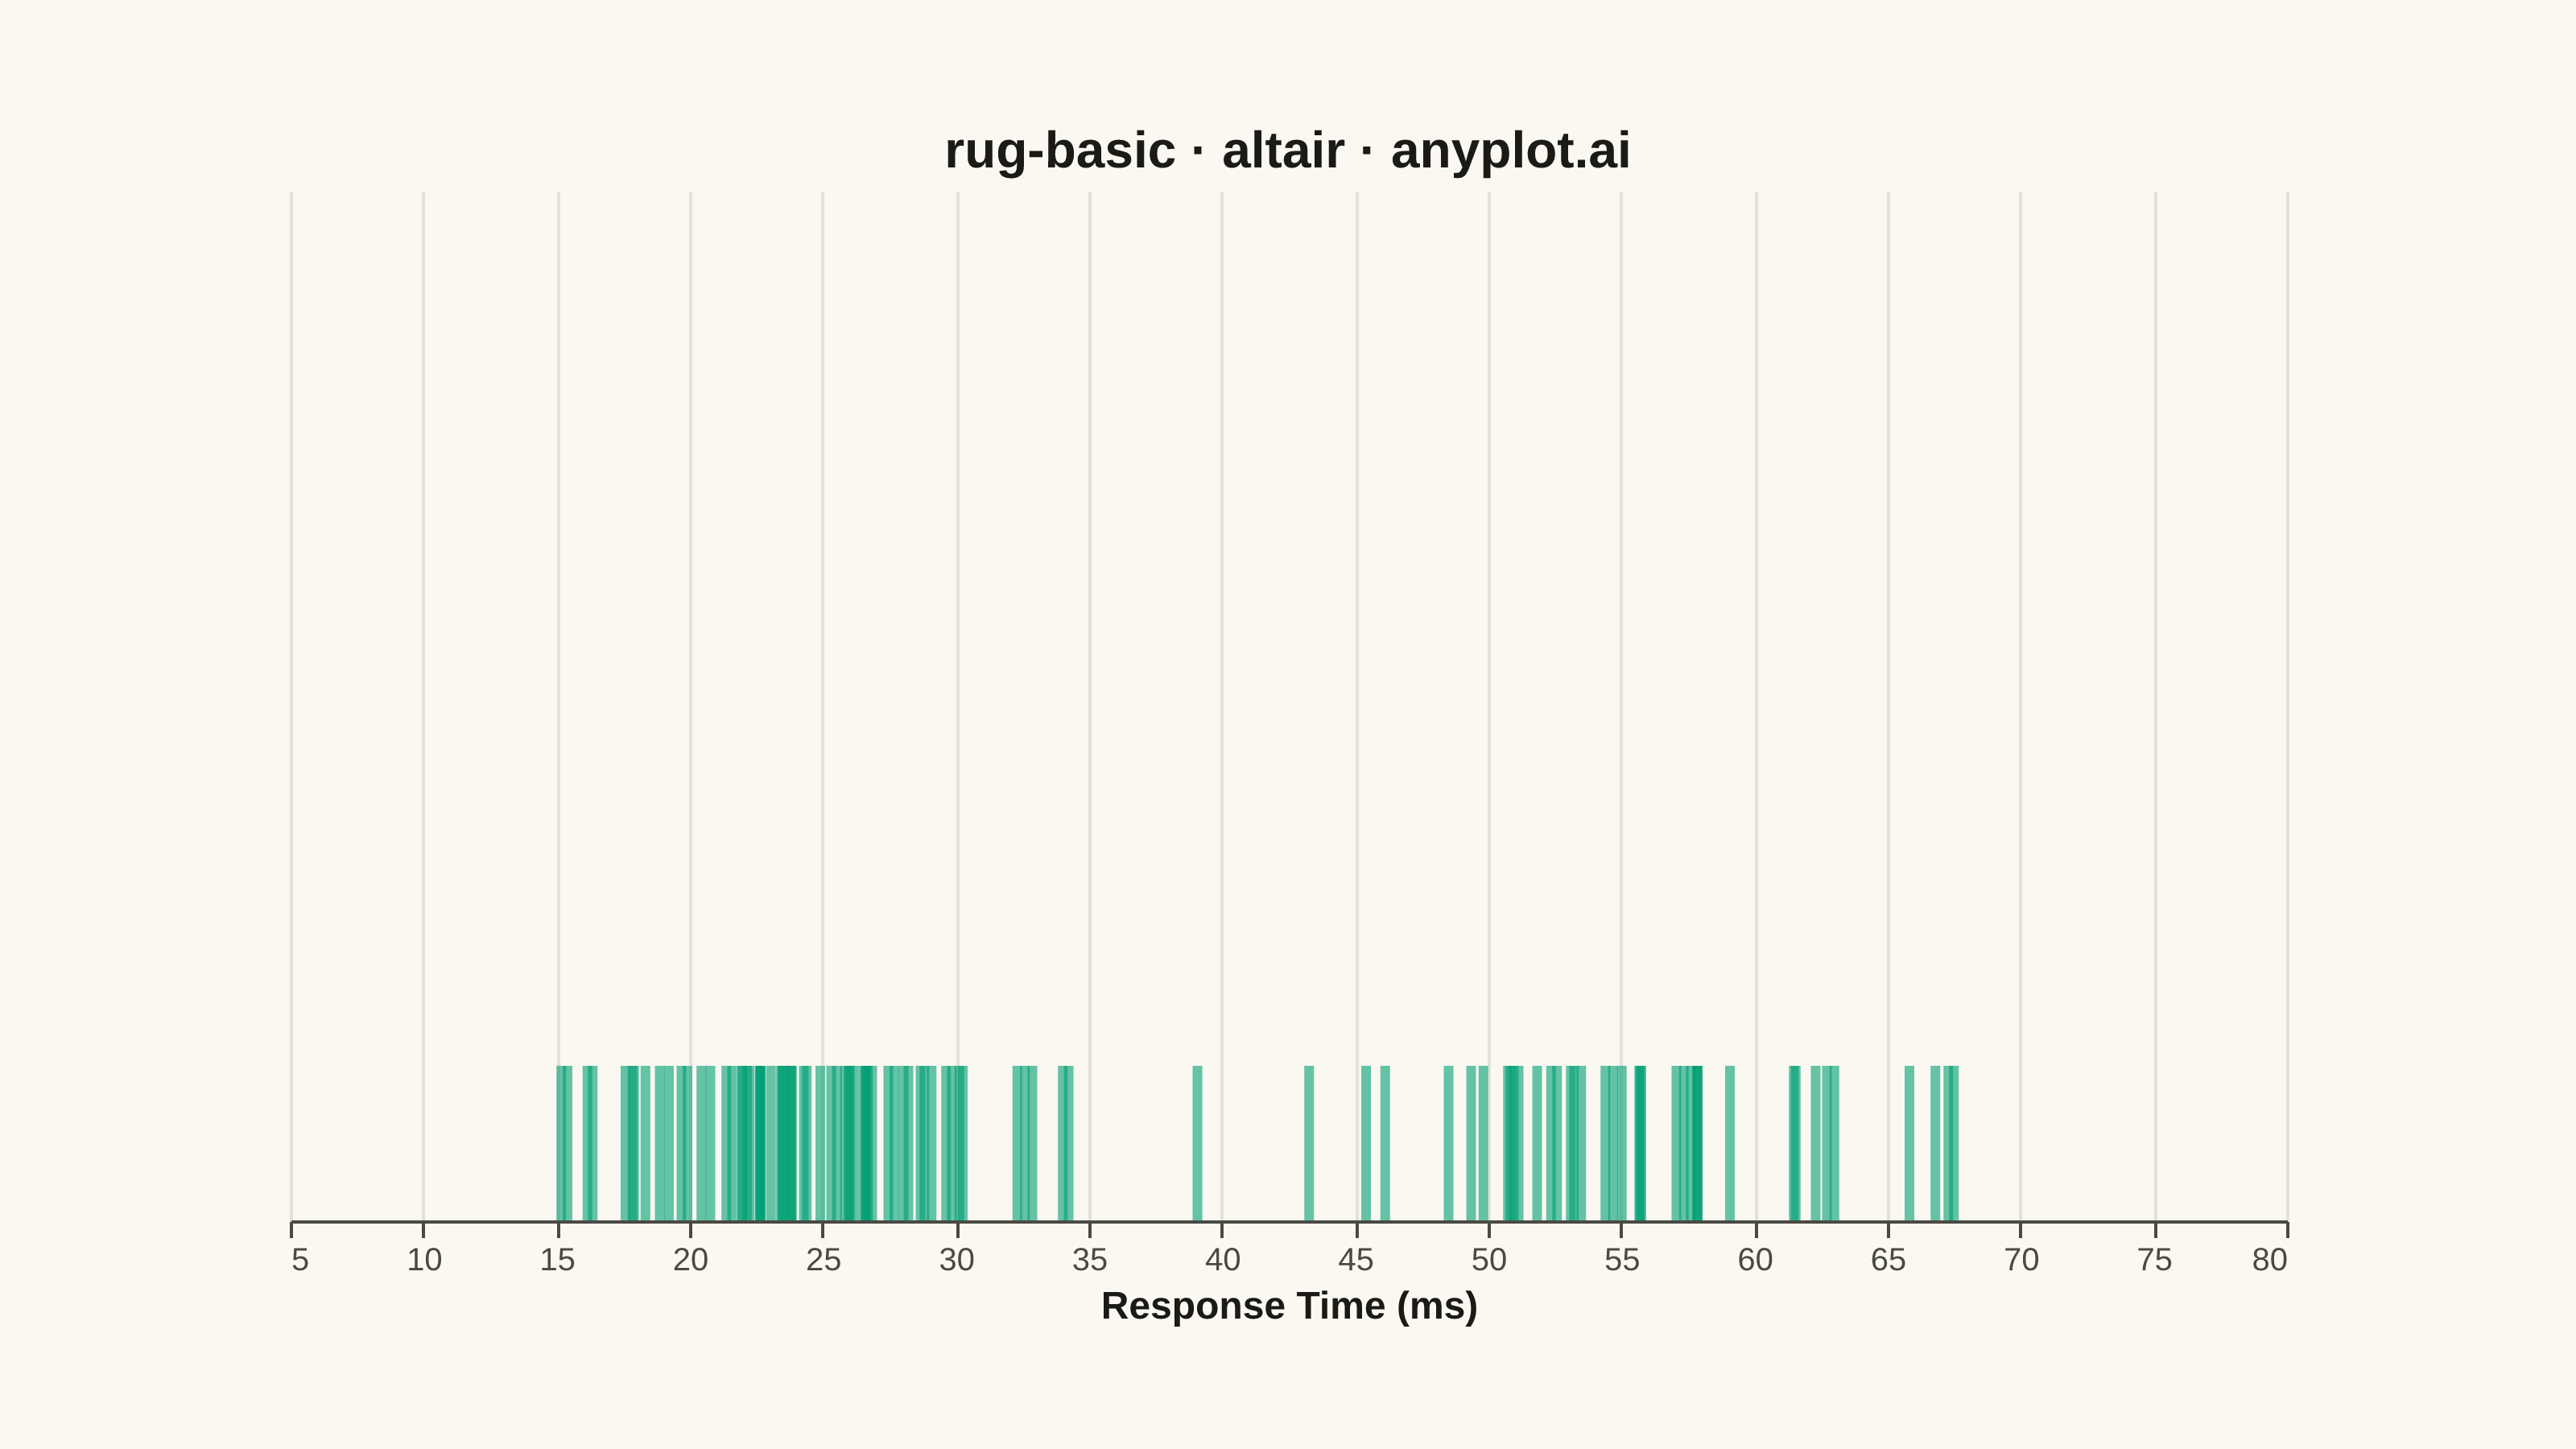
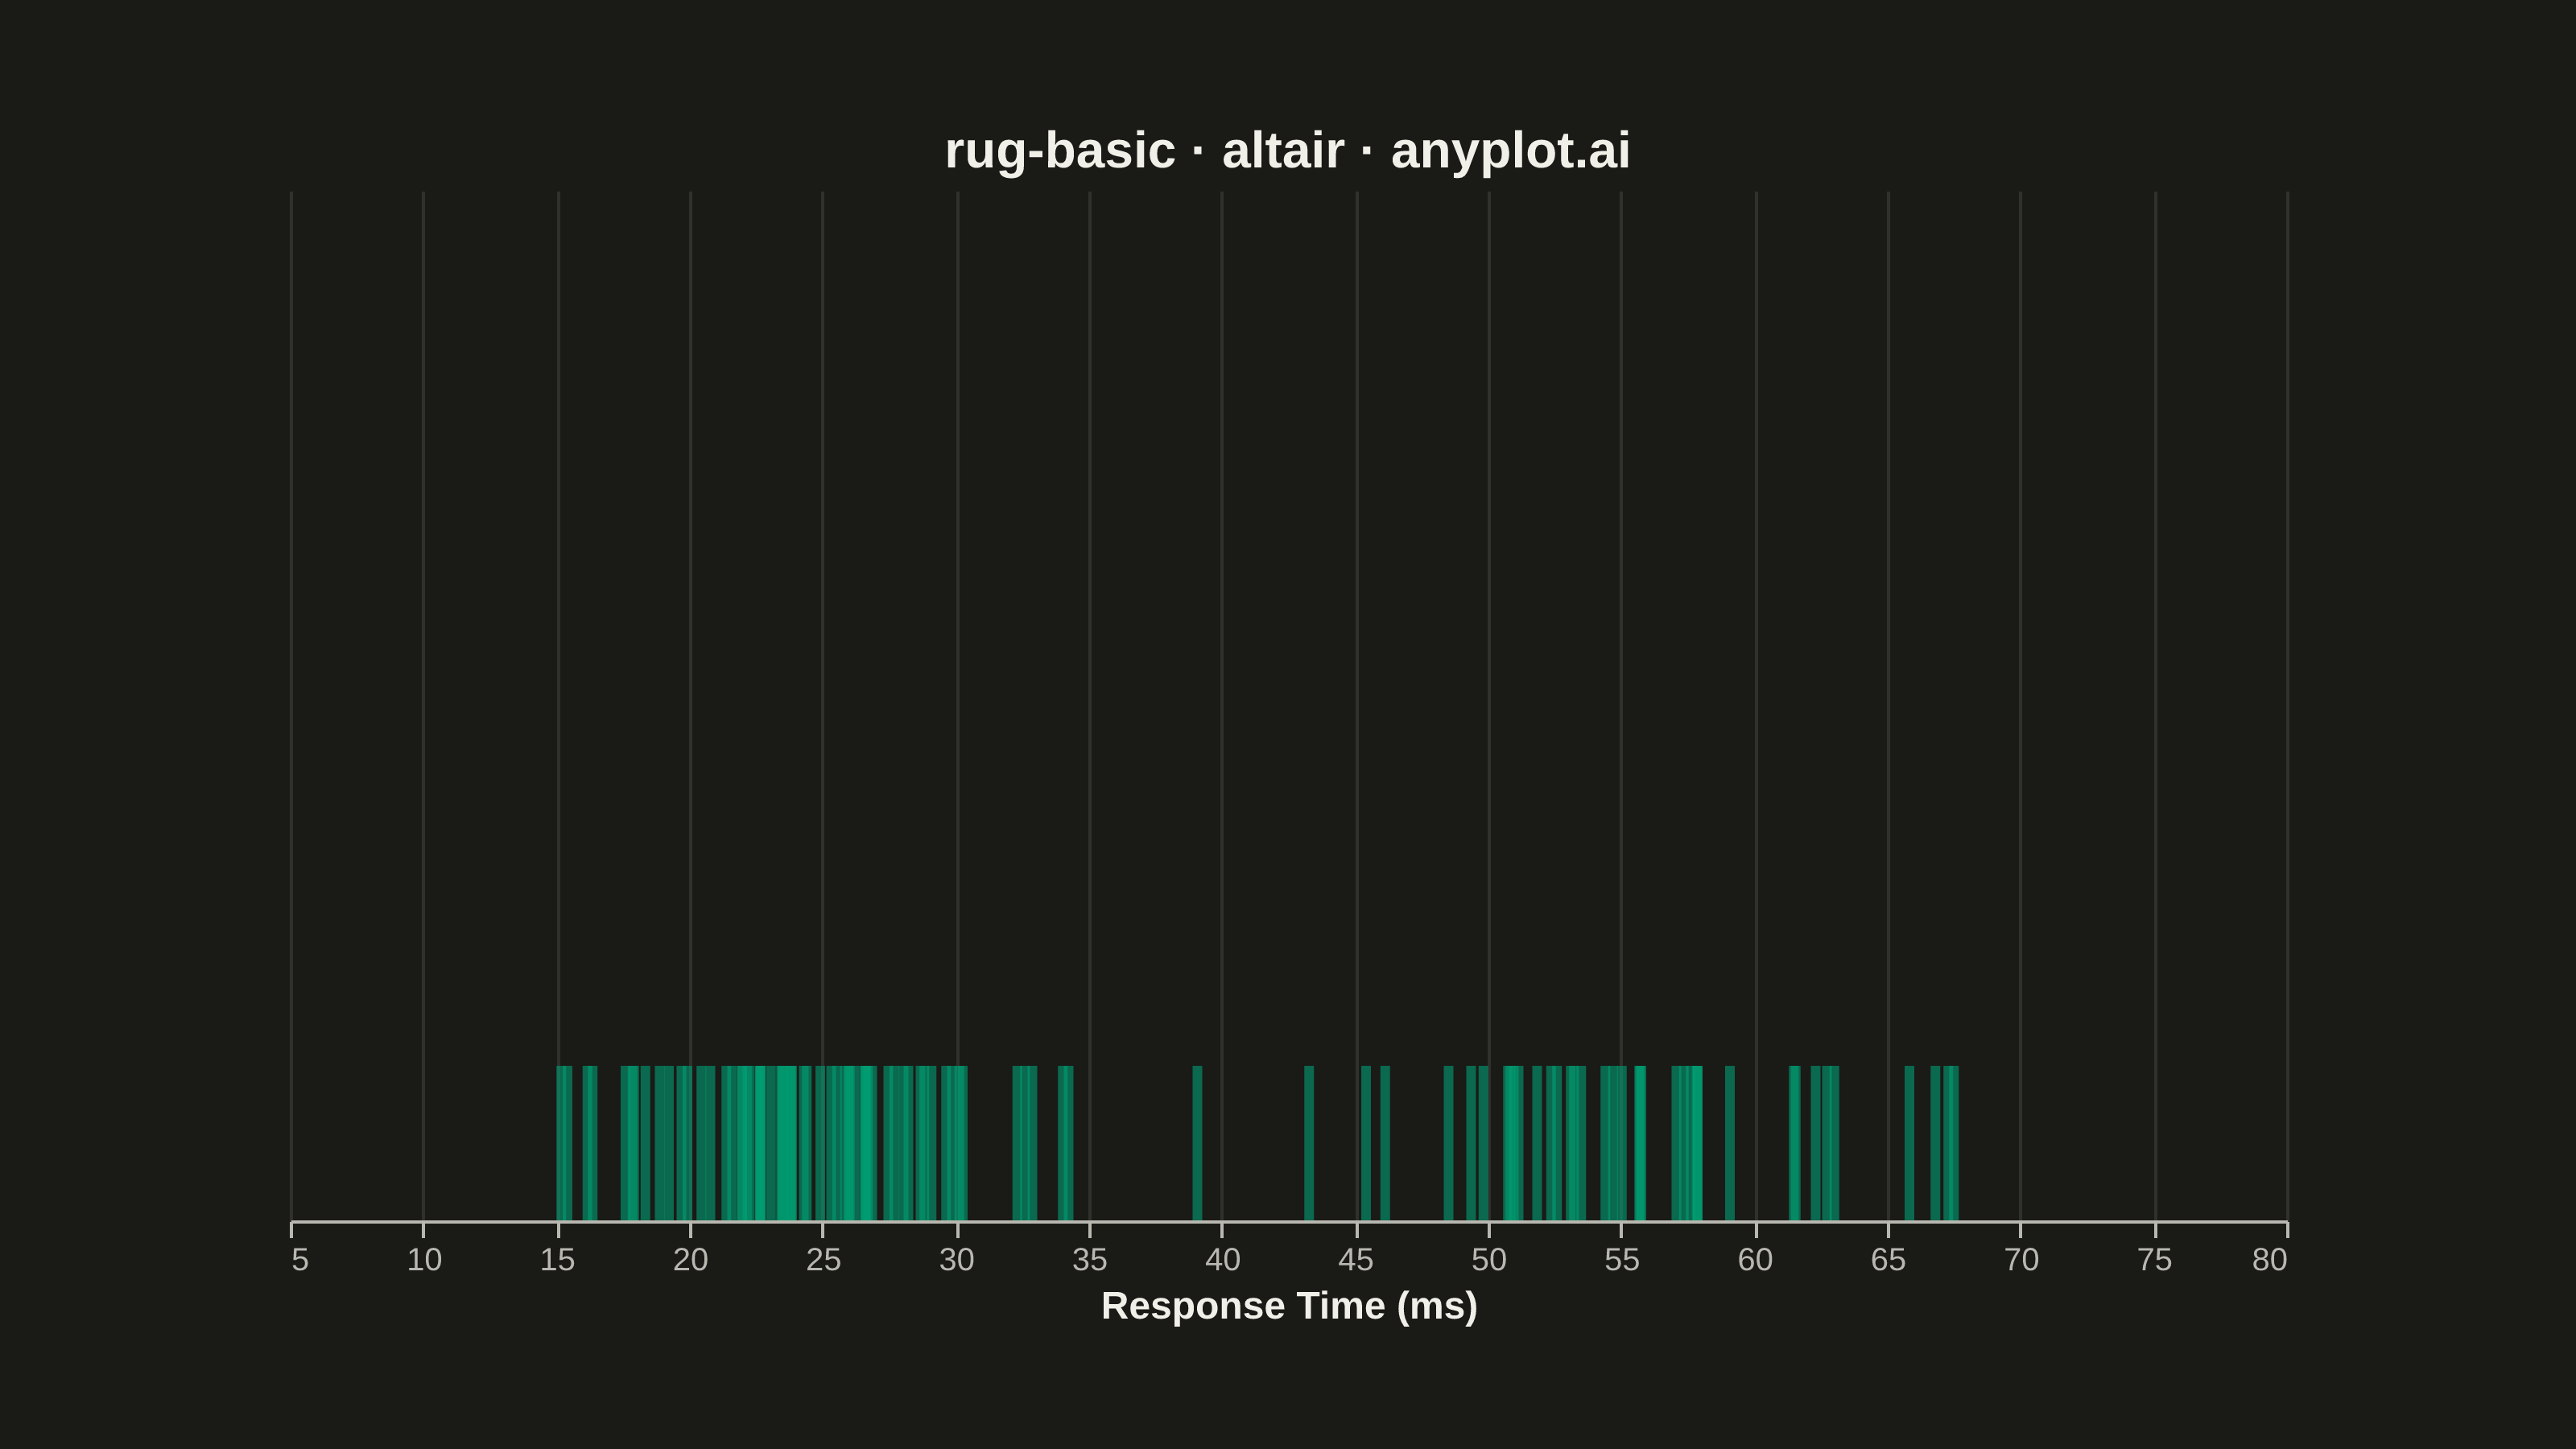
A rug plot displays individual data points as small tick marks along an axis, typically at the bottom or side of another plot. Unlike histograms or density plots that bin data, rug plots show the exact location of every observation. They reveal clustering patterns, gaps in data, and the precise distribution of values with minimal visual footprint.
""" anyplot.ai
rug-basic: Basic Rug Plot
Library: altair 6.2.2 | Python 3.13.14
Quality: 87/100 | Updated: 2026-07-25
"""

import os

import altair as alt
import numpy as np
import pandas as pd
from PIL import Image


# Theme tokens
THEME = os.getenv("ANYPLOT_THEME", "light")
PAGE_BG = "#FAF8F1" if THEME == "light" else "#1A1A17"
INK = "#1A1A17" if THEME == "light" else "#F0EFE8"
INK_SOFT = "#4A4A44" if THEME == "light" else "#B8B7B0"
BRAND = "#009E73"  # Imprint palette position 1

# Data - bimodal distribution showing clustering patterns and gaps
np.random.seed(42)
values = np.concatenate(
    [
        np.random.normal(25, 5, 60),  # Dense cluster around 25 ms
        np.random.normal(55, 8, 40),  # Sparser cluster around 55 ms
    ]
)

df = pd.DataFrame({"values": values, "y": [0] * len(values), "y2": [0.6] * len(values)})

# Plot
rug = (
    alt.Chart(df)
    .mark_rule(strokeWidth=3, opacity=0.6, color=BRAND)
    .encode(
        x=alt.X("values:Q", title="Response Time (ms)", scale=alt.Scale(domain=[5, 80])),
        y=alt.Y("y:Q", scale=alt.Scale(domain=[0, 4]), axis=None),
        y2="y2:Q",
    )
)

chart = (
    rug.properties(
        width=620, height=320, title=alt.Title("rug-basic · altair · anyplot.ai", fontSize=16), background=PAGE_BG
    )
    .configure_view(fill=PAGE_BG, stroke=None)
    .configure_axis(
        domainColor=INK_SOFT,
        tickColor=INK_SOFT,
        gridColor=INK,
        gridOpacity=0.10,
        labelColor=INK_SOFT,
        titleColor=INK,
        labelFontSize=10,
        titleFontSize=12,
    )
    .configure_title(color=INK)
)

# Save
chart.save(f"plot-{THEME}.png", scale_factor=4.0)

# Canvas hard contract: pad the vl-convert output up to the exact target (never crop).
TW, TH = 3200, 1800
_img = Image.open(f"plot-{THEME}.png").convert("RGB")
_w, _h = _img.size
if _w > TW or _h > TH:
    raise SystemExit(
        f"altair vl-convert produced {_w}×{_h}, exceeds target {TW}×{TH}. "
        f"Shrink chart .properties(width=, height=) values and re-render."
    )
if _w < TW or _h < TH:
    _canvas = Image.new("RGB", (TW, TH), PAGE_BG)
    _canvas.paste(_img, ((TW - _w) // 2, (TH - _h) // 2))
    _canvas.save(f"plot-{THEME}.png")

chart.save(f"plot-{THEME}.html")
Runnable source as JSON, for any HTTP client: https://api.anyplot.ai/specs/rug-basic/altair/code. Any spec id and library id listed in llms-full.txt fit the same URL shape; every URL below is complete and callable.
{
  "spec_id": "rug-basic",
  "language": "python",
  "library": "altair",
  "page": "https://anyplot.ai/rug-basic/python/altair",
  "hub": "https://anyplot.ai/rug-basic",
  "code_json": "https://api.anyplot.ai/specs/rug-basic/altair/code",
  "spec_json": "https://api.anyplot.ai/specs/rug-basic",
  "render_light_png": "https://storage.googleapis.com/anyplot-images/plots/rug-basic/python/altair/plot-light.png",
  "render_dark_png": "https://storage.googleapis.com/anyplot-images/plots/rug-basic/python/altair/plot-dark.png",
  "interactive_light_html": "https://storage.googleapis.com/anyplot-images/plots/rug-basic/python/altair/plot-light.html",
  "interactive_dark_html": "https://storage.googleapis.com/anyplot-images/plots/rug-basic/python/altair/plot-dark.html",
  "quality_score": 87.0,
  "license": "MIT",
  "guide": "https://anyplot.ai/llms.txt"
}
Part of Basic Rug Plot on anyplot.ai.