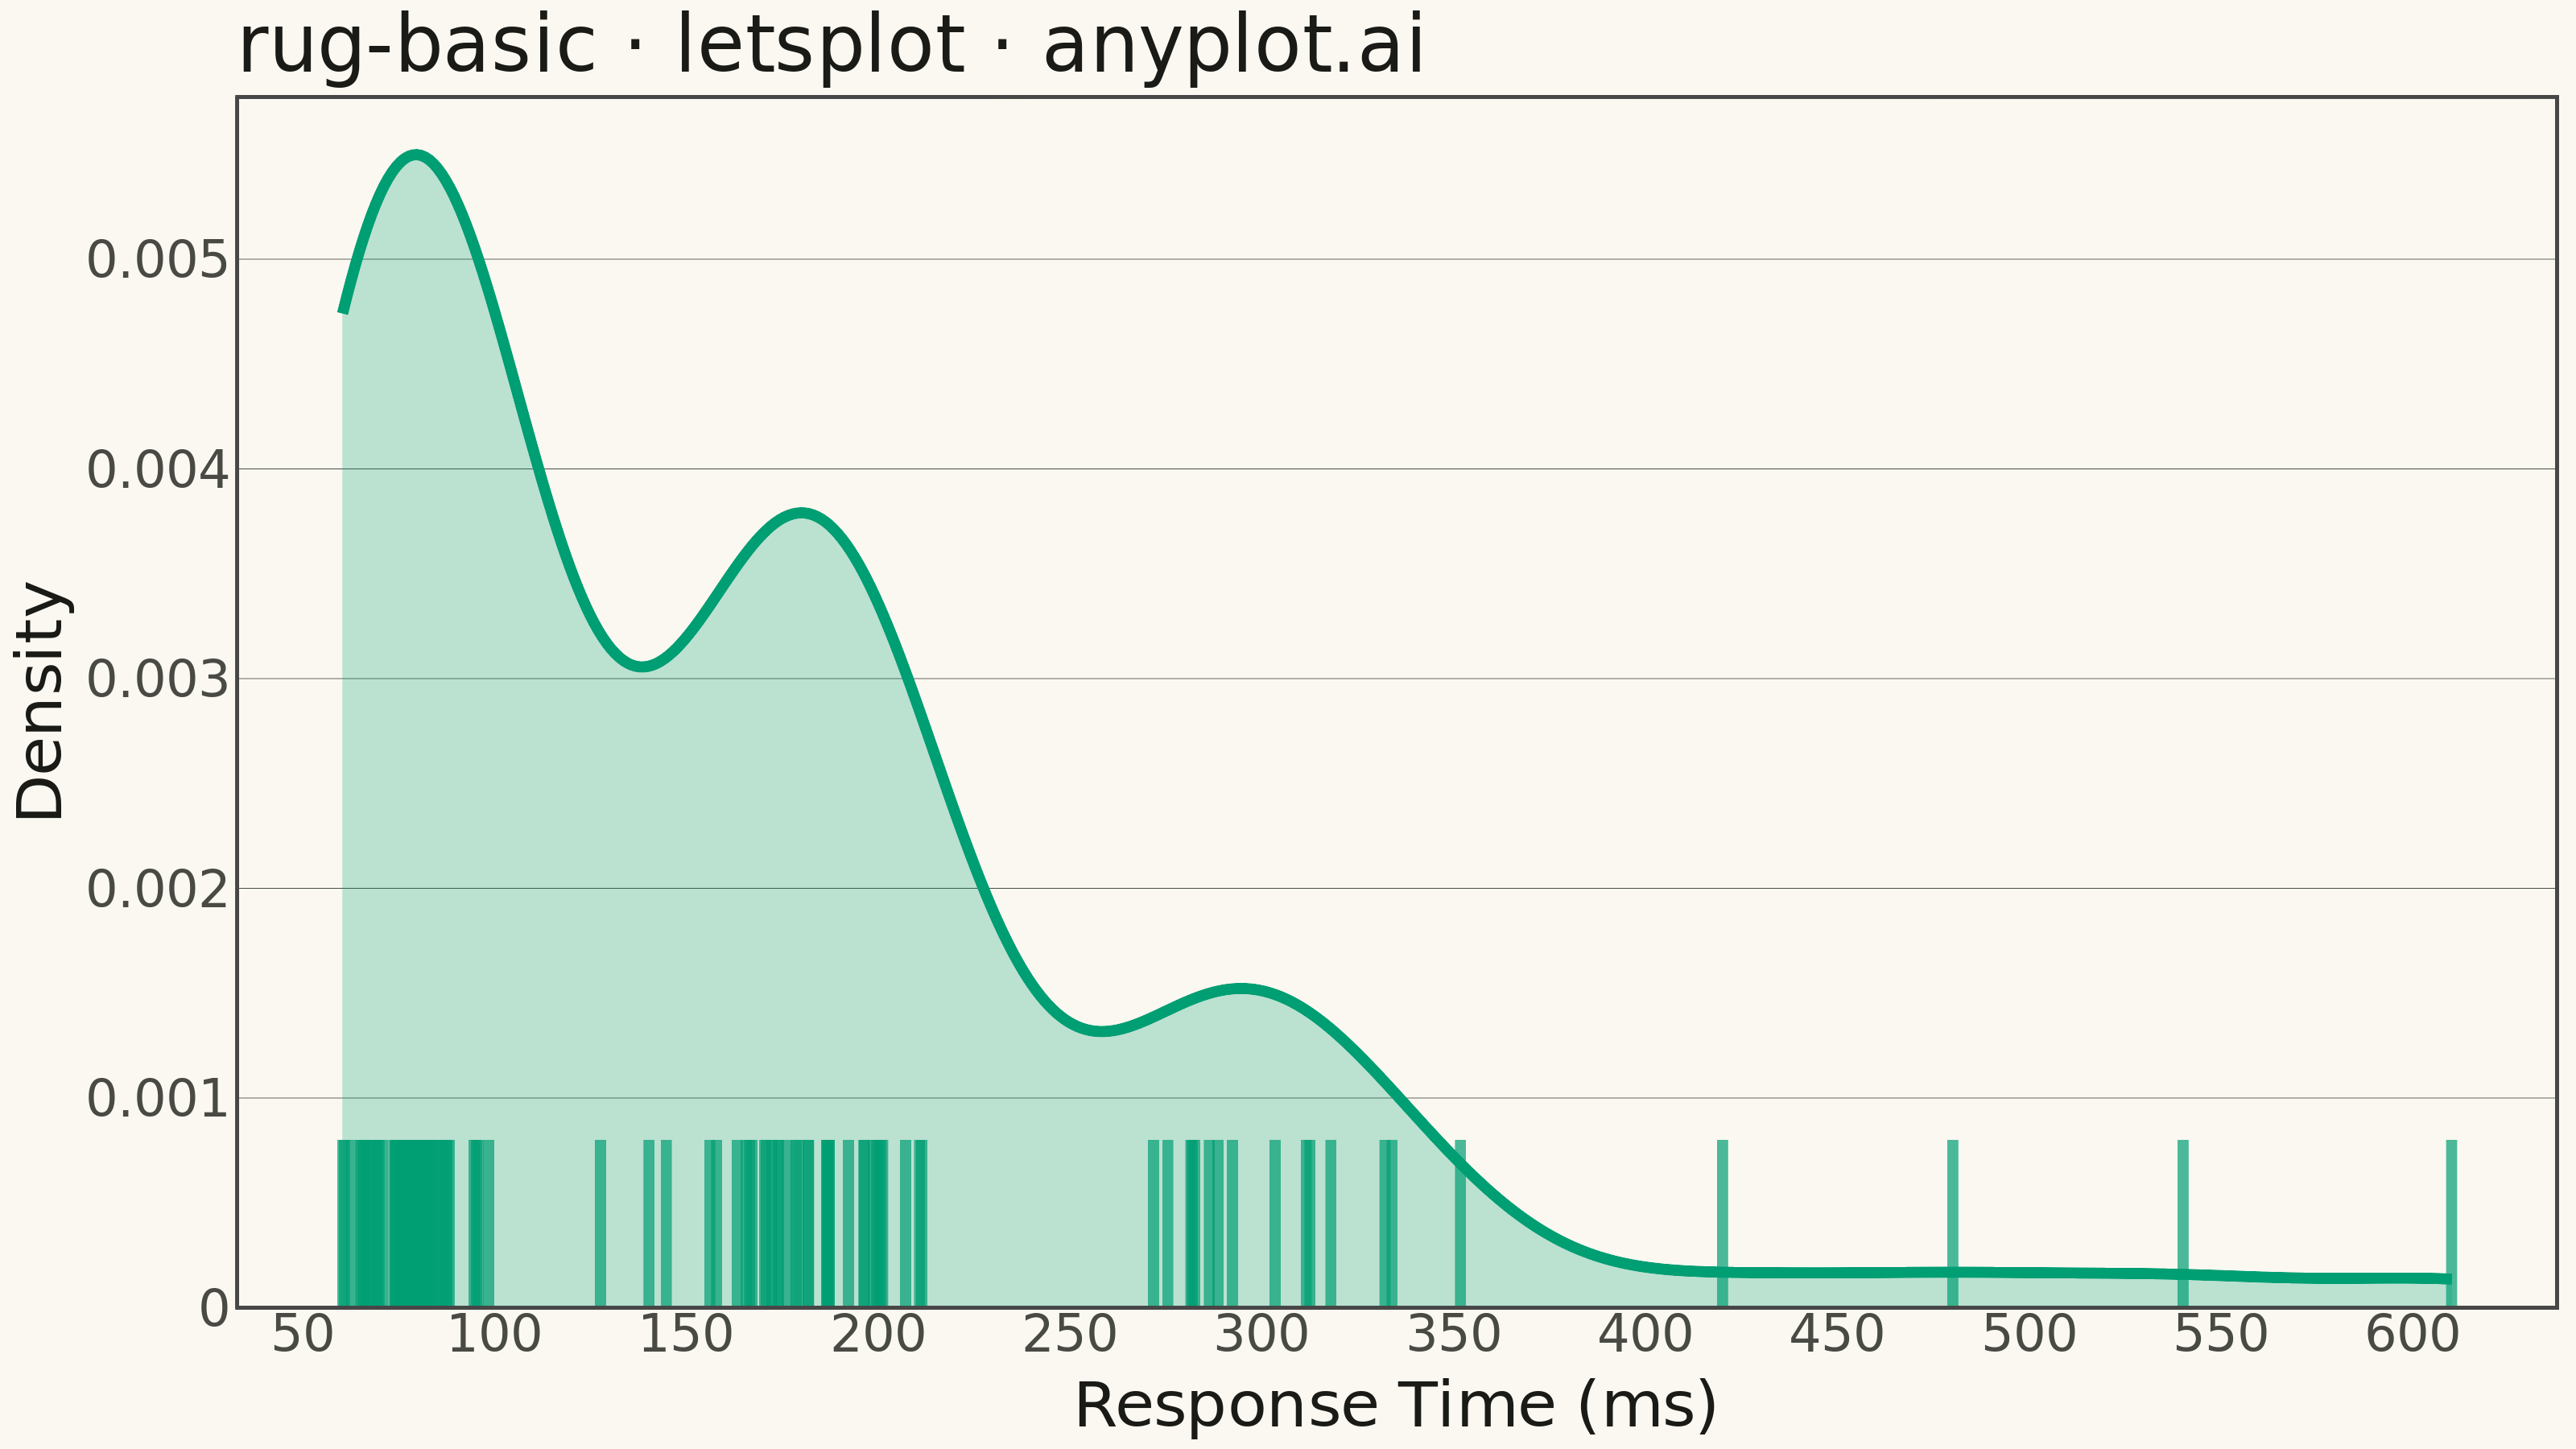
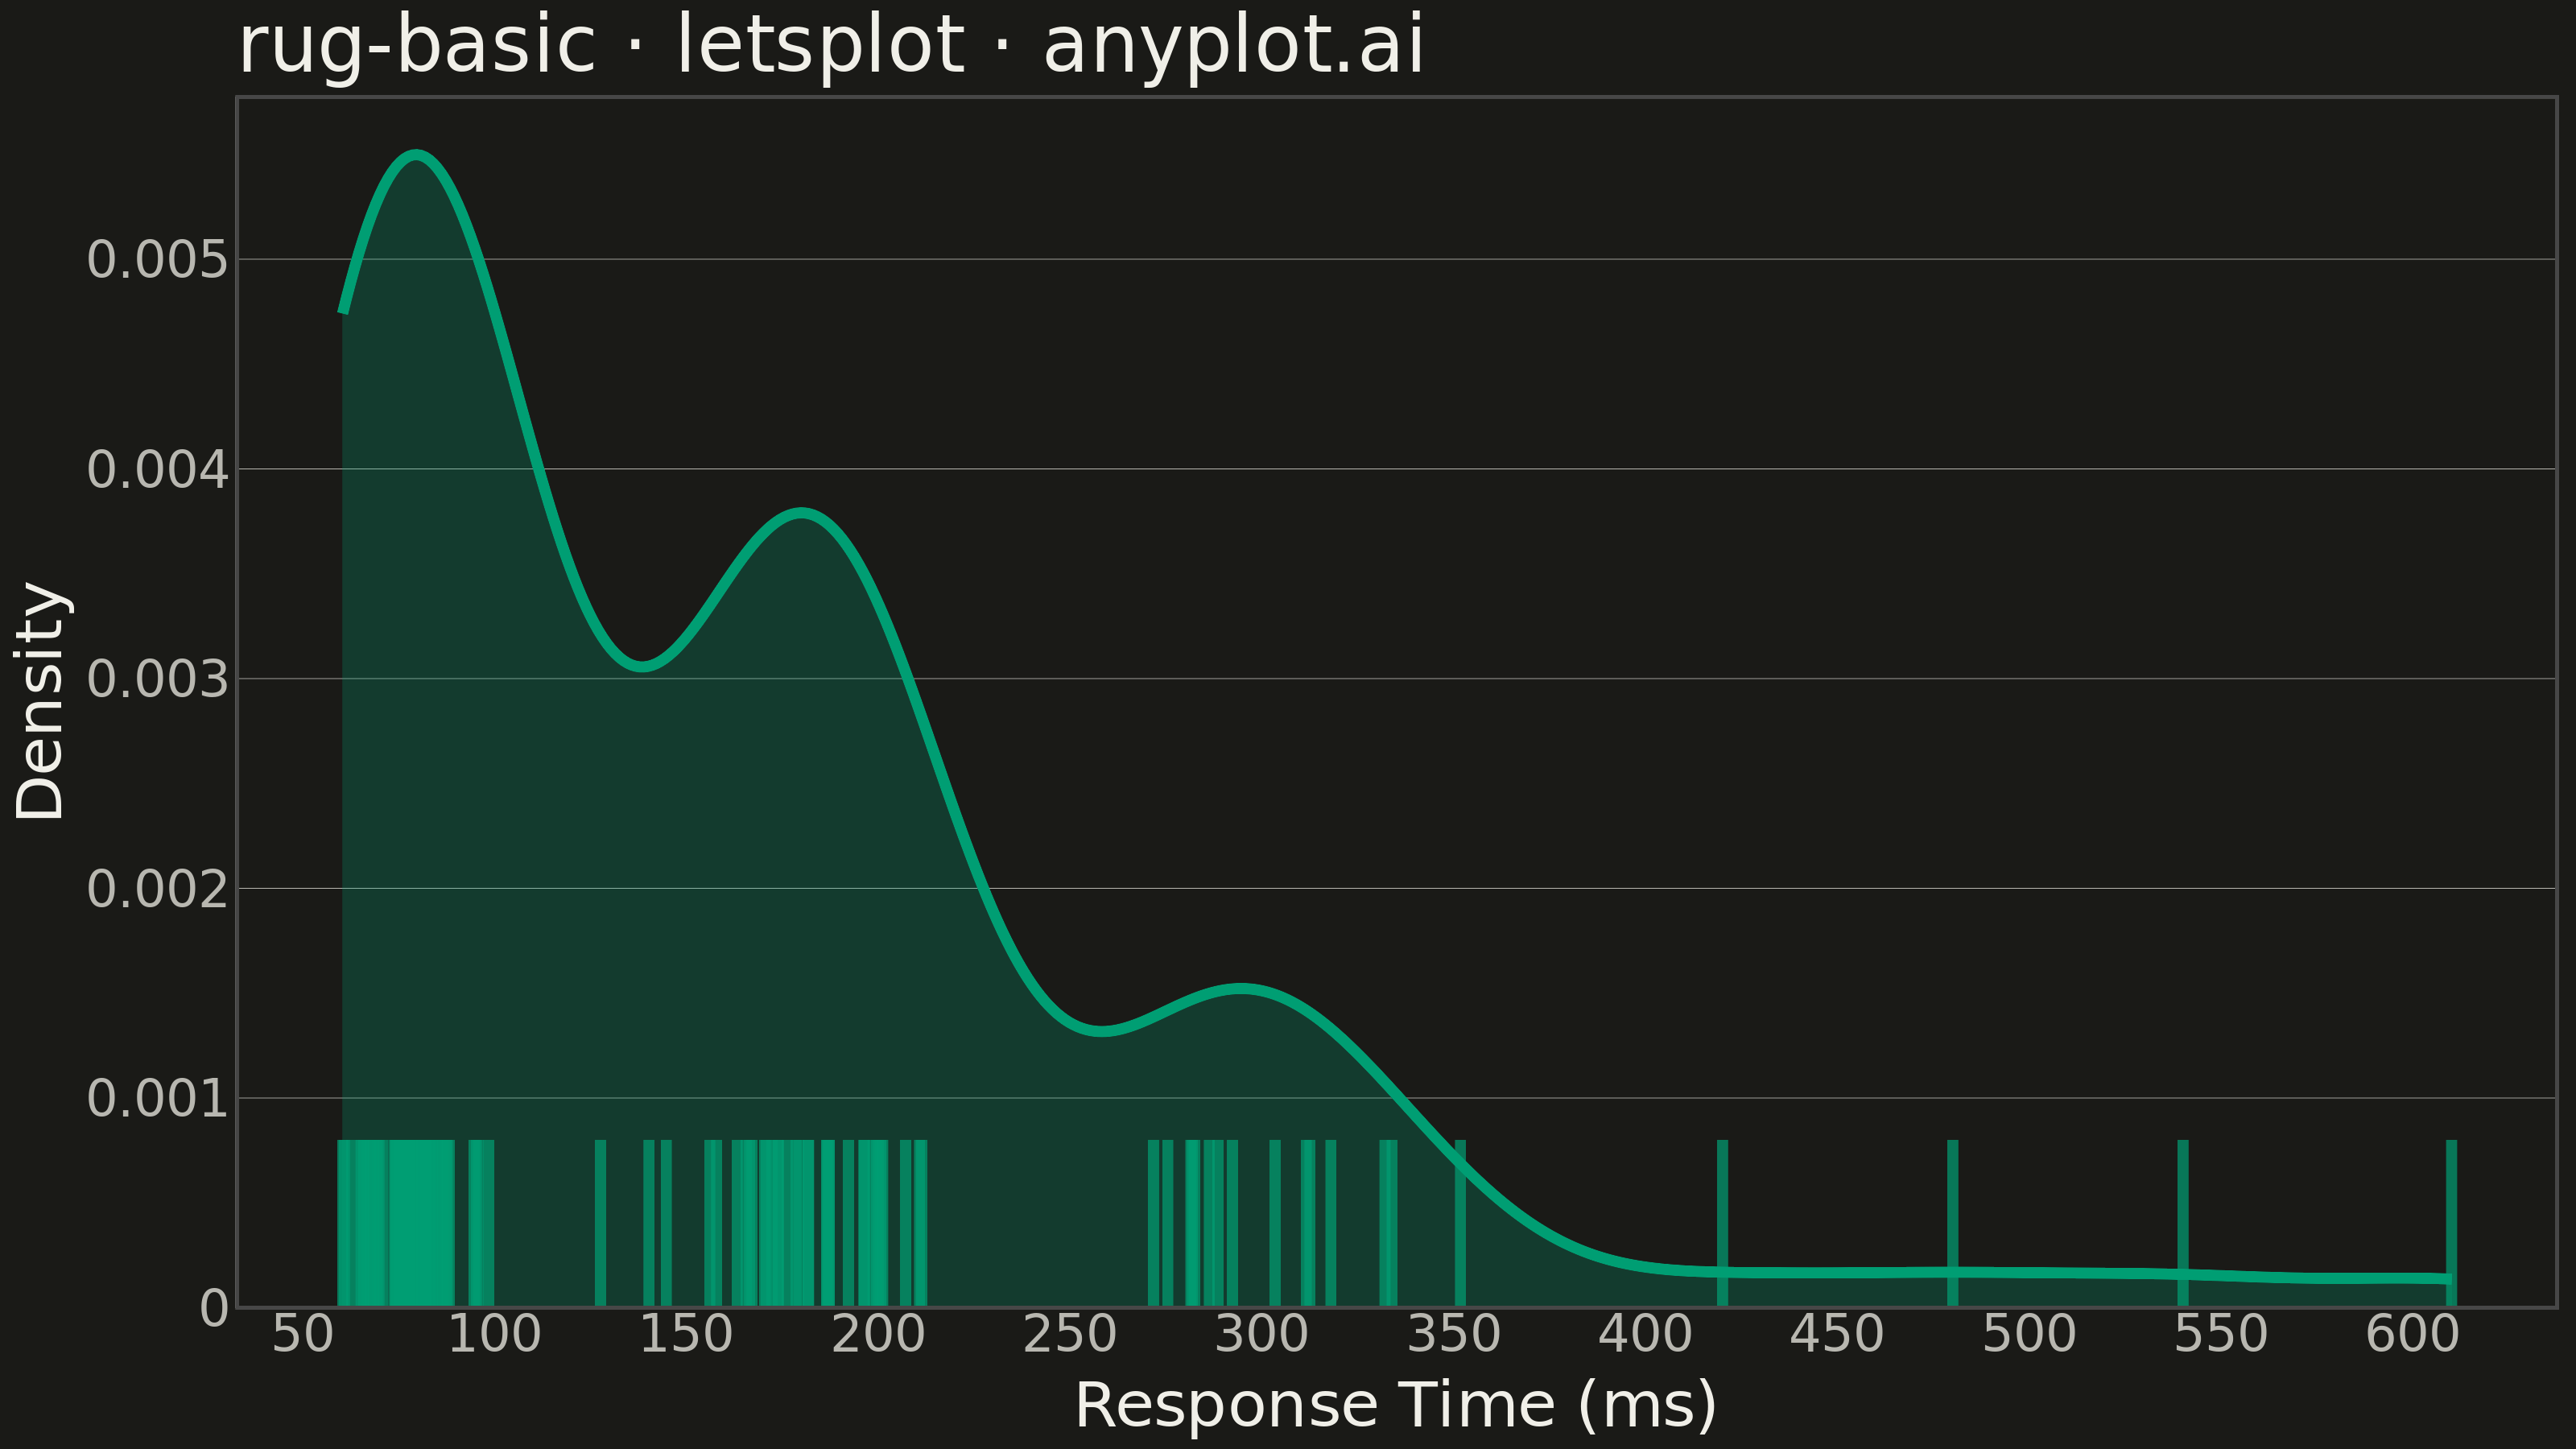
A rug plot displays individual data points as small tick marks along an axis, typically at the bottom or side of another plot. Unlike histograms or density plots that bin data, rug plots show the exact location of every observation. They reveal clustering patterns, gaps in data, and the precise distribution of values with minimal visual footprint.
""" anyplot.ai
rug-basic: Basic Rug Plot
Library: letsplot 4.11.0 | Python 3.13.14
Quality: 84/100 | Updated: 2026-07-25
"""

import os

import numpy as np
import pandas as pd
from lets_plot import (
    LetsPlot,
    aes,
    element_blank,
    element_line,
    element_rect,
    element_text,
    geom_density,
    geom_segment,
    ggplot,
    ggsize,
    labs,
    theme,
    theme_minimal,
)
from lets_plot.export import ggsave


LetsPlot.setup_html()

# Theme tokens (Imprint palette)
THEME = os.getenv("ANYPLOT_THEME", "light")
PAGE_BG = "#FAF8F1" if THEME == "light" else "#1A1A17"
INK = "#1A1A17" if THEME == "light" else "#F0EFE8"
INK_SOFT = "#4A4A44" if THEME == "light" else "#B8B7B0"
BRAND = "#009E73"  # Imprint palette position 1

# Data - simulated response times with clusters and gaps (realistic scenario)
# Shifted/tightened clusters (80/180/300ms) to diverge from sibling libraries'
# trimodal placement while keeping the same storytelling shape.
np.random.seed(42)
cluster1 = np.random.normal(80, 10, 45)  # Fast responses ~80ms
cluster2 = np.random.normal(180, 20, 35)  # Medium responses ~180ms
cluster3 = np.random.normal(300, 35, 15)  # Slow responses ~300ms
outliers = np.array([420, 480, 540, 610])  # Edge outliers
values = np.concatenate([cluster1, cluster2, cluster3, outliers])

df = pd.DataFrame({"response_time": values})

rug_y_max = 0.0008
df_rug = pd.DataFrame(
    {"x": values, "xend": values, "y": np.zeros(len(values)), "yend": np.full(len(values), rug_y_max)}
)

# Plot - density curve with rug marks along x-axis
# lets-plot 4.11.0 has no native geom_rug(); geom_segment is the idiomatic
# equivalent (a zero-length vertical segment per observation).
plot = (
    ggplot(df, aes(x="response_time"))
    + geom_density(fill=BRAND, alpha=0.25, size=1.5, color=BRAND)
    + geom_segment(aes(x="x", xend="xend", y="y", yend="yend"), data=df_rug, color=BRAND, alpha=0.55, size=1.0)
    + labs(x="Response Time (ms)", y="Density", title="rug-basic · python · letsplot · anyplot.ai")
    + theme_minimal()
    + theme(
        plot_background=element_rect(fill=PAGE_BG, color=PAGE_BG),
        panel_background=element_rect(fill=PAGE_BG),
        panel_border=element_blank(),
        axis_title=element_text(size=20, color=INK),
        axis_text=element_text(size=16, color=INK_SOFT),
        plot_title=element_text(size=24, color=INK),
        panel_grid_major_y=element_line(color=INK_SOFT, size=0.2),
        panel_grid_major_x=element_blank(),
        panel_grid_minor=element_blank(),
        axis_line=element_line(color=INK_SOFT),
    )
    + ggsize(800, 450)
)

# Save PNG (scale 4x for 3200x1800) and HTML
ggsave(plot, f"plot-{THEME}.png", path=".", scale=4)
ggsave(plot, f"plot-{THEME}.html", path=".")
Runnable source as JSON, for any HTTP client: https://api.anyplot.ai/specs/rug-basic/letsplot/code. Any spec id and library id listed in llms-full.txt fit the same URL shape; every URL below is complete and callable.
{
  "spec_id": "rug-basic",
  "language": "python",
  "library": "letsplot",
  "page": "https://anyplot.ai/rug-basic/python/letsplot",
  "hub": "https://anyplot.ai/rug-basic",
  "code_json": "https://api.anyplot.ai/specs/rug-basic/letsplot/code",
  "spec_json": "https://api.anyplot.ai/specs/rug-basic",
  "render_light_png": "https://storage.googleapis.com/anyplot-images/plots/rug-basic/python/letsplot/plot-light.png",
  "render_dark_png": "https://storage.googleapis.com/anyplot-images/plots/rug-basic/python/letsplot/plot-dark.png",
  "interactive_light_html": "https://storage.googleapis.com/anyplot-images/plots/rug-basic/python/letsplot/plot-light.html",
  "interactive_dark_html": "https://storage.googleapis.com/anyplot-images/plots/rug-basic/python/letsplot/plot-dark.html",
  "quality_score": 84.0,
  "license": "MIT",
  "guide": "https://anyplot.ai/llms.txt"
}
Part of Basic Rug Plot on anyplot.ai.