The same plot in 14 other libraries — JavaScript: Chart.js, Apache ECharts, Highcharts, MUI X Charts; Python: Altair, Bokeh, lets-plot, Matplotlib, Plotly, plotnine, Pygal, Seaborn; R: ggplot2; Julia: Makie.jl. Compare all 15 side by side: Basic Rug Plot in Python, R, Julia and JavaScript.
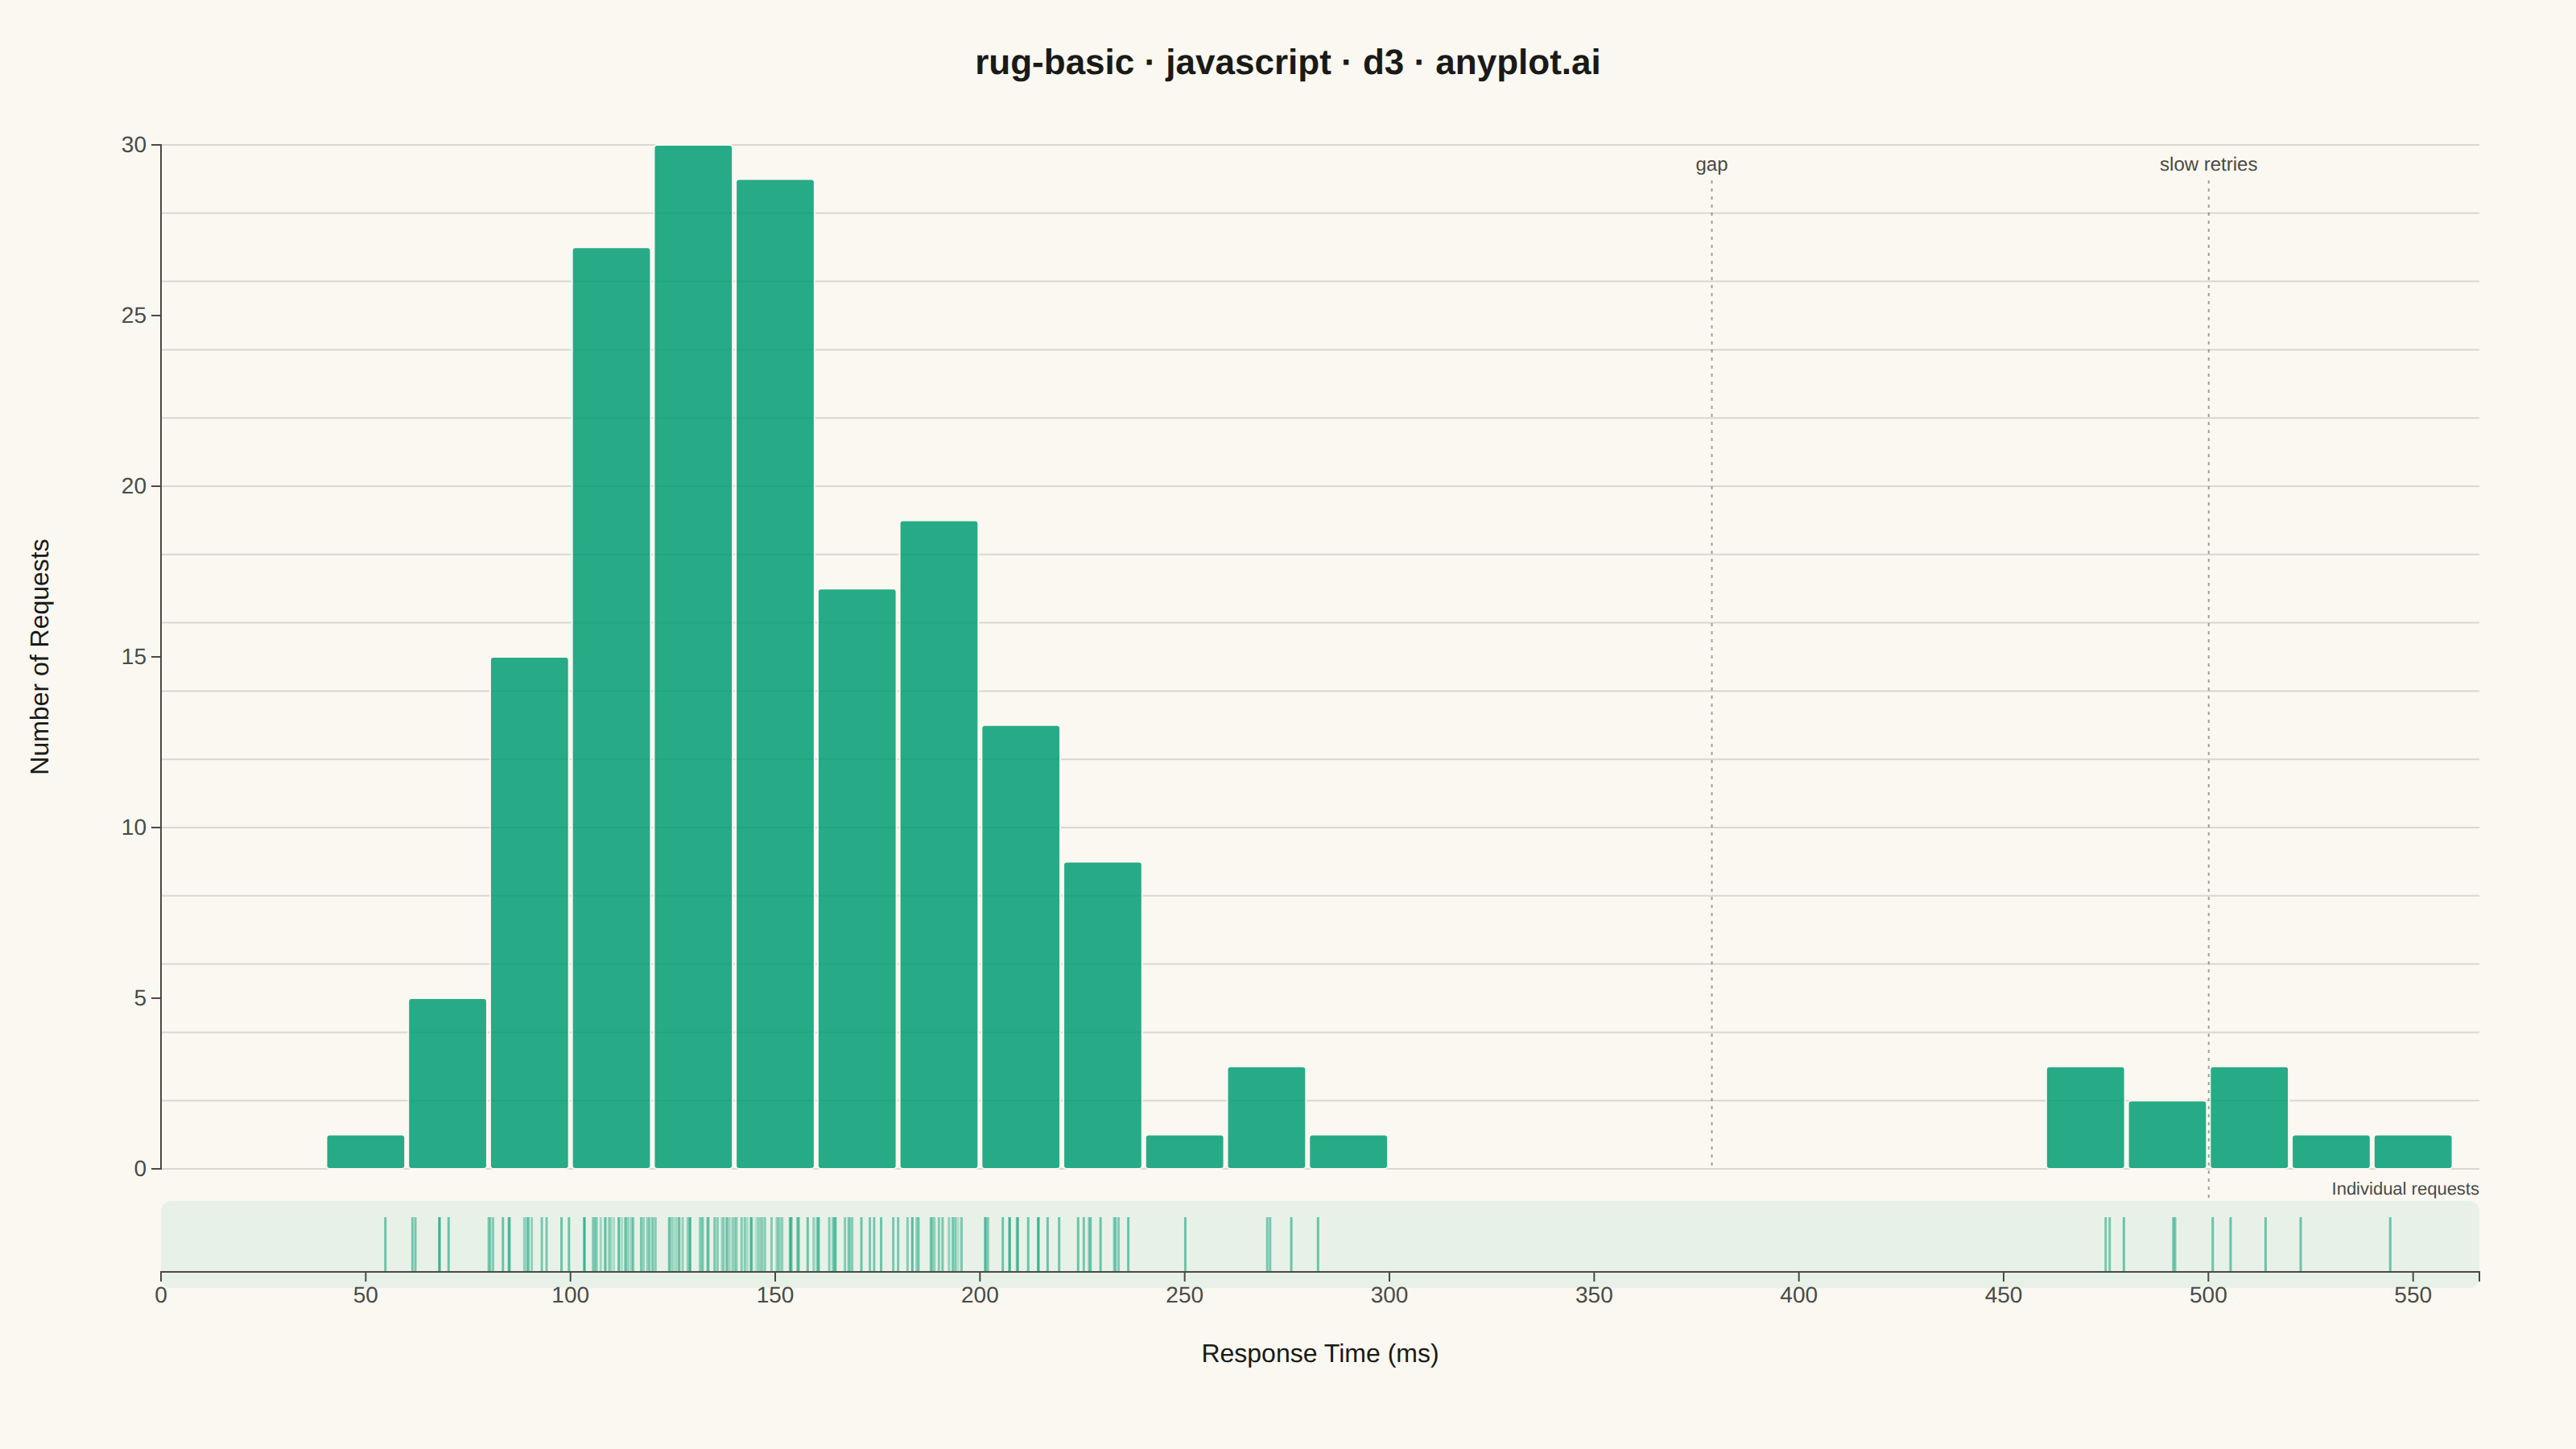
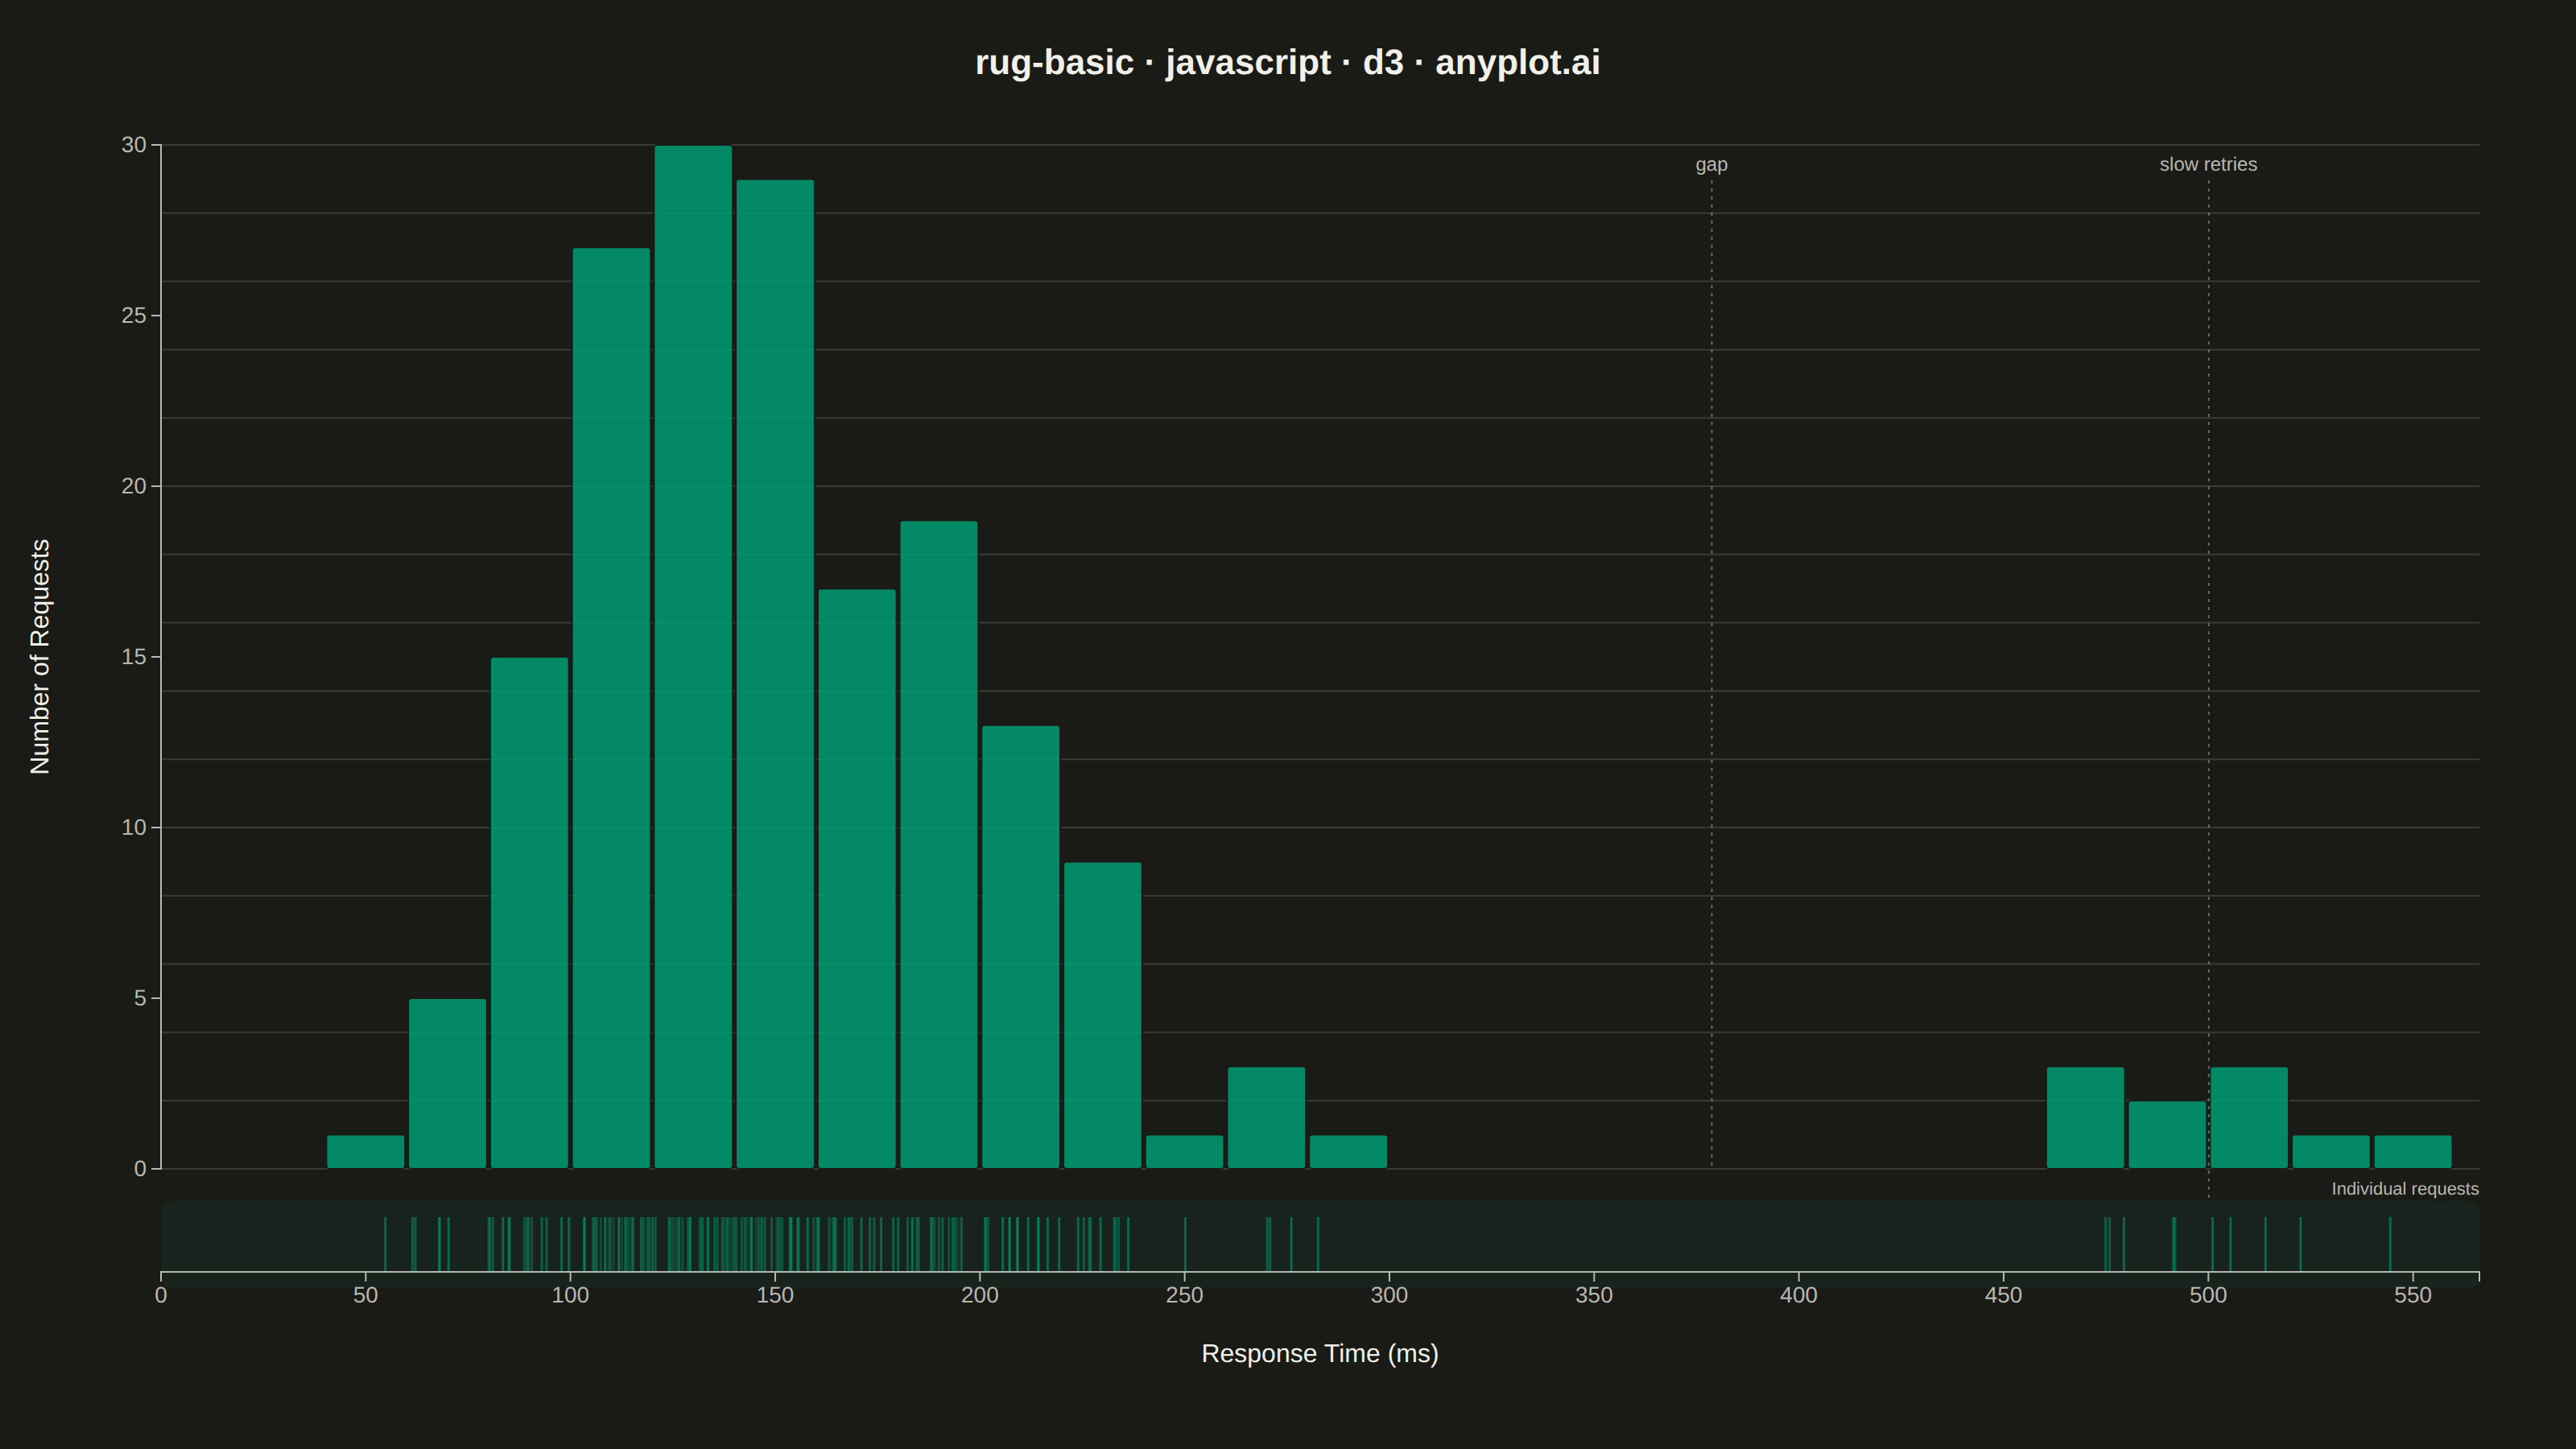
A rug plot displays individual data points as small tick marks along an axis, typically at the bottom or side of another plot. Unlike histograms or density plots that bin data, rug plots show the exact location of every observation. They reveal clustering patterns, gaps in data, and the precise distribution of values with minimal visual footprint.
// anyplot.ai
// rug-basic: Basic Rug Plot
// Library: d3 7.9.0 | JavaScript 22.23.1
// Quality: 96/100 | Created: 2026-07-25

const t = window.ANYPLOT_TOKENS;
const { width, height } = window.ANYPLOT_SIZE;
const margin = { top: 90, right: 60, bottom: 110, left: 100 };
const iw = width - margin.left - margin.right;
const ih = height - margin.top - margin.bottom;

// --- Data (in-memory, deterministic) ----------------------------------------
// API endpoint response times (ms) for 180 requests: a lognormal-ish cluster
// of fast responses plus a small cluster of slow/timed-out retries.
let seed = 42;
const lcg = () => {
  seed = (seed * 1664525 + 1013904223) % 4294967296;
  return seed / 4294967296;
};
const gaussian = () => {
  const u1 = lcg() || 1e-9;
  const u2 = lcg();
  return Math.sqrt(-2 * Math.log(u1)) * Math.cos(2 * Math.PI * u2);
};

const mainCluster = [];
for (let i = 0; i < 170; i++) {
  mainCluster.push(Math.exp(Math.log(140) + 0.35 * gaussian()));
}
const retryCluster = [];
for (let i = 0; i < 10; i++) {
  retryCluster.push(500 + gaussian() * 18);
}
const responseTimes = mainCluster.concat(retryCluster);

// --- SVG mount ----------------------------------------------------------------
const svg = d3.select("#container").append("svg").attr("width", width).attr("height", height);
const g = svg.append("g").attr("transform", `translate(${margin.left},${margin.top})`);

// --- Layout: histogram on top, rug strip below, sharing the x scale ----------
// rugGap holds a tinted "lane" band (drawn below) that visually ties the rug
// strip to the histogram above it, plus its caption.
const rugHeight = 34;
const rugGap = 30;
const histHeight = ih - rugHeight - rugGap;
const rugTop = histHeight + rugGap;

// --- Scale ----------------------------------------------------------------
const x = d3
  .scaleLinear()
  .domain([0, d3.max(responseTimes) * 1.04])
  .range([0, iw]);

const bins = d3.bin().domain(x.domain()).thresholds(24)(responseTimes);
const y = d3
  .scaleLinear()
  .domain([0, d3.max(bins, (b) => b.length)])
  .nice()
  .range([histHeight, 0]);

// --- Y gridlines (histogram area only) --------------------------------------
g.append("g")
  .call(d3.axisLeft(y).tickSize(-iw).tickFormat(""))
  .call((axis) => axis.select(".domain").remove())
  .selectAll("line")
  .attr("stroke", t.grid);

// --- Histogram bars -----------------------------------------------------------
g.selectAll("rect.bar")
  .data(bins)
  .join("rect")
  .attr("class", "bar")
  .attr("x", (b) => x(b.x0) + 1)
  .attr("y", (b) => y(b.length))
  .attr("width", (b) => Math.max(0, x(b.x1) - x(b.x0) - 2))
  .attr("height", (b) => histHeight - y(b.length))
  .attr("rx", 2)
  .attr("fill", t.palette[0])
  .attr("fill-opacity", 0.85)
  .attr("stroke", t.pageBg)
  .attr("stroke-width", 1);

// --- Storytelling callouts: name the gap and the retry cluster the rug ------
// reveals but the histogram bins hide.
const mainMax = d3.max(mainCluster);
const retryMin = d3.min(retryCluster);
const gapMidX = x((mainMax + retryMin) / 2);
const retryMidX = x(d3.mean(retryCluster));

g.append("text")
  .attr("x", gapMidX)
  .attr("y", 16)
  .attr("text-anchor", "middle")
  .attr("fill", t.inkSoft)
  .style("font-size", "12px")
  .text("gap");
g.append("line")
  .attr("x1", gapMidX)
  .attr("x2", gapMidX)
  .attr("y1", 22)
  .attr("y2", histHeight)
  .attr("stroke", t.inkSoft)
  .attr("stroke-dasharray", "2,3")
  .attr("stroke-opacity", 0.5);

g.append("text")
  .attr("x", retryMidX)
  .attr("y", 16)
  .attr("text-anchor", "middle")
  .attr("fill", t.inkSoft)
  .style("font-size", "12px")
  .text("slow retries");
g.append("line")
  .attr("x1", retryMidX)
  .attr("x2", retryMidX)
  .attr("y1", 22)
  .attr("y2", rugTop - 10)
  .attr("stroke", t.inkSoft)
  .attr("stroke-dasharray", "2,3")
  .attr("stroke-opacity", 0.5);

// --- Rug lane: tinted band (same hue as the data) links it to the histogram --
g.append("rect")
  .attr("x", 0)
  .attr("y", rugTop - 10)
  .attr("width", iw)
  .attr("height", rugHeight + 20)
  .attr("rx", 6)
  .attr("fill", t.palette[0])
  .attr("fill-opacity", 0.07);

g.append("text")
  .attr("x", iw)
  .attr("y", rugTop - 14)
  .attr("text-anchor", "end")
  .attr("fill", t.inkSoft)
  .style("font-size", "11px")
  .text("Individual requests");

// --- Rug strip: one tick per observation ------------------------------------
// D3-specific touch: opacity is derived per-tick from local pixel density (a
// fixed-radius neighbor count), so the crowded core fades enough to stay
// readable as density rather than merging into a solid band, while isolated
// ticks in the sparse regions stay strongly visible.
const rugRadiusPx = 3.5;
const px = responseTimes.map((d) => x(d));
const density = px.map((xi) => px.reduce((n, xj) => n + (Math.abs(xi - xj) <= rugRadiusPx ? 1 : 0), 0));
const tickOpacity = d3.scaleLinear().domain(d3.extent(density)).range([0.55, 0.16]).clamp(true);

g.selectAll("line.rug")
  .data(responseTimes)
  .join("line")
  .attr("class", "rug")
  .attr("x1", (d) => x(d))
  .attr("x2", (d) => x(d))
  .attr("y1", rugTop)
  .attr("y2", rugTop + rugHeight)
  .attr("stroke", t.palette[0])
  .attr("stroke-width", 1.5)
  .attr("stroke-opacity", (d, i) => tickOpacity(density[i]));

// --- Axes ------------------------------------------------------------------
const yAxis = g.append("g").call(d3.axisLeft(y).ticks(6));
const xAxis = g
  .append("g")
  .attr("transform", `translate(0,${rugTop + rugHeight})`)
  .call(d3.axisBottom(x));

for (const axis of [xAxis, yAxis]) {
  axis.selectAll("text").attr("fill", t.inkSoft).style("font-size", "14px");
  axis.selectAll("line").attr("stroke", t.inkSoft);
  axis.select(".domain").attr("stroke", t.inkSoft);
}

// --- Axis labels -------------------------------------------------------------
g.append("text")
  .attr("x", iw / 2)
  .attr("y", rugTop + rugHeight + 56)
  .attr("text-anchor", "middle")
  .attr("fill", t.ink)
  .style("font-size", "16px")
  .text("Response Time (ms)");

g.append("text")
  .attr("transform", "rotate(-90)")
  .attr("x", -histHeight / 2)
  .attr("y", -70)
  .attr("text-anchor", "middle")
  .attr("fill", t.ink)
  .style("font-size", "16px")
  .text("Number of Requests");

// --- Title --------------------------------------------------------------------
svg
  .append("text")
  .attr("x", width / 2)
  .attr("y", 46)
  .attr("text-anchor", "middle")
  .attr("fill", t.ink)
  .style("font-size", "22px")
  .style("font-weight", "600")
  .text("rug-basic · javascript · d3 · anyplot.ai");
Runnable source as JSON, for any HTTP client: https://api.anyplot.ai/specs/rug-basic/d3/code. Any spec id and library id listed in llms-full.txt fit the same URL shape; every URL below is complete and callable.
{
  "spec_id": "rug-basic",
  "language": "javascript",
  "library": "d3",
  "page": "https://anyplot.ai/rug-basic/javascript/d3",
  "hub": "https://anyplot.ai/rug-basic",
  "code_json": "https://api.anyplot.ai/specs/rug-basic/d3/code",
  "spec_json": "https://api.anyplot.ai/specs/rug-basic",
  "render_light_png": "https://storage.googleapis.com/anyplot-images/plots/rug-basic/javascript/d3/plot-light.png",
  "render_dark_png": "https://storage.googleapis.com/anyplot-images/plots/rug-basic/javascript/d3/plot-dark.png",
  "interactive_light_html": "https://storage.googleapis.com/anyplot-images/plots/rug-basic/javascript/d3/plot-light.html",
  "interactive_dark_html": "https://storage.googleapis.com/anyplot-images/plots/rug-basic/javascript/d3/plot-dark.html",
  "quality_score": 96.0,
  "license": "MIT",
  "guide": "https://anyplot.ai/llms.txt"
}
Part of Basic Rug Plot on anyplot.ai.