The same plot in 14 other libraries — JavaScript: Chart.js, D3.js, Apache ECharts, MUI X Charts; Python: Altair, Bokeh, lets-plot, Matplotlib, Plotly, plotnine, Pygal, Seaborn; R: ggplot2; Julia: Makie.jl. Compare all 15 side by side: Basic Rug Plot in Python, R, Julia and JavaScript.
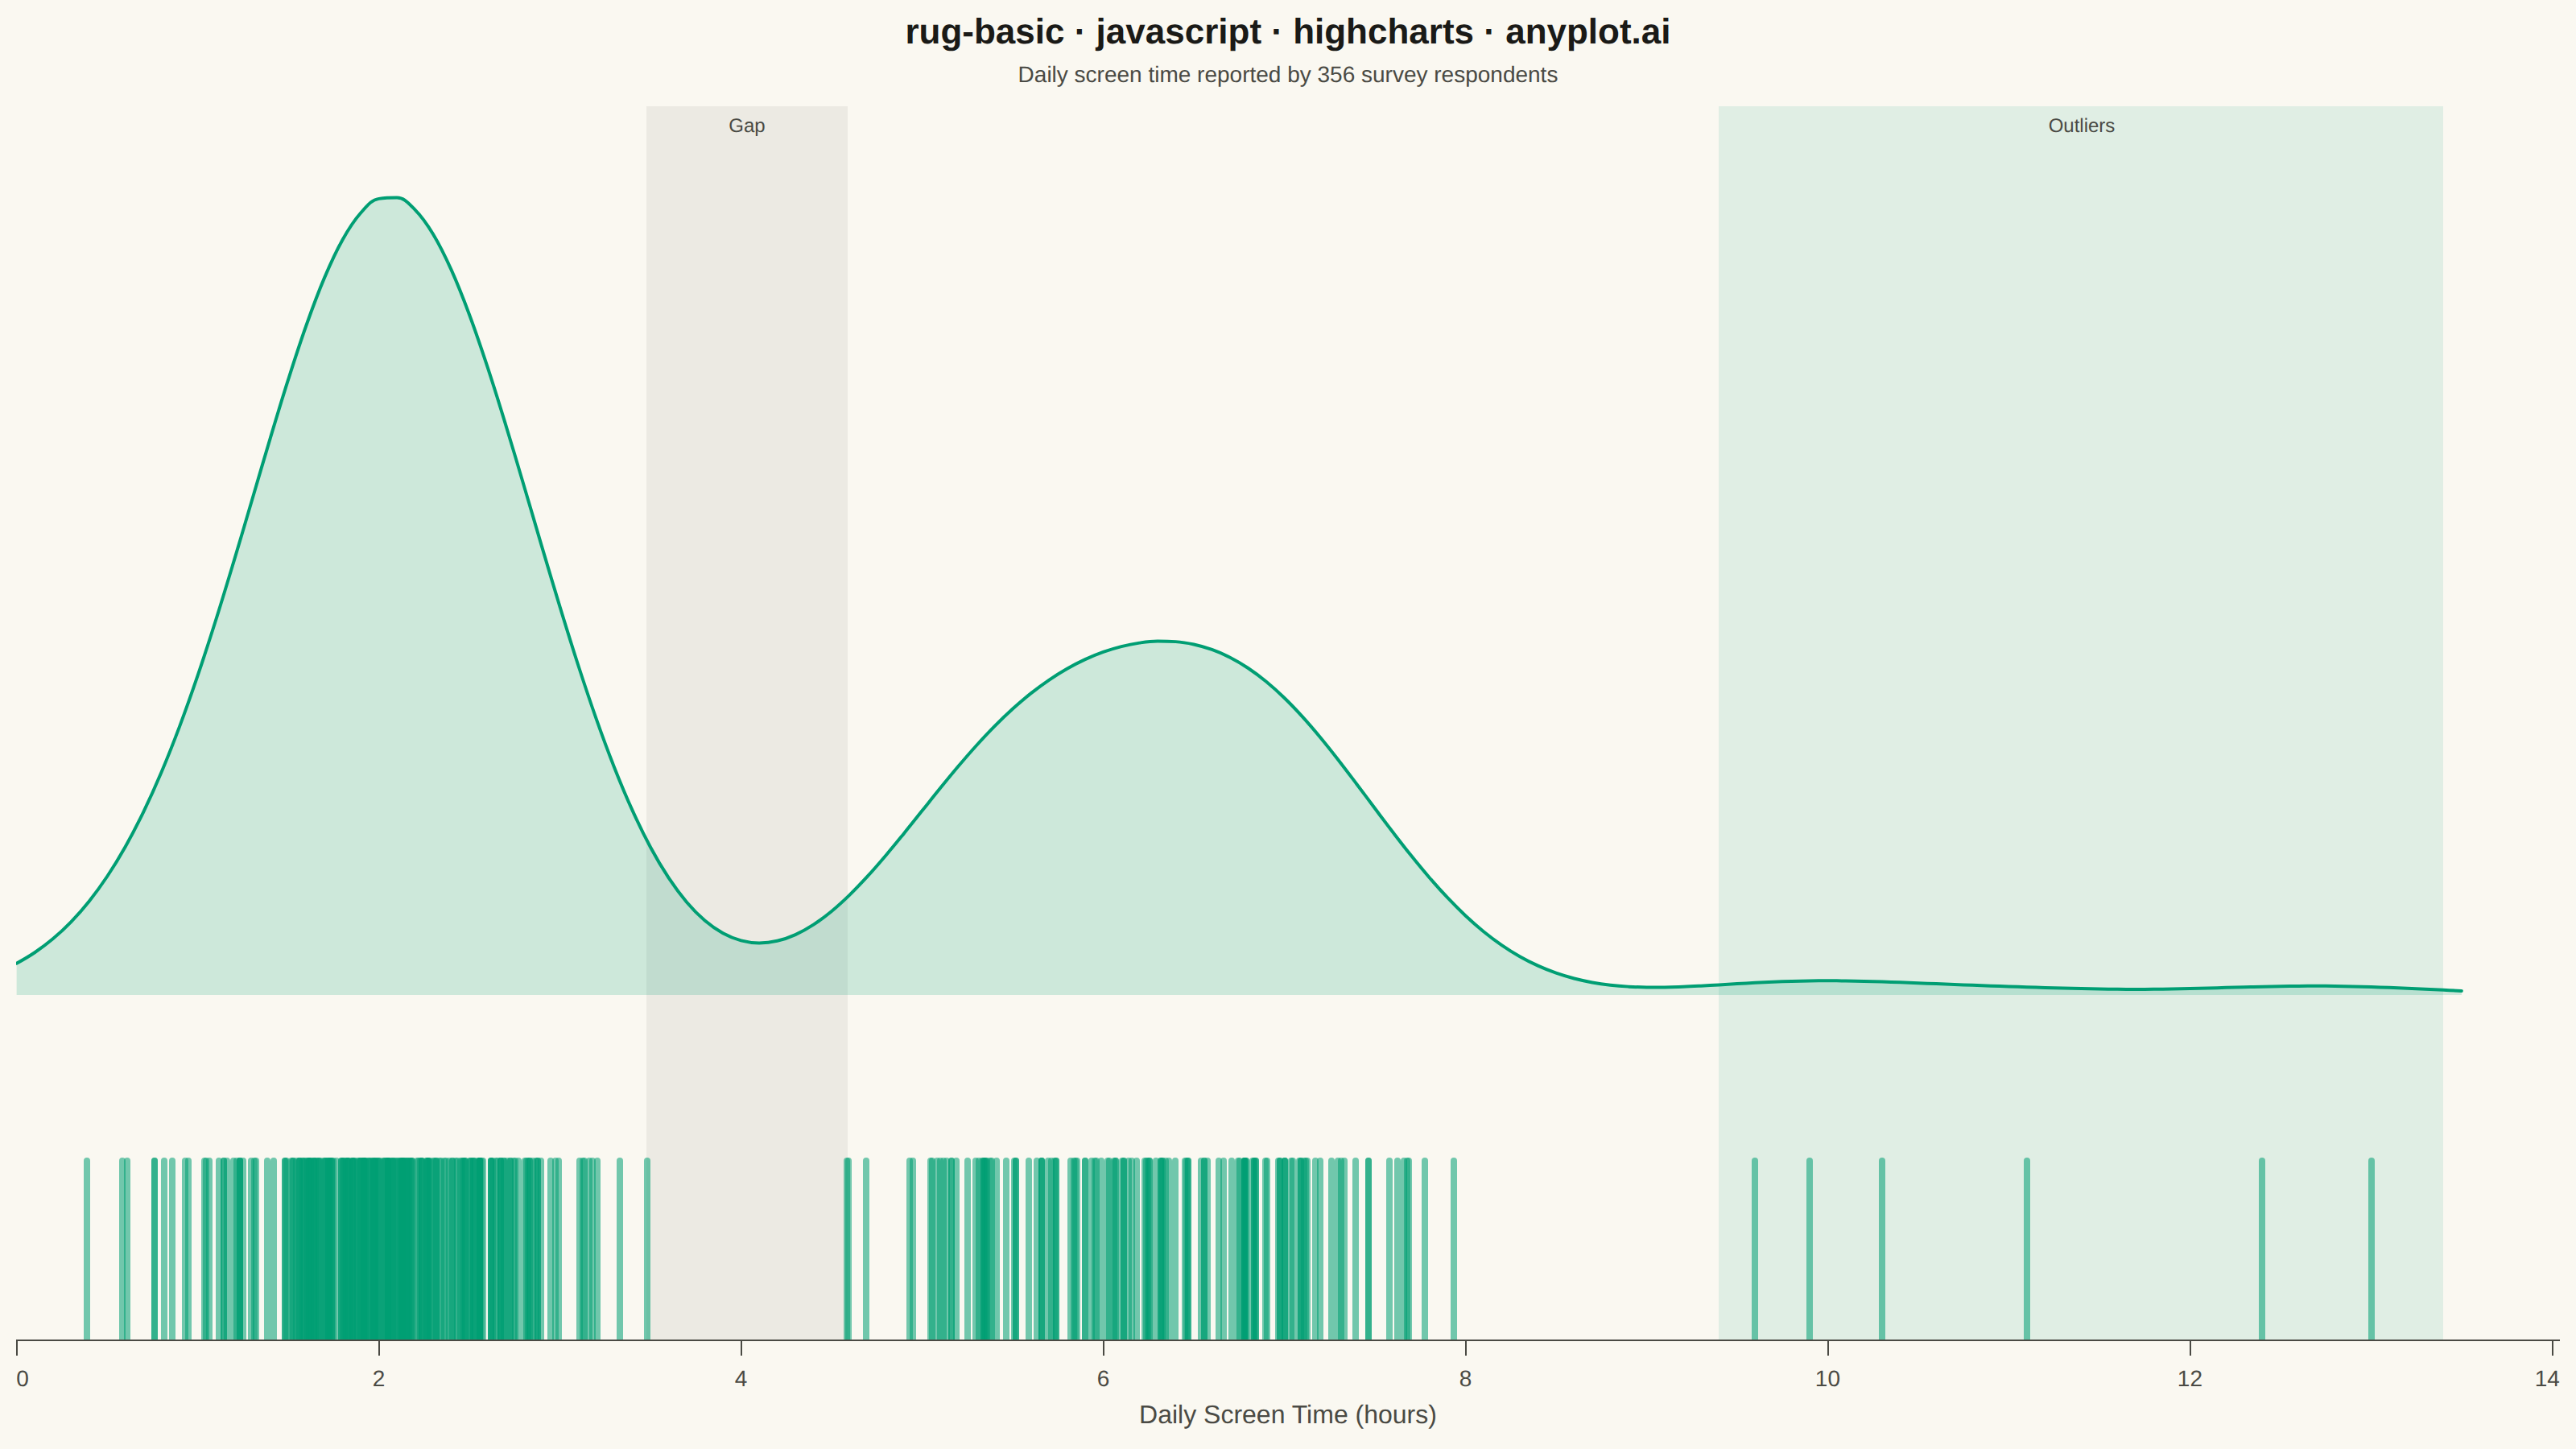
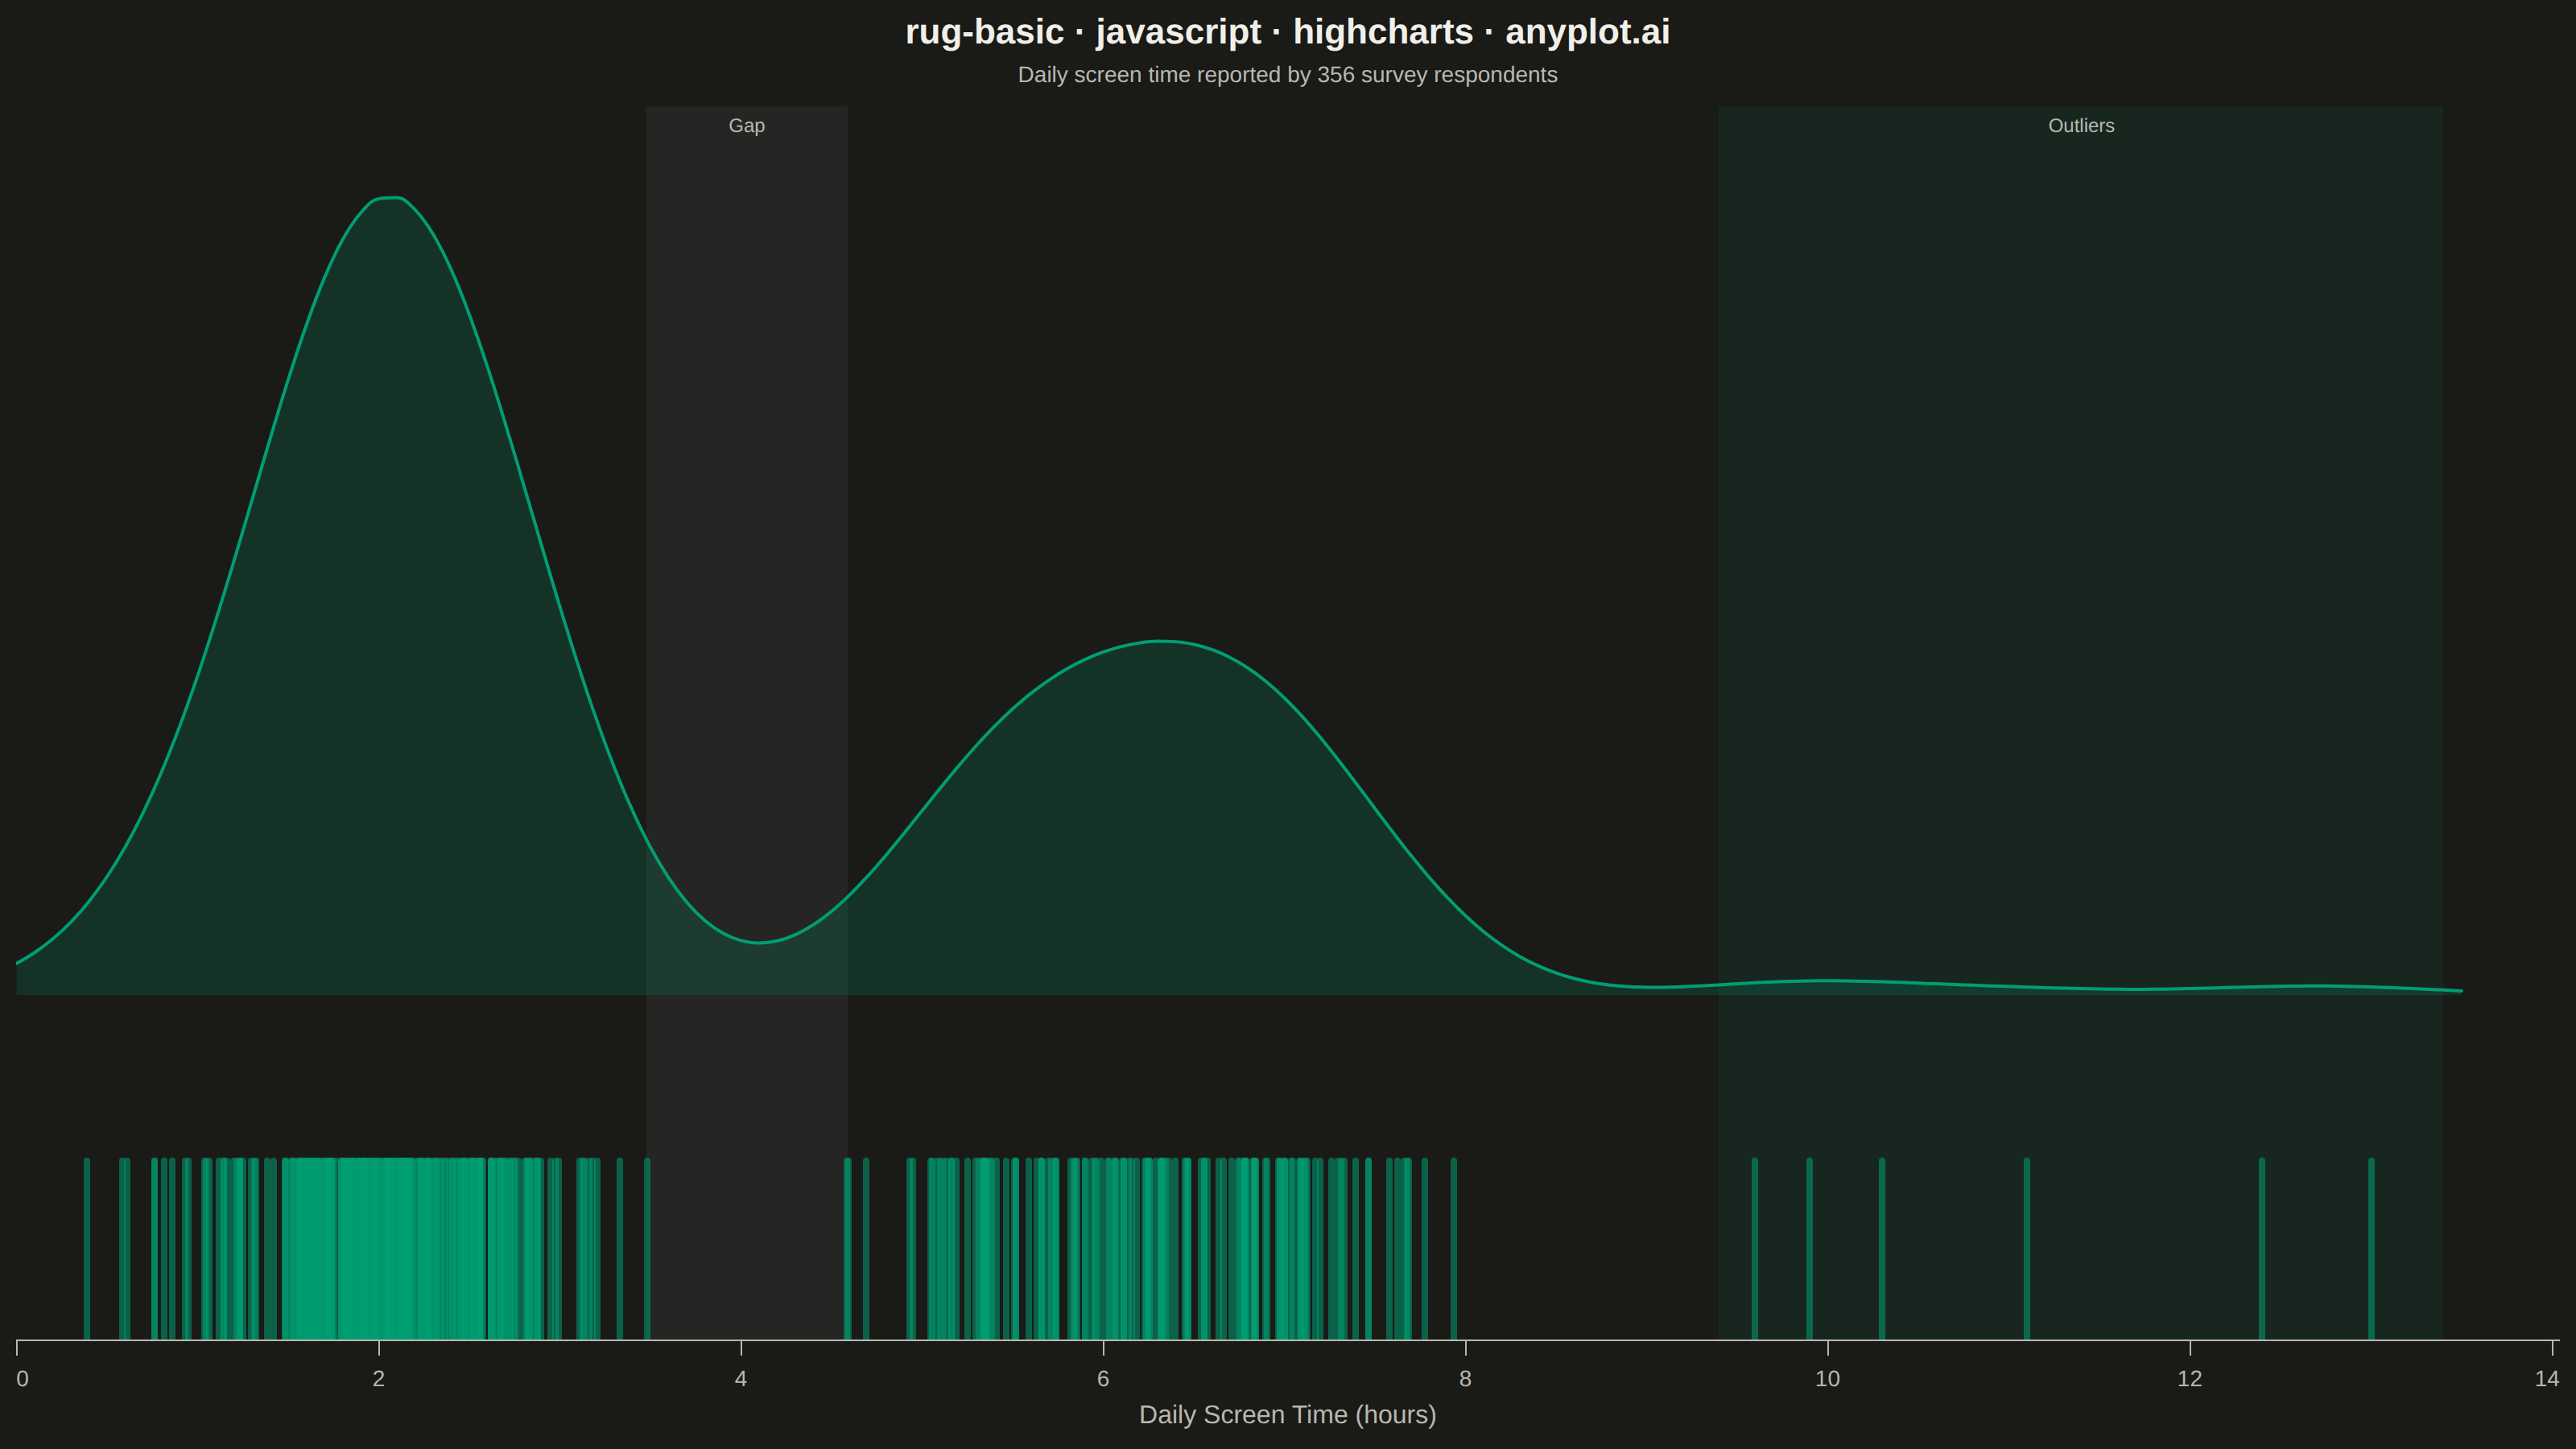
A rug plot displays individual data points as small tick marks along an axis, typically at the bottom or side of another plot. Unlike histograms or density plots that bin data, rug plots show the exact location of every observation. They reveal clustering patterns, gaps in data, and the precise distribution of values with minimal visual footprint.
// anyplot.ai
// rug-basic: Basic Rug Plot
// Library: highcharts 12.6.0 | JavaScript 22.23.1
// Quality: 93/100 | Created: 2026-07-25

const t = window.ANYPLOT_TOKENS;

// --- Data (in-memory, deterministic, fixed-seed LCG) ------------------------
// Daily screen time (hours) for 350 survey respondents: a light-use cluster
// and a heavy-use cluster with a visible gap between them, plus a handful of
// high-end outliers — exactly the clustering/gap/outlier pattern a rug plot
// reveals that a histogram's bin width would smooth over.
let seed = 42;
function lcg() {
  seed = (seed * 1664525 + 1013904223) % 4294967296;
  return seed / 4294967296;
}
function gaussian(mean, sd) {
  const u1 = Math.max(lcg(), 1e-9);
  const u2 = lcg();
  const z = Math.sqrt(-2 * Math.log(u1)) * Math.cos(2 * Math.PI * u2);
  return mean + z * sd;
}

const screenTimeHours = [];
for (let i = 0; i < 220; i++) screenTimeHours.push(Math.max(0.1, gaussian(2.0, 0.6)));
for (let i = 0; i < 130; i++) screenTimeHours.push(Math.max(0.1, gaussian(6.4, 0.9)));
[9.6, 10.3, 11.1, 12.4, 13.0, 9.9].forEach((v) => screenTimeHours.push(v));

const rugData = screenTimeHours.map((v) => [v, 1]);

// --- KDE (simple Gaussian kernel density estimate) --------------------------
// Pairs the rug with a density trace: a technique genuinely distinctive to a
// dual-pane Highcharts layout, and a much better use of the vertical canvas
// than the rug ticks alone.
const kdeBandwidth = 0.55;
const kdeCurve = [];
for (let x = 0; x <= 13.5; x += 0.1) {
  let sum = 0;
  for (const v of screenTimeHours) {
    const u = (x - v) / kdeBandwidth;
    sum += Math.exp(-0.5 * u * u);
  }
  const density = sum / (screenTimeHours.length * kdeBandwidth * Math.sqrt(2 * Math.PI));
  kdeCurve.push([Number(x.toFixed(2)), density]);
}

// --- Chart -------------------------------------------------------------------
Highcharts.chart("container", {
  chart: { backgroundColor: "transparent", animation: false,
           style: { fontFamily: "inherit" } },
  credits: { enabled: false },
  colors: t.palette,
  title: { text: "rug-basic · javascript · highcharts · anyplot.ai",
           style: { color: t.ink, fontSize: "22px", fontWeight: "600" } },
  subtitle: { text: "Daily screen time reported by 356 survey respondents",
              style: { color: t.inkSoft, fontSize: "14px" } },
  xAxis: {
    title: { text: "Daily Screen Time (hours)",
             style: { color: t.inkSoft, fontSize: "16px" } },
    lineColor: t.inkSoft, tickColor: t.inkSoft, gridLineColor: t.grid,
    labels: { style: { color: t.inkSoft, fontSize: "14px" } },
    min: 0, tickInterval: 2, minPadding: 0.02, maxPadding: 0.04,
    plotBands: [{
      from: 3.48, to: 4.59,
      color: Highcharts.color(t.inkSoft).setOpacity(0.08).get("rgba"),
      label: { text: "Gap", align: "center", y: 16,
               style: { color: t.inkSoft, fontSize: "12px" } },
    }, {
      from: 9.4, to: 13.4,
      color: Highcharts.color(t.palette[0]).setOpacity(0.1).get("rgba"),
      label: { text: "Outliers", align: "center", y: 16,
               style: { color: t.inkSoft, fontSize: "12px" } },
    }],
  },
  // Two stacked panes on one xAxis: the density curve fills the top ~72% of
  // the canvas, the rug strip owns the bottom ~22% — no more blank dead zone.
  yAxis: [{
    visible: false,
    top: "0%", height: "72%",
    min: 0,
  }, {
    visible: false,
    top: "78%", height: "22%",
    min: 0, max: 1.2,
  }],
  legend: { enabled: false },
  tooltip: {
    backgroundColor: t.elevatedBg, borderWidth: 0,
    style: { color: t.ink, fontSize: "13px" },
    headerFormat: "",
    pointFormatter: function () {
      return "Screen time: <b>" + this.x.toFixed(1) + " h</b>";
    },
  },
  plotOptions: {
    series: { animation: false },
    column: {
      pointWidth: 4,
      pointPadding: 0,
      groupPadding: 0,
      borderWidth: 0,
      color: Highcharts.color(t.palette[0]).setOpacity(0.55).get("rgba"),
      states: { hover: { brightness: 0.1 } },
    },
    areaspline: {
      lineWidth: 2,
      fillOpacity: 0.18,
      marker: { enabled: false },
      enableMouseTracking: false,
    },
  },
  series: [
    { name: "Density", type: "areaspline", yAxis: 0, color: t.palette[0], data: kdeCurve },
    { name: "Respondent", type: "column", yAxis: 1, data: rugData },
  ],
});
Runnable source as JSON, for any HTTP client: https://api.anyplot.ai/specs/rug-basic/highcharts/code. Any spec id and library id listed in llms-full.txt fit the same URL shape; every URL below is complete and callable.
{
  "spec_id": "rug-basic",
  "language": "javascript",
  "library": "highcharts",
  "page": "https://anyplot.ai/rug-basic/javascript/highcharts",
  "hub": "https://anyplot.ai/rug-basic",
  "code_json": "https://api.anyplot.ai/specs/rug-basic/highcharts/code",
  "spec_json": "https://api.anyplot.ai/specs/rug-basic",
  "render_light_png": "https://storage.googleapis.com/anyplot-images/plots/rug-basic/javascript/highcharts/plot-light.png",
  "render_dark_png": "https://storage.googleapis.com/anyplot-images/plots/rug-basic/javascript/highcharts/plot-dark.png",
  "interactive_light_html": "https://storage.googleapis.com/anyplot-images/plots/rug-basic/javascript/highcharts/plot-light.html",
  "interactive_dark_html": "https://storage.googleapis.com/anyplot-images/plots/rug-basic/javascript/highcharts/plot-dark.html",
  "quality_score": 93.0,
  "license": "MIT",
  "guide": "https://anyplot.ai/llms.txt"
}
Part of Basic Rug Plot on anyplot.ai.