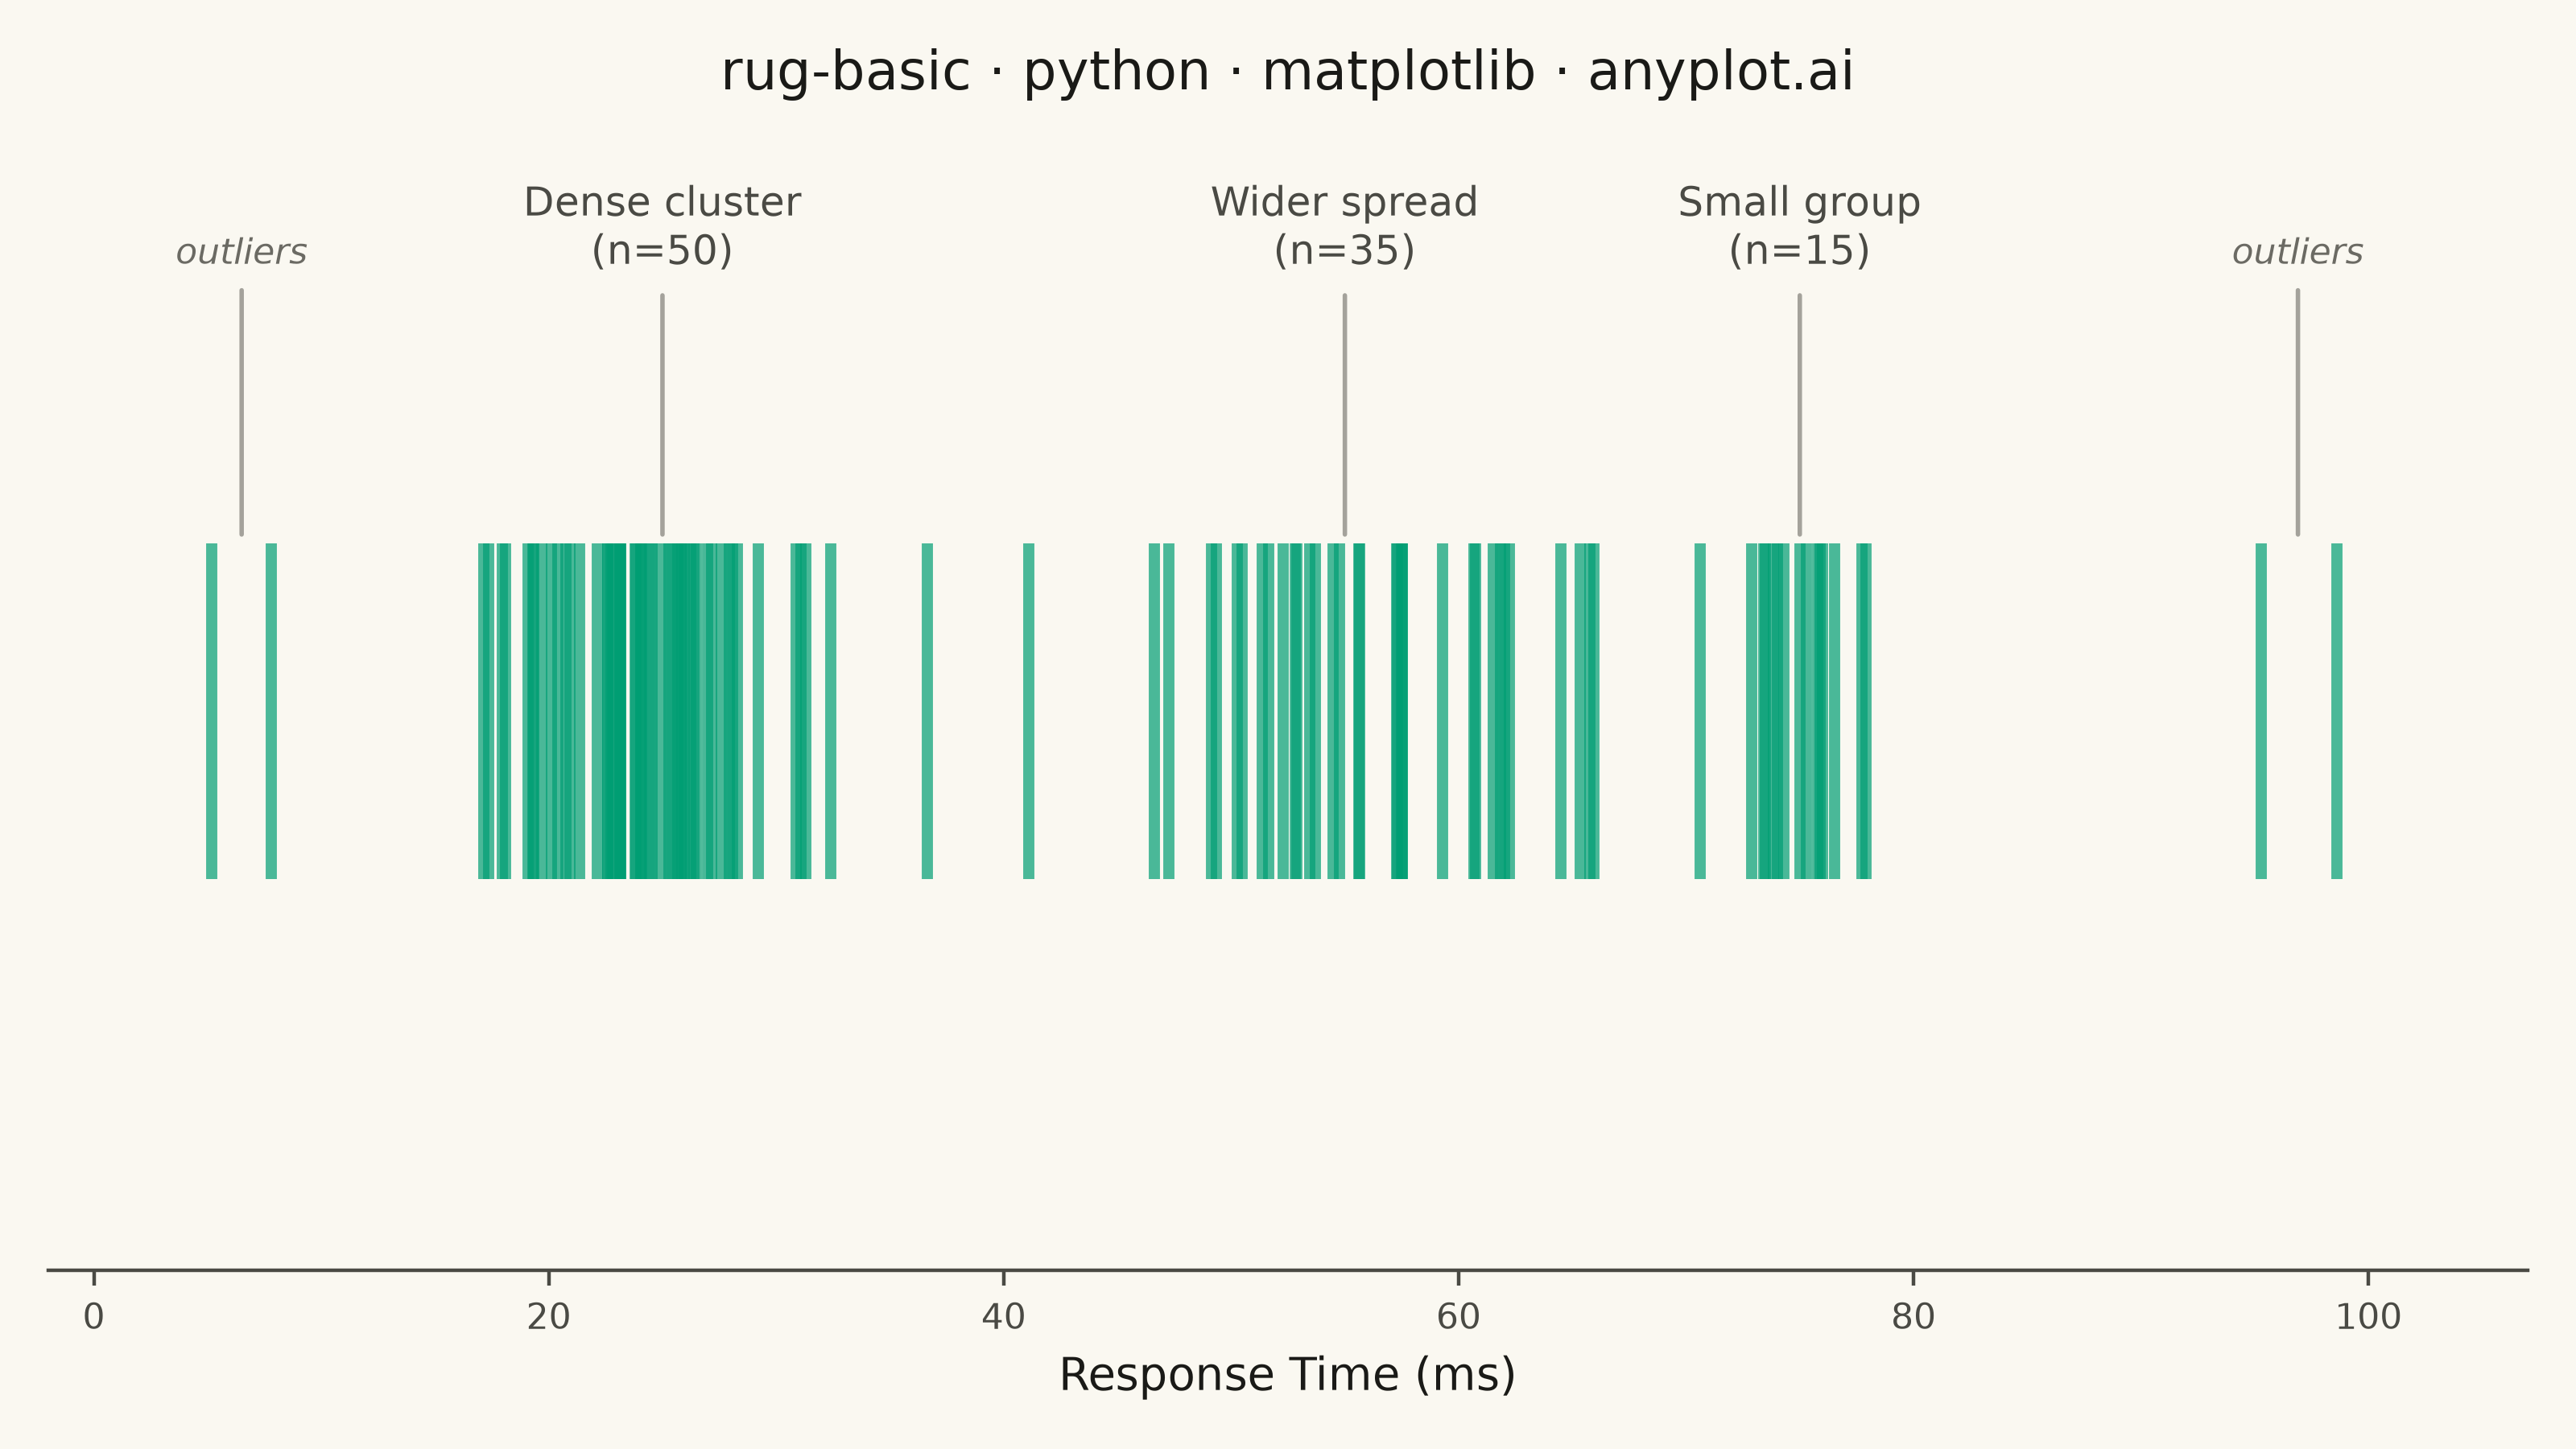
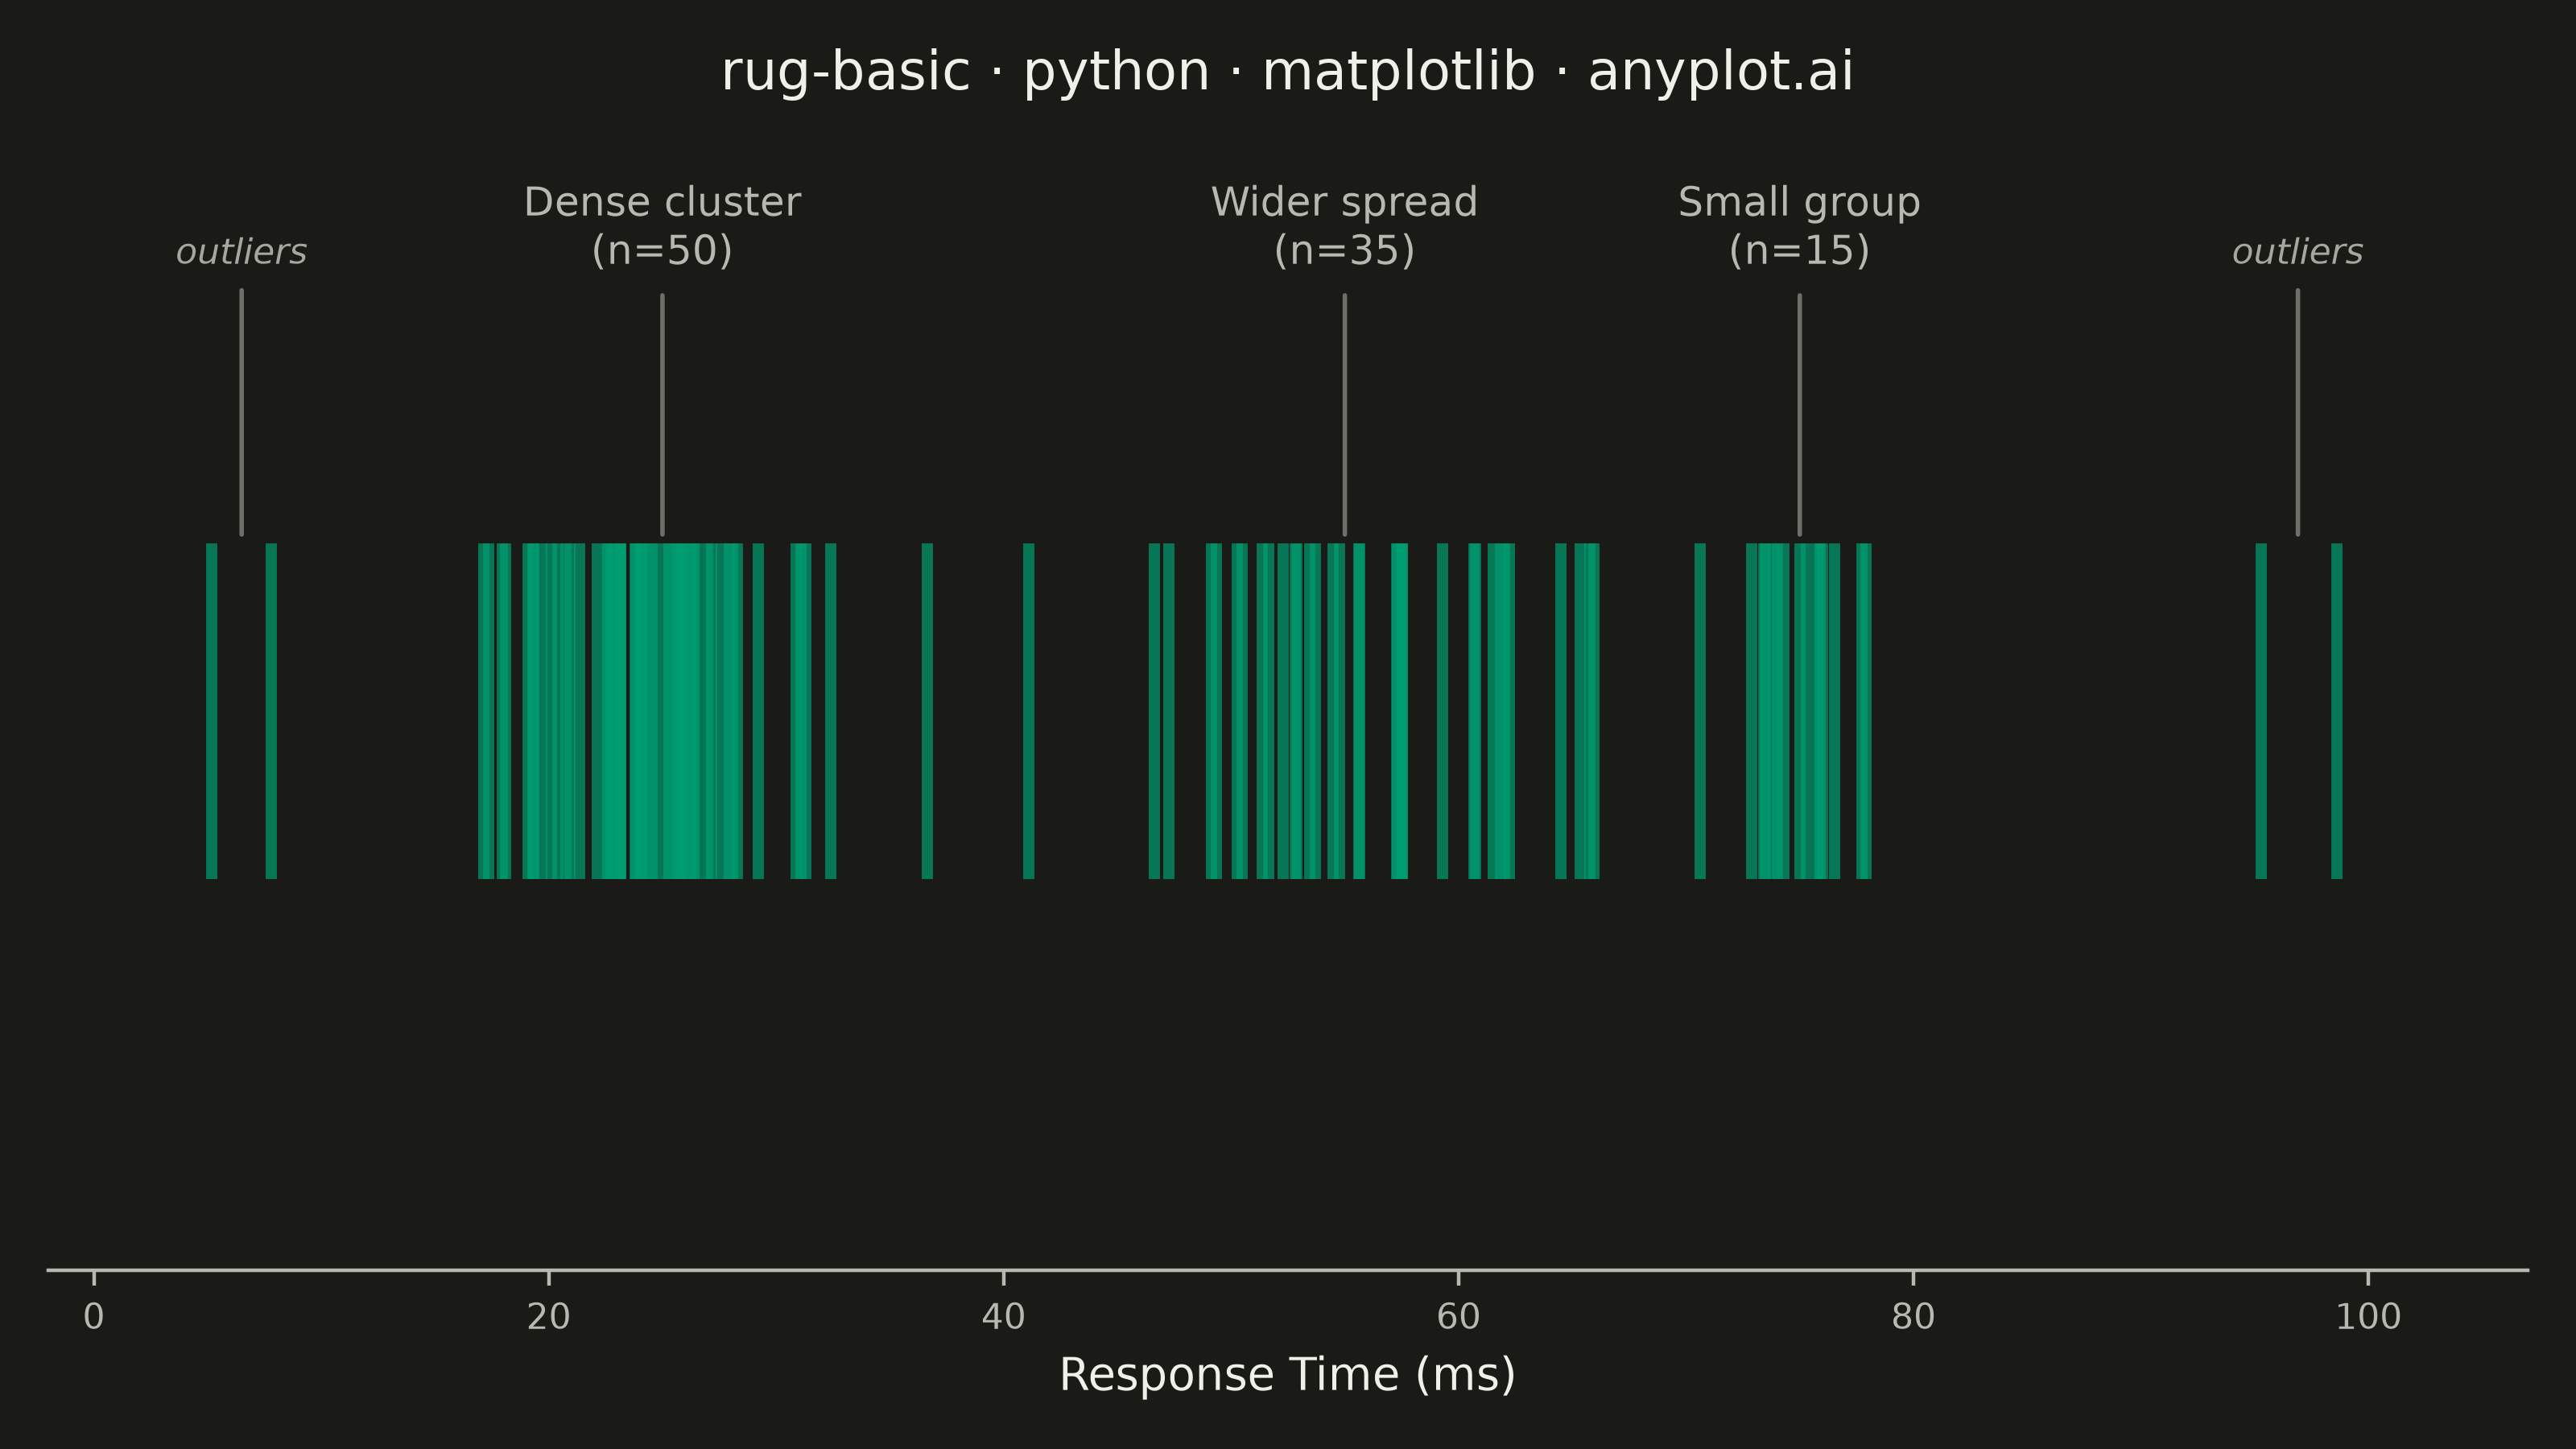
A rug plot displays individual data points as small tick marks along an axis, typically at the bottom or side of another plot. Unlike histograms or density plots that bin data, rug plots show the exact location of every observation. They reveal clustering patterns, gaps in data, and the precise distribution of values with minimal visual footprint.
""" anyplot.ai
rug-basic: Basic Rug Plot
Library: matplotlib 3.11.1 | Python 3.13.14
Quality: 90/100 | Updated: 2026-07-25
"""

import os

import matplotlib.pyplot as plt
import numpy as np


# Theme tokens
THEME = os.getenv("ANYPLOT_THEME", "light")
PAGE_BG = "#FAF8F1" if THEME == "light" else "#1A1A17"
INK = "#1A1A17" if THEME == "light" else "#F0EFE8"
INK_SOFT = "#4A4A44" if THEME == "light" else "#B8B7B0"
INK_MUTED = "#6B6A63" if THEME == "light" else "#A8A79F"
BRAND = "#009E73"  # Imprint palette position 1

# Data - trimodal response times with outliers to show clustering, gaps, and extremes
np.random.seed(42)
core_values = np.concatenate(
    [
        np.random.normal(25, 4, 50),  # Tight cluster around 25 ms
        np.random.normal(55, 7, 35),  # Wider cluster around 55 ms
        np.random.normal(75, 3, 15),  # Small cluster at high end
    ]
)
outliers = np.array([5.2, 7.8, 95.3, 98.6])  # Extreme outliers at both ends
values = np.concatenate([core_values, outliers])

# Plot
fig, ax = plt.subplots(figsize=(8, 4.5), dpi=400, facecolor=PAGE_BG)
ax.set_facecolor(PAGE_BG)

# Rug plot using ax.eventplot() — matplotlib's top-level API for 1D event distributions
# Kept small (linelengths=0.3) so marks read as ticks, not bars; alpha lowered so
# individual ticks stay distinguishable even in the densest cluster
ax.eventplot(
    values, orientation="horizontal", lineoffsets=0.5, linelengths=0.3, linewidths=2.0, colors=BRAND, alpha=0.55
)

ax.set_xlim(-2, 107)
ax.set_ylim(0.25, 1.0)  # trims the dead space below the ticks down to the x-axis

# Hide y-axis — rug plots focus on the x-distribution only
ax.set_yticks([])
ax.spines["left"].set_visible(False)
ax.spines["top"].set_visible(False)
ax.spines["right"].set_visible(False)
ax.spines["bottom"].set_color(INK_SOFT)

# Cluster annotations, anchored with arrows to the rug-mark tops (bridges the
# gap between the callout text and the data instead of floating above it)
arrow_style = {"arrowstyle": "-", "color": INK_MUTED, "lw": 1, "alpha": 0.6}
ax.annotate(
    "Dense cluster\n(n=50)",
    xy=(25, 0.65),
    xytext=(25, 0.9),
    ha="center",
    fontsize=9,
    color=INK_SOFT,
    arrowprops=arrow_style,
)
ax.annotate(
    "Wider spread\n(n=35)",
    xy=(55, 0.65),
    xytext=(55, 0.9),
    ha="center",
    fontsize=9,
    color=INK_SOFT,
    arrowprops=arrow_style,
)
ax.annotate(
    "Small group\n(n=15)",
    xy=(75, 0.65),
    xytext=(75, 0.9),
    ha="center",
    fontsize=9,
    color=INK_SOFT,
    arrowprops=arrow_style,
)

# Outlier callouts at both extremes
ax.annotate(
    "outliers",
    xy=(6.5, 0.65),
    xytext=(6.5, 0.9),
    ha="center",
    fontsize=8,
    color=INK_MUTED,
    style="italic",
    arrowprops=arrow_style,
)
ax.annotate(
    "outliers",
    xy=(96.9, 0.65),
    xytext=(96.9, 0.9),
    ha="center",
    fontsize=8,
    color=INK_MUTED,
    style="italic",
    arrowprops=arrow_style,
)

# Labels and title
ax.set_xlabel("Response Time (ms)", fontsize=10, color=INK)
ax.set_title("rug-basic · python · matplotlib · anyplot.ai", fontsize=12, fontweight="medium", color=INK, pad=14)
ax.tick_params(axis="x", labelsize=8, colors=INK_SOFT)

plt.tight_layout()
plt.savefig(f"plot-{THEME}.png", dpi=400, facecolor=PAGE_BG)  # bbox_inches MUST stay default (None)
Runnable source as JSON, for any HTTP client: https://api.anyplot.ai/specs/rug-basic/matplotlib/code. Any spec id and library id listed in llms-full.txt fit the same URL shape; every URL below is complete and callable.
{
  "spec_id": "rug-basic",
  "language": "python",
  "library": "matplotlib",
  "page": "https://anyplot.ai/rug-basic/python/matplotlib",
  "hub": "https://anyplot.ai/rug-basic",
  "code_json": "https://api.anyplot.ai/specs/rug-basic/matplotlib/code",
  "spec_json": "https://api.anyplot.ai/specs/rug-basic",
  "render_light_png": "https://storage.googleapis.com/anyplot-images/plots/rug-basic/python/matplotlib/plot-light.png",
  "render_dark_png": "https://storage.googleapis.com/anyplot-images/plots/rug-basic/python/matplotlib/plot-dark.png",
  "quality_score": 90.0,
  "license": "MIT",
  "guide": "https://anyplot.ai/llms.txt"
}
Part of Basic Rug Plot on anyplot.ai.