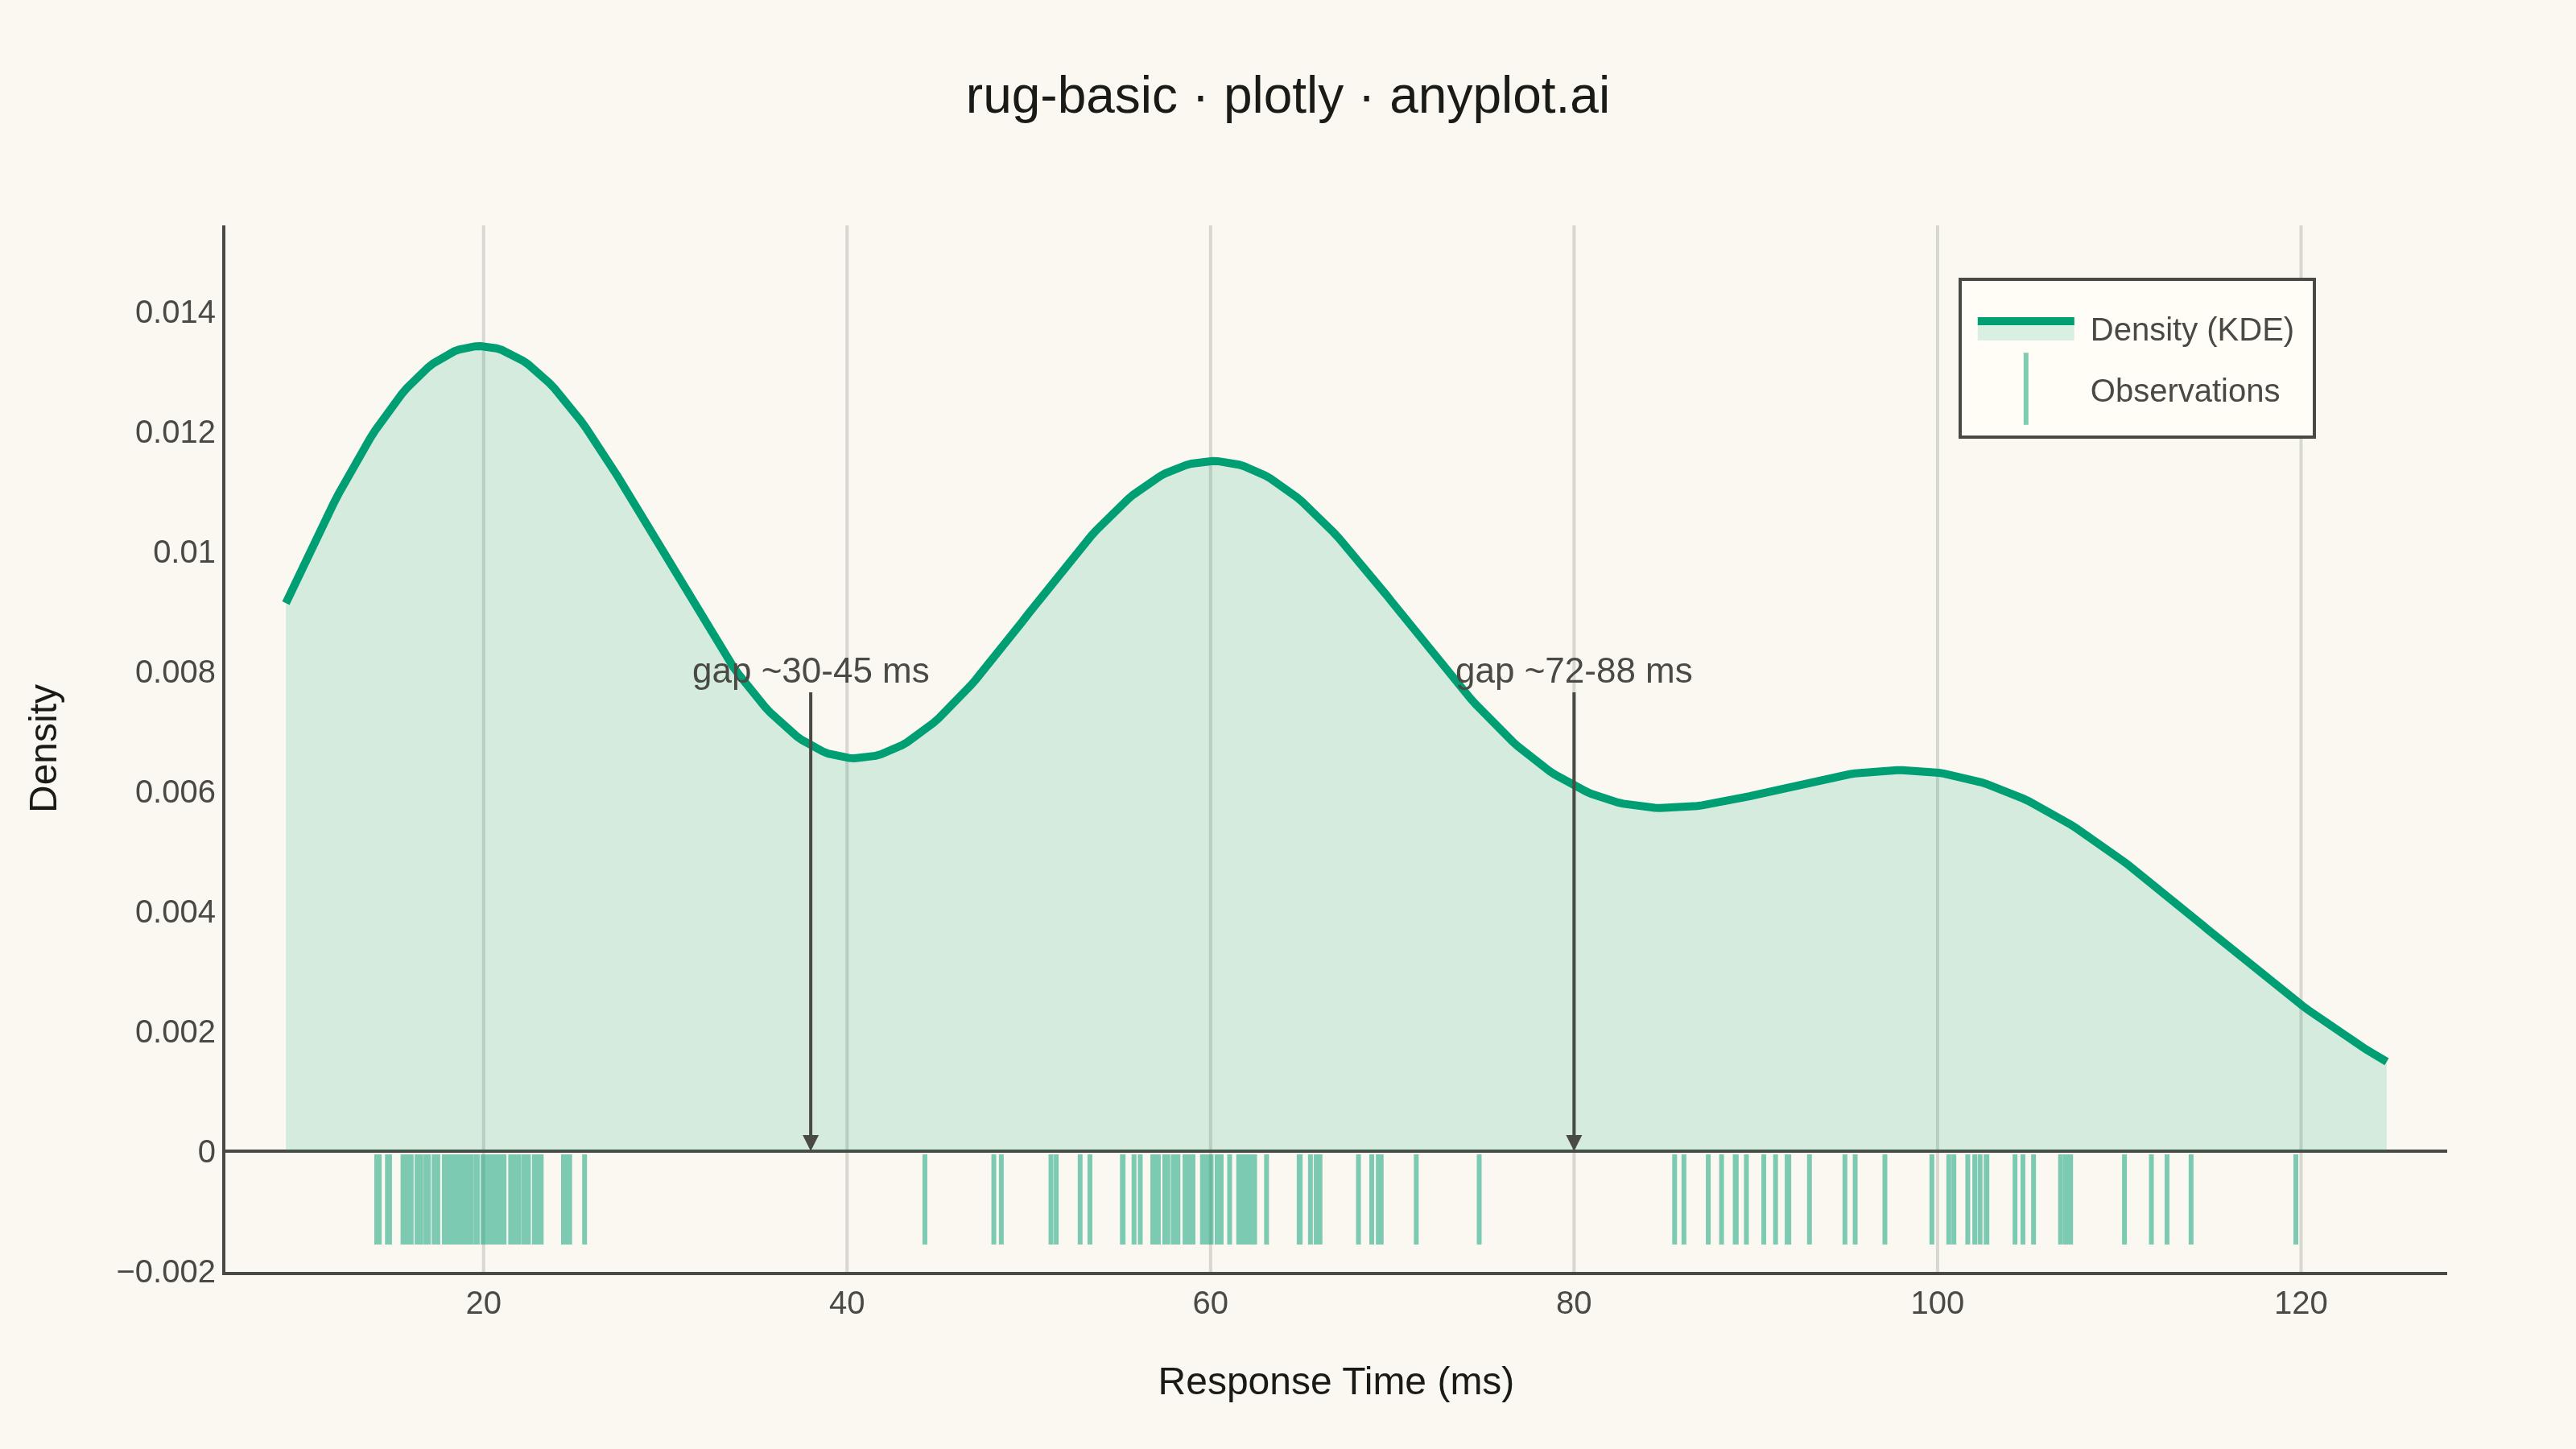
A rug plot displays individual data points as small tick marks along an axis, typically at the bottom or side of another plot. Unlike histograms or density plots that bin data, rug plots show the exact location of every observation. They reveal clustering patterns, gaps in data, and the precise distribution of values with minimal visual footprint.
""" anyplot.ai
rug-basic: Basic Rug Plot
Library: plotly 6.9.0 | Python 3.13.14
Quality: 91/100 | Updated: 2026-07-25
"""

import os

import numpy as np
import plotly.graph_objects as go
from scipy import stats


# Theme tokens
THEME = os.getenv("ANYPLOT_THEME", "light")
PAGE_BG = "#FAF8F1" if THEME == "light" else "#1A1A17"
ELEVATED_BG = "#FFFDF6" if THEME == "light" else "#242420"
INK = "#1A1A17" if THEME == "light" else "#F0EFE8"
INK_SOFT = "#4A4A44" if THEME == "light" else "#B8B7B0"
GRID = "rgba(26,26,23,0.15)" if THEME == "light" else "rgba(240,239,232,0.15)"
BRAND = "#009E73"  # Imprint palette position 1

# Data — trimodal server latency distribution: cache hit, computed response,
# cold start. Three well-separated clusters expose two distinct gaps that a
# rug plot's individual tick marks reveal far better than a coarse histogram.
np.random.seed(42)
cache_hit = np.random.normal(loc=20, scale=3, size=60)
computed = np.random.normal(loc=60, scale=6, size=55)
cold_start = np.random.normal(loc=100, scale=9, size=35)
values = np.concatenate([cache_hit, computed, cold_start])

# KDE density curve
x_kde = np.linspace(values.min() - 5, values.max() + 5, 400)
kde = stats.gaussian_kde(values, bw_method="scott")
density = kde(x_kde)
rug_y = np.full_like(values, -density.max() * 0.06)

# Figure
fig = go.Figure()

# Filled KDE density curve
fig.add_trace(
    go.Scatter(
        x=x_kde,
        y=density,
        mode="lines",
        line=dict(color=BRAND, width=2.5),
        fill="tozeroy",
        fillcolor="rgba(0,158,115,0.15)",
        name="Density (KDE)",
        hovertemplate="Response Time: %{x:.1f} ms<br>Density: %{y:.4f}<extra></extra>",
    )
)

# Rug ticks — individual observations as vertical marks below the x-axis
fig.add_trace(
    go.Scatter(
        x=values,
        y=rug_y,
        mode="markers",
        marker=dict(symbol="line-ns", size=20, line=dict(width=1.5, color=BRAND), color=BRAND),
        opacity=0.5,
        name="Observations",
        hovertemplate="Response Time: %{x:.2f} ms<extra></extra>",
    )
)

# Gap annotations — highlight the empty regions separating the three clusters.
# Anchored near the rug baseline with text pushed well above the curve peaks
# so the label never overlaps the KDE line or its fill.
fig.add_annotation(
    x=38,
    y=0,
    text="gap ~30-45 ms",
    showarrow=True,
    arrowhead=2,
    arrowcolor=INK_SOFT,
    font=dict(size=11, color=INK_SOFT),
    ax=0,
    ay=-150,
)
fig.add_annotation(
    x=80,
    y=0,
    text="gap ~72-88 ms",
    showarrow=True,
    arrowhead=2,
    arrowcolor=INK_SOFT,
    font=dict(size=11, color=INK_SOFT),
    ax=0,
    ay=-150,
)

# Layout
fig.update_layout(
    autosize=False,
    title=dict(text="rug-basic · plotly · anyplot.ai", font=dict(size=16, color=INK), x=0.5, xanchor="center"),
    xaxis=dict(
        title=dict(text="Response Time (ms)", font=dict(size=12, color=INK)),
        tickfont=dict(size=10, color=INK_SOFT),
        showgrid=True,
        gridcolor=GRID,
        gridwidth=1,
        zeroline=False,
        linecolor=INK_SOFT,
        showline=True,
    ),
    yaxis=dict(
        title=dict(text="Density", font=dict(size=12, color=INK)),
        tickfont=dict(size=10, color=INK_SOFT),
        showgrid=False,
        zeroline=True,
        zerolinecolor=INK_SOFT,
        zerolinewidth=1,
        linecolor=INK_SOFT,
        showline=True,
        range=[-density.max() * 0.15, density.max() * 1.15],
    ),
    paper_bgcolor=PAGE_BG,
    plot_bgcolor=PAGE_BG,
    font=dict(color=INK),
    legend=dict(
        bgcolor=ELEVATED_BG, bordercolor=INK_SOFT, borderwidth=1, font=dict(size=10, color=INK_SOFT), x=0.78, y=0.95
    ),
    margin=dict(l=70, r=40, t=70, b=55),
)

# Save
fig.write_image(f"plot-{THEME}.png", width=800, height=450, scale=4)
fig.write_html(f"plot-{THEME}.html", include_plotlyjs="cdn")
Runnable source as JSON, for any HTTP client: https://api.anyplot.ai/specs/rug-basic/plotly/code. Any spec id and library id listed in llms-full.txt fit the same URL shape; every URL below is complete and callable.
{
  "spec_id": "rug-basic",
  "language": "python",
  "library": "plotly",
  "page": "https://anyplot.ai/rug-basic/python/plotly",
  "hub": "https://anyplot.ai/rug-basic",
  "code_json": "https://api.anyplot.ai/specs/rug-basic/plotly/code",
  "spec_json": "https://api.anyplot.ai/specs/rug-basic",
  "render_light_png": "https://storage.googleapis.com/anyplot-images/plots/rug-basic/python/plotly/plot-light.png",
  "render_dark_png": "https://storage.googleapis.com/anyplot-images/plots/rug-basic/python/plotly/plot-dark.png",
  "interactive_light_html": "https://storage.googleapis.com/anyplot-images/plots/rug-basic/python/plotly/plot-light.html",
  "interactive_dark_html": "https://storage.googleapis.com/anyplot-images/plots/rug-basic/python/plotly/plot-dark.html",
  "quality_score": 91.0,
  "license": "MIT",
  "guide": "https://anyplot.ai/llms.txt"
}
Part of Basic Rug Plot on anyplot.ai.