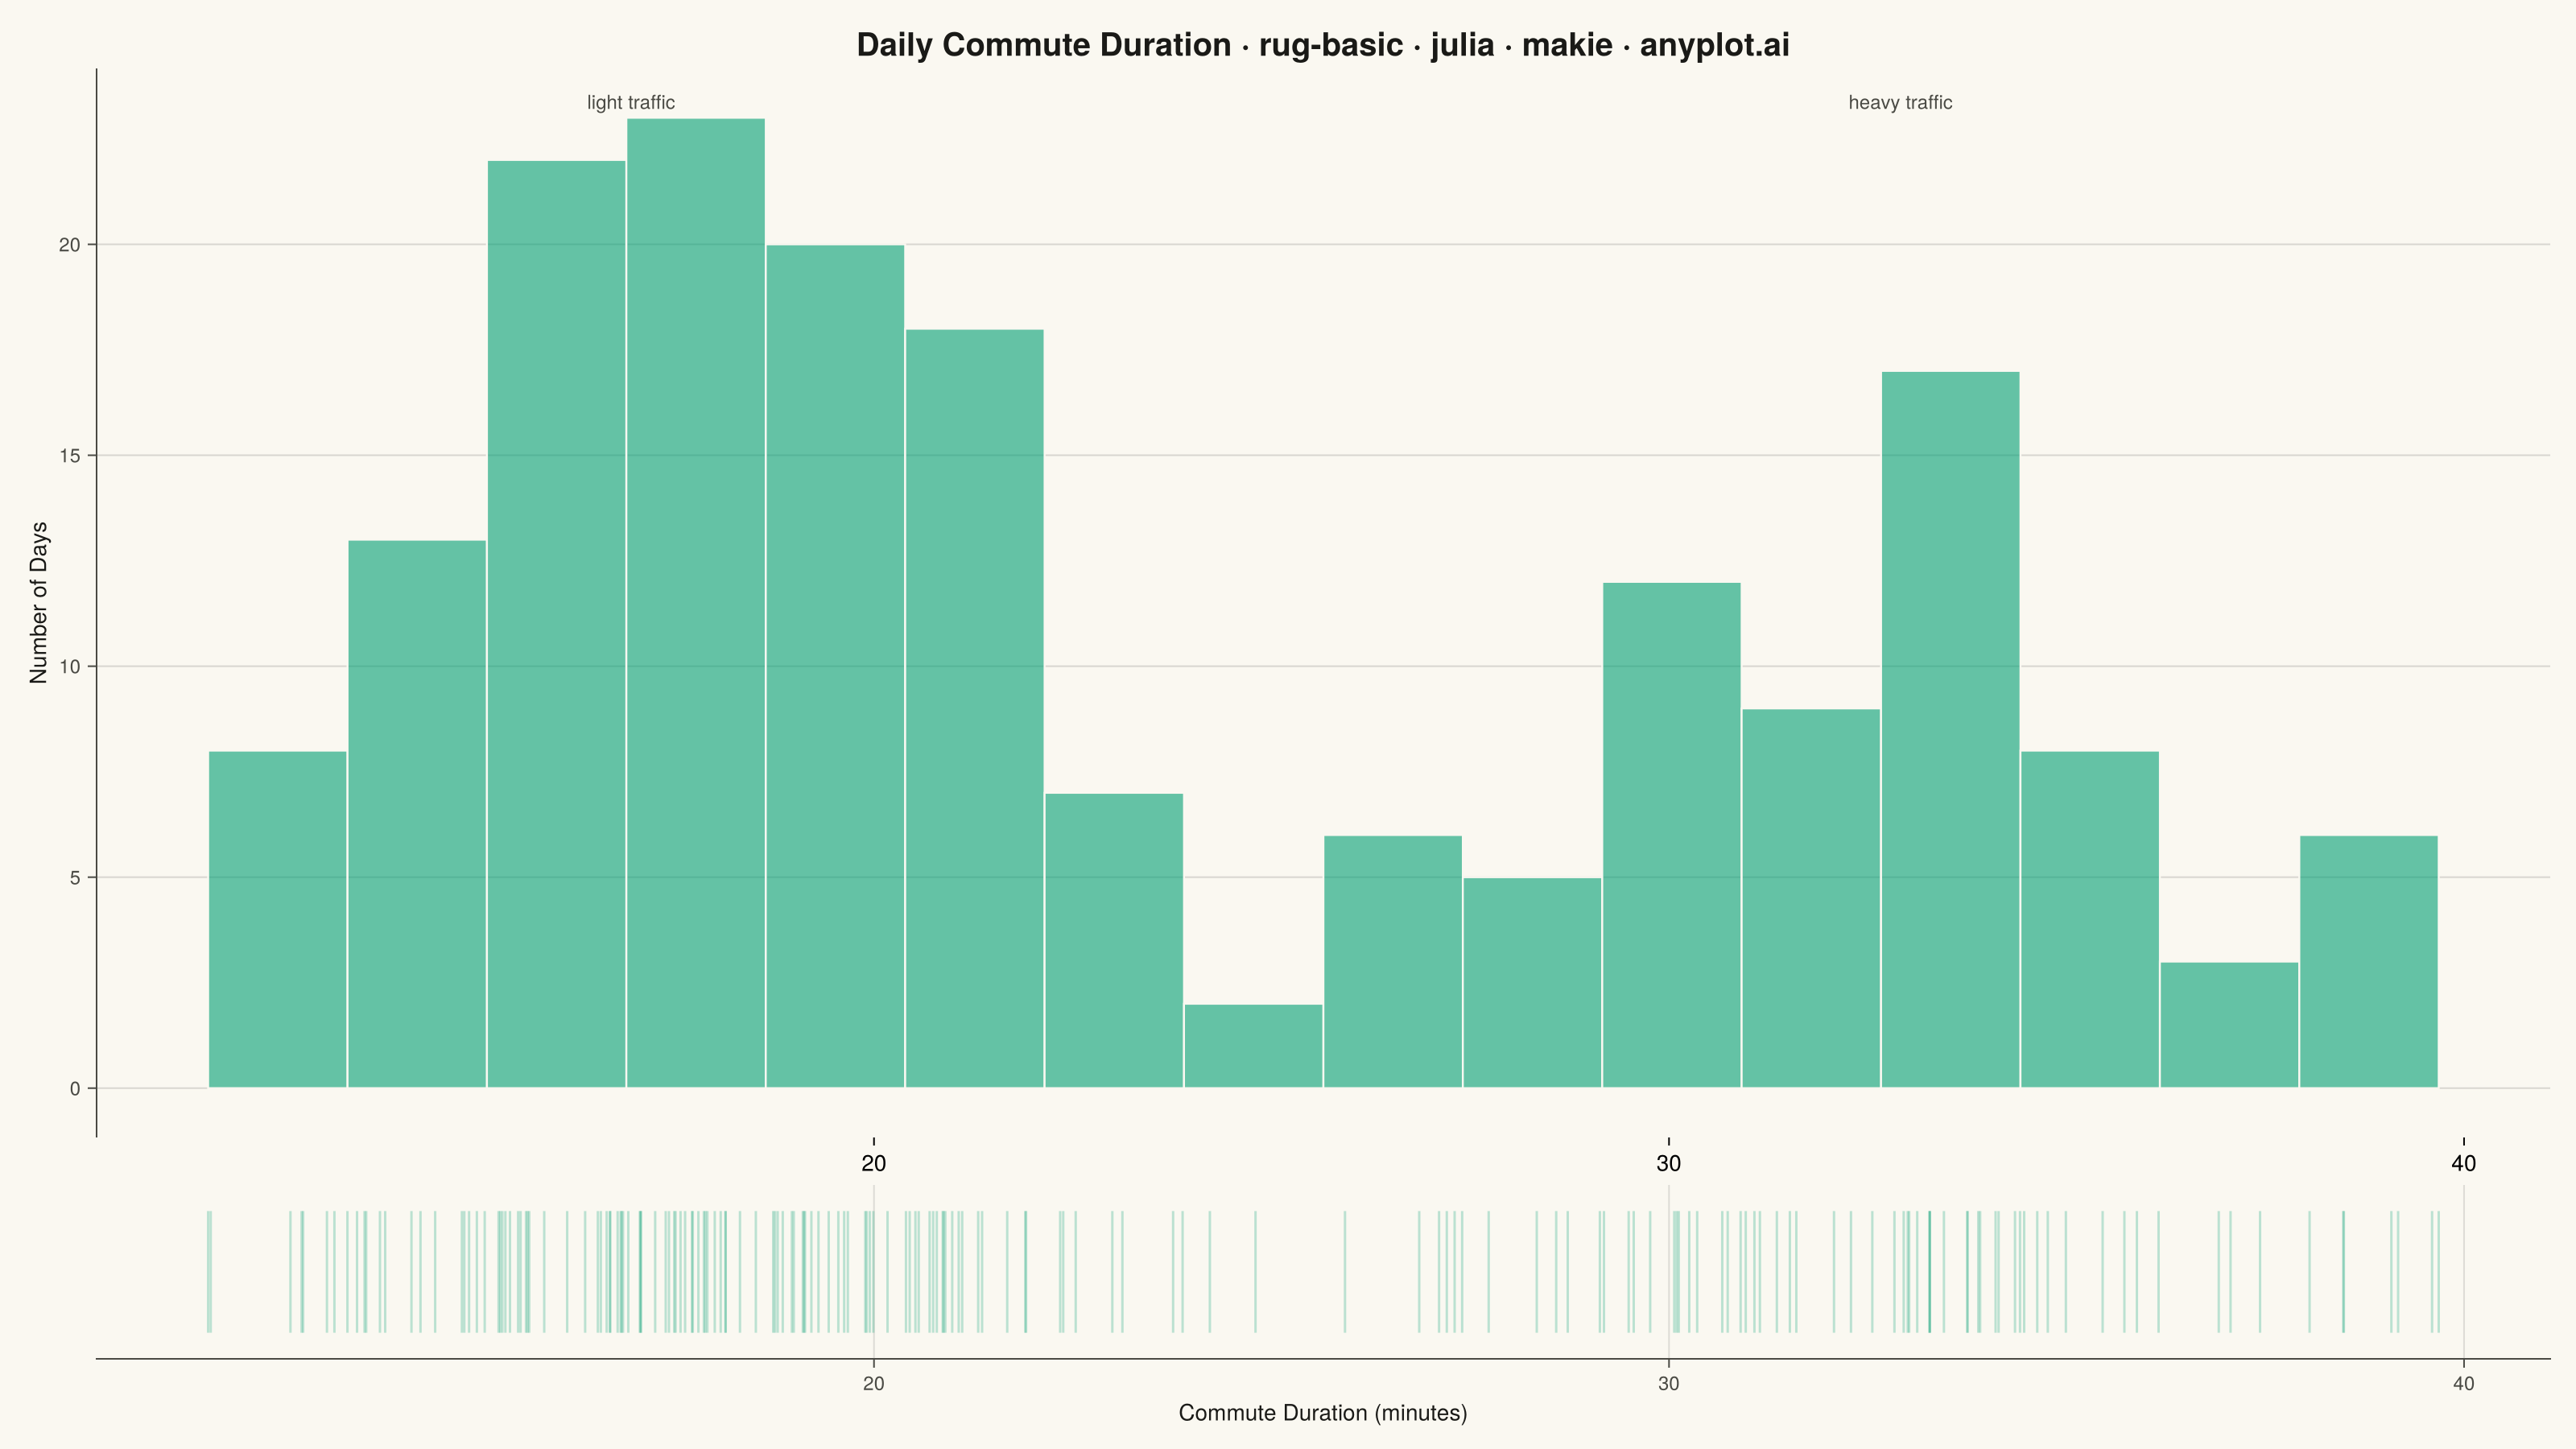
The same plot in 14 other libraries — Python: Altair, Bokeh, lets-plot, Matplotlib, Plotly, plotnine, Pygal, Seaborn; R: ggplot2; JavaScript: Chart.js, D3.js, Apache ECharts, Highcharts, MUI X Charts. Compare all 15 side by side: Basic Rug Plot in Python, R, Julia and JavaScript.
A rug plot displays individual data points as small tick marks along an axis, typically at the bottom or side of another plot. Unlike histograms or density plots that bin data, rug plots show the exact location of every observation. They reveal clustering patterns, gaps in data, and the precise distribution of values with minimal visual footprint.
# anyplot.ai
# rug-basic: Basic Rug Plot
# Library: makie 0.21.9 | Julia 1.11.9
# Quality: 92/100 | Created: 2026-07-25

using CairoMakie
using Colors
using Random

# Theme tokens (see prompts/default-style-guide.md "Background" + "Theme-adaptive Chrome")
const THEME    = get(ENV, "ANYPLOT_THEME", "light")
const PAGE_BG  = THEME == "light" ? colorant"#FAF8F1" : colorant"#1A1A17"
const INK      = THEME == "light" ? colorant"#1A1A17" : colorant"#F0EFE8"
const INK_SOFT = THEME == "light" ? colorant"#4A4A44" : colorant"#B8B7B0"
const IMPRINT_PALETTE = [
    colorant"#009E73", colorant"#C475FD", colorant"#4467A3", colorant"#BD8233",
    colorant"#AE3030", colorant"#2ABCCD", colorant"#954477", colorant"#99B314",
]
const BRAND = IMPRINT_PALETTE[1]  # Imprint palette position 1 — ALWAYS first series

# Data — bimodal commute durations (light-traffic vs. heavy-traffic days)
Random.seed!(42)
light_traffic_days = 18.0 .+ 3.0 .* randn(110)
heavy_traffic_days = 32.0 .+ 4.0 .* randn(70)
commute_minutes = vcat(light_traffic_days, heavy_traffic_days)

title_str = "Daily Commute Duration · rug-basic · julia · makie · anyplot.ai"

# Plot — stacked panels sharing an x-axis: histogram on top, rug strip below
fig = Figure(
    size            = (1600, 900),
    fontsize        = 14,
    backgroundcolor = PAGE_BG,
)

ax_hist = Axis(
    fig[1, 1];
    title             = title_str,
    titlesize         = 20,
    titlecolor        = INK,
    ylabel            = "Number of Days",
    ylabelsize        = 14,
    ylabelcolor       = INK,
    yticklabelsize    = 12,
    yticklabelcolor   = INK_SOFT,
    ytickcolor        = INK_SOFT,
    backgroundcolor   = PAGE_BG,
    topspinevisible   = false,
    rightspinevisible = false,
    bottomspinevisible = false,
    leftspinecolor    = INK_SOFT,
    ygridvisible      = true,
    ygridcolor        = RGBAf(INK.r, INK.g, INK.b, 0.15),
    xgridvisible      = false,
)

ax_rug = Axis(
    fig[2, 1];
    xlabel            = "Commute Duration (minutes)",
    xlabelsize        = 14,
    xlabelcolor       = INK,
    xticklabelsize    = 12,
    xticklabelcolor   = INK_SOFT,
    xtickcolor        = INK_SOFT,
    backgroundcolor   = PAGE_BG,
    topspinevisible   = false,
    rightspinevisible = false,
    leftspinevisible  = false,
    bottomspinecolor  = INK_SOFT,
)
hideydecorations!(ax_rug)

bin_edges = range(minimum(commute_minutes), maximum(commute_minutes); length = 17)
hist!(ax_hist, commute_minutes;
      bins = bin_edges, color = (BRAND, 0.6), strokecolor = PAGE_BG, strokewidth = 1.2)

# Callout distinguishing the two commute modes revealed by the bimodal shape,
# positioned relative to each cluster's mean within the shared data range
xmin, xmax = extrema(commute_minutes)
light_rel = (sum(light_traffic_days) / length(light_traffic_days) - xmin) / (xmax - xmin)
heavy_rel = (sum(heavy_traffic_days) / length(heavy_traffic_days) - xmin) / (xmax - xmin)
text!(ax_hist, light_rel, 0.98; text = "light traffic", align = (:center, :top),
      space = :relative, fontsize = 12, color = INK_SOFT)
text!(ax_hist, heavy_rel, 0.98; text = "heavy traffic", align = (:center, :top),
      space = :relative, fontsize = 12, color = INK_SOFT)

# Rug ticks — one short vertical segment per observation, thin and light so
# density variation stays legible even where observations overlap heavily
rug_segments = Vector{Point2f}(undef, 2 * length(commute_minutes))
for (i, v) in enumerate(commute_minutes)
    rug_segments[2i - 1] = Point2f(v, 0.15)
    rug_segments[2i]     = Point2f(v, 0.85)
end
linesegments!(ax_rug, rug_segments; color = (BRAND, 0.25), linewidth = 1.5)

linkxaxes!(ax_hist, ax_rug)
ylims!(ax_rug, 0, 1)
rowsize!(fig.layout, 2, Relative(0.14))
rowgap!(fig.layout, 1, 6)

# Save
save("plot-$(THEME).png", fig; px_per_unit = 2)
Runnable source as JSON, for any HTTP client: https://api.anyplot.ai/specs/rug-basic/makie/code. Any spec id and library id listed in llms-full.txt fit the same URL shape; every URL below is complete and callable.
{
  "spec_id": "rug-basic",
  "language": "julia",
  "library": "makie",
  "page": "https://anyplot.ai/rug-basic/julia/makie",
  "hub": "https://anyplot.ai/rug-basic",
  "code_json": "https://api.anyplot.ai/specs/rug-basic/makie/code",
  "spec_json": "https://api.anyplot.ai/specs/rug-basic",
  "render_light_png": "https://storage.googleapis.com/anyplot-images/plots/rug-basic/julia/makie/plot-light.png",
  "render_dark_png": "https://storage.googleapis.com/anyplot-images/plots/rug-basic/julia/makie/plot-dark.png",
  "quality_score": 92.0,
  "license": "MIT",
  "guide": "https://anyplot.ai/llms.txt"
}
Part of Basic Rug Plot on anyplot.ai.