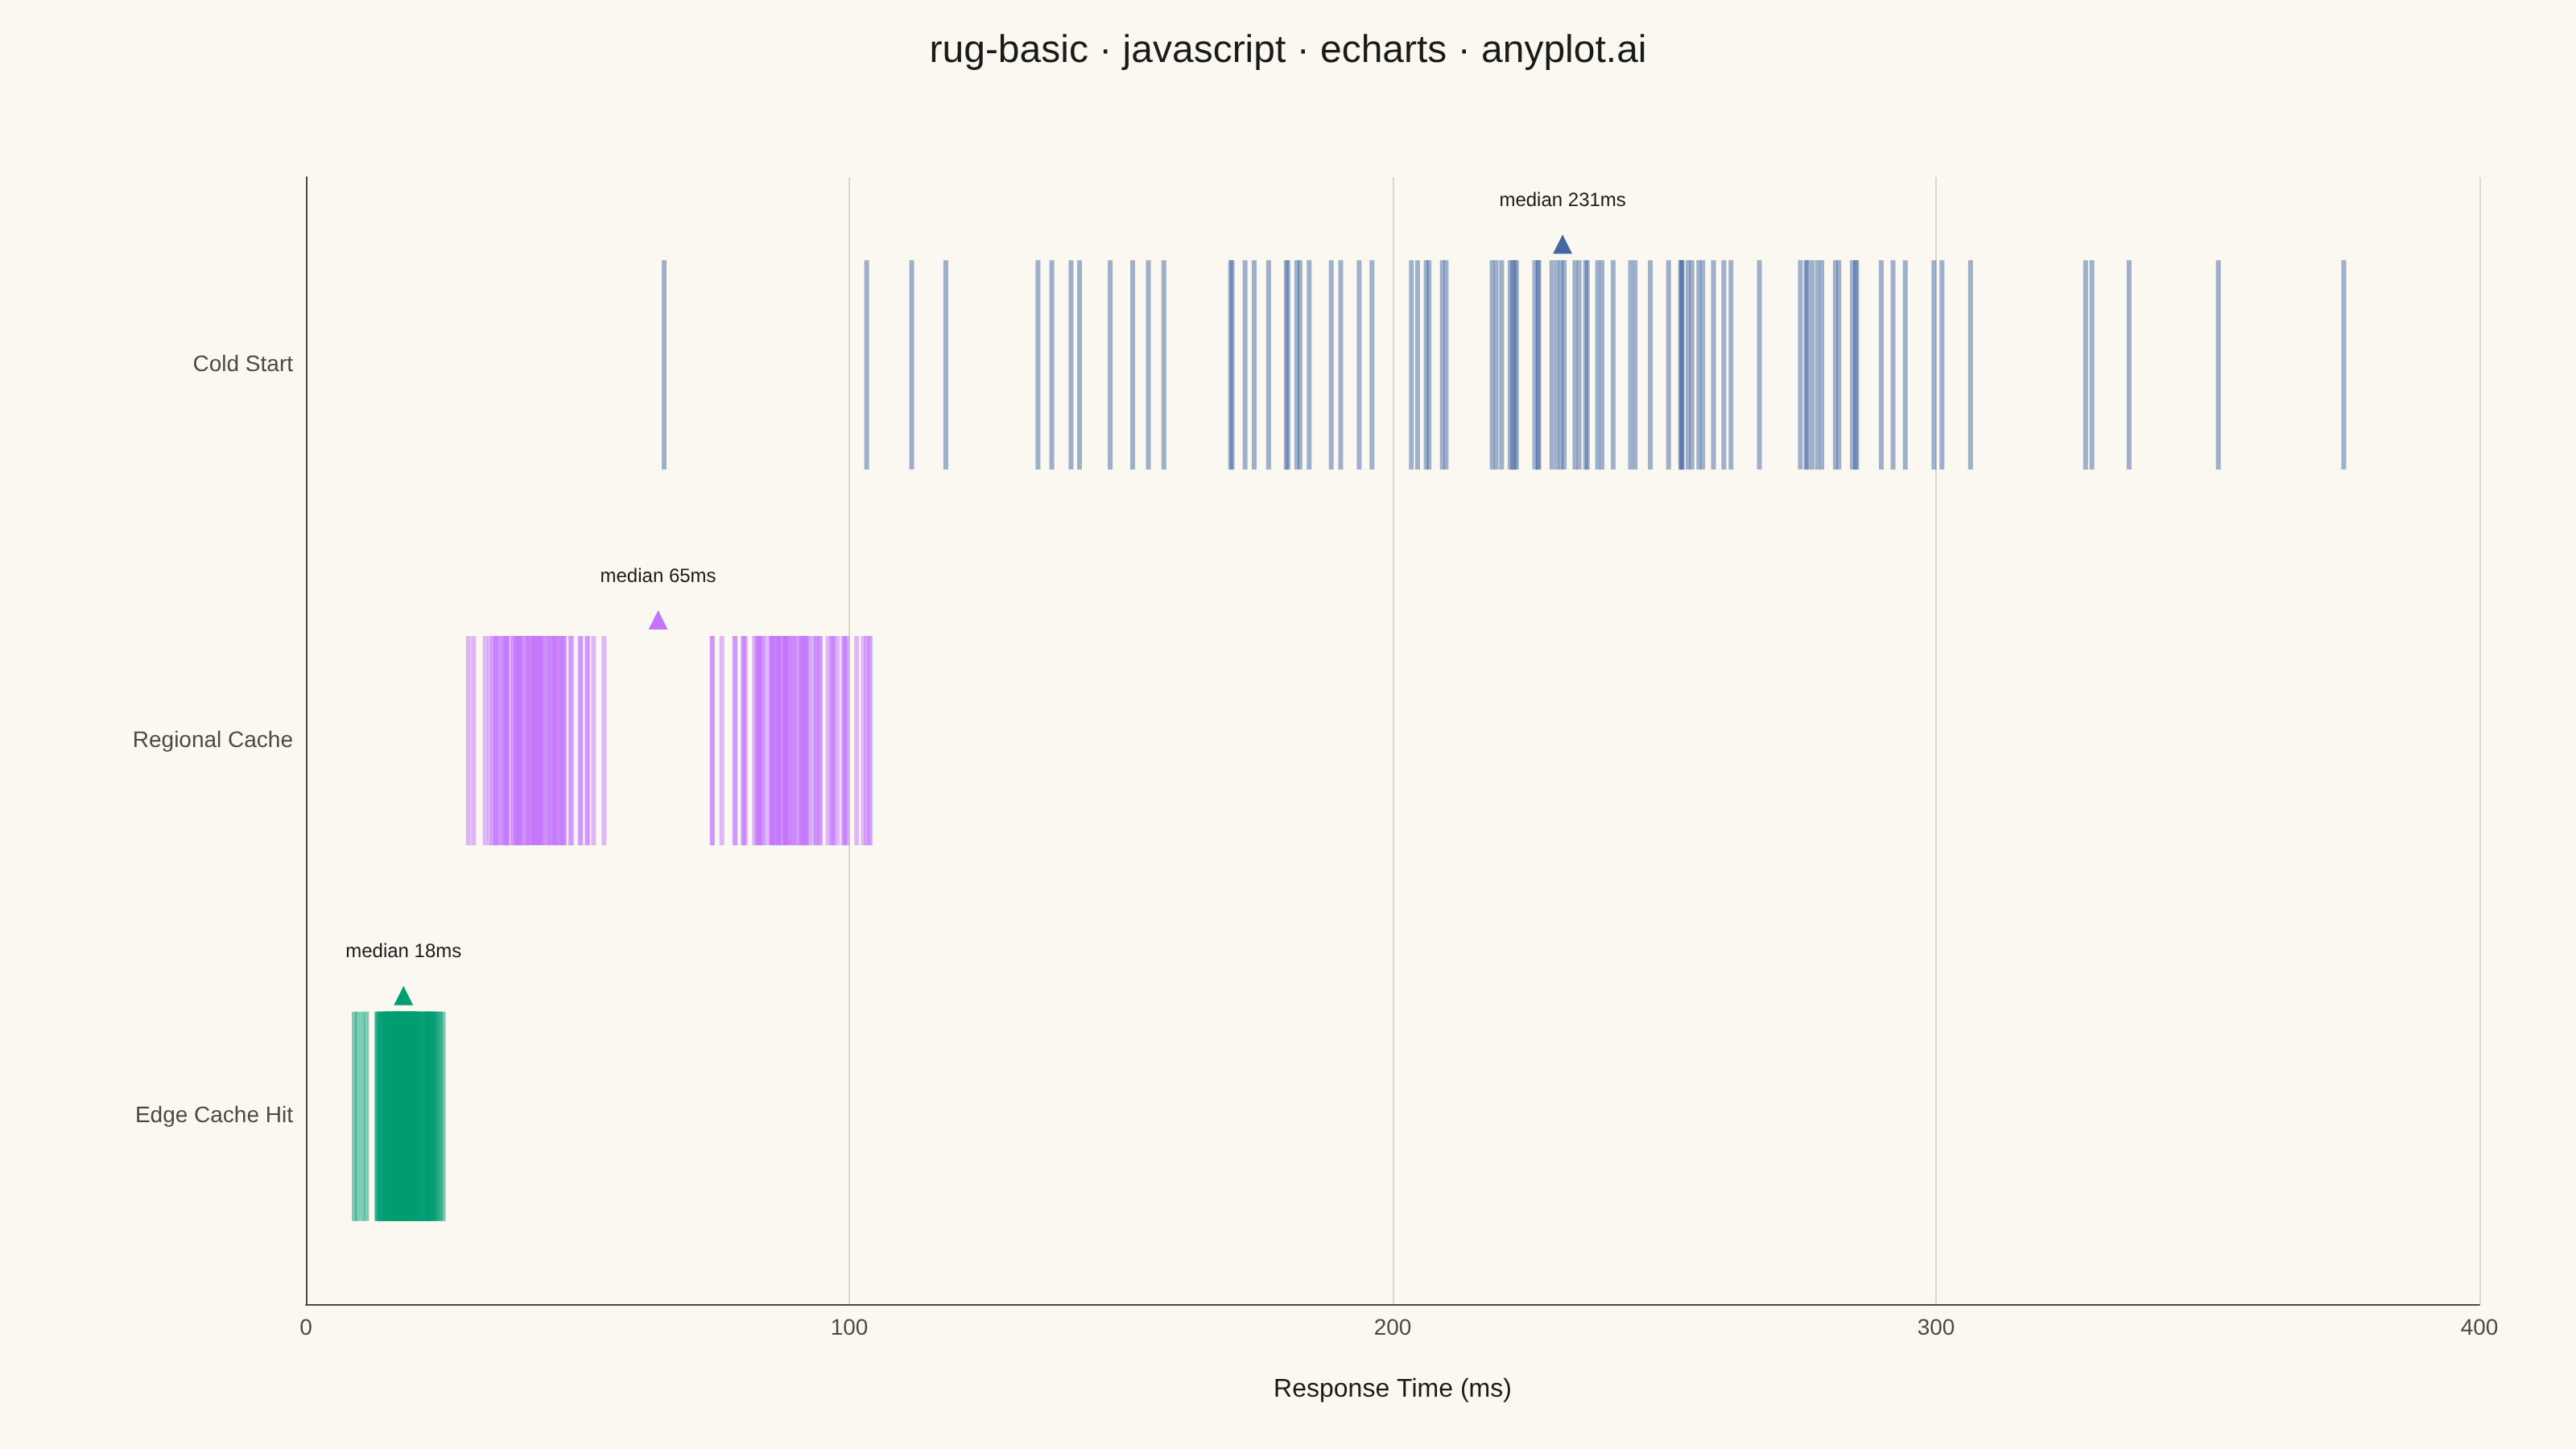
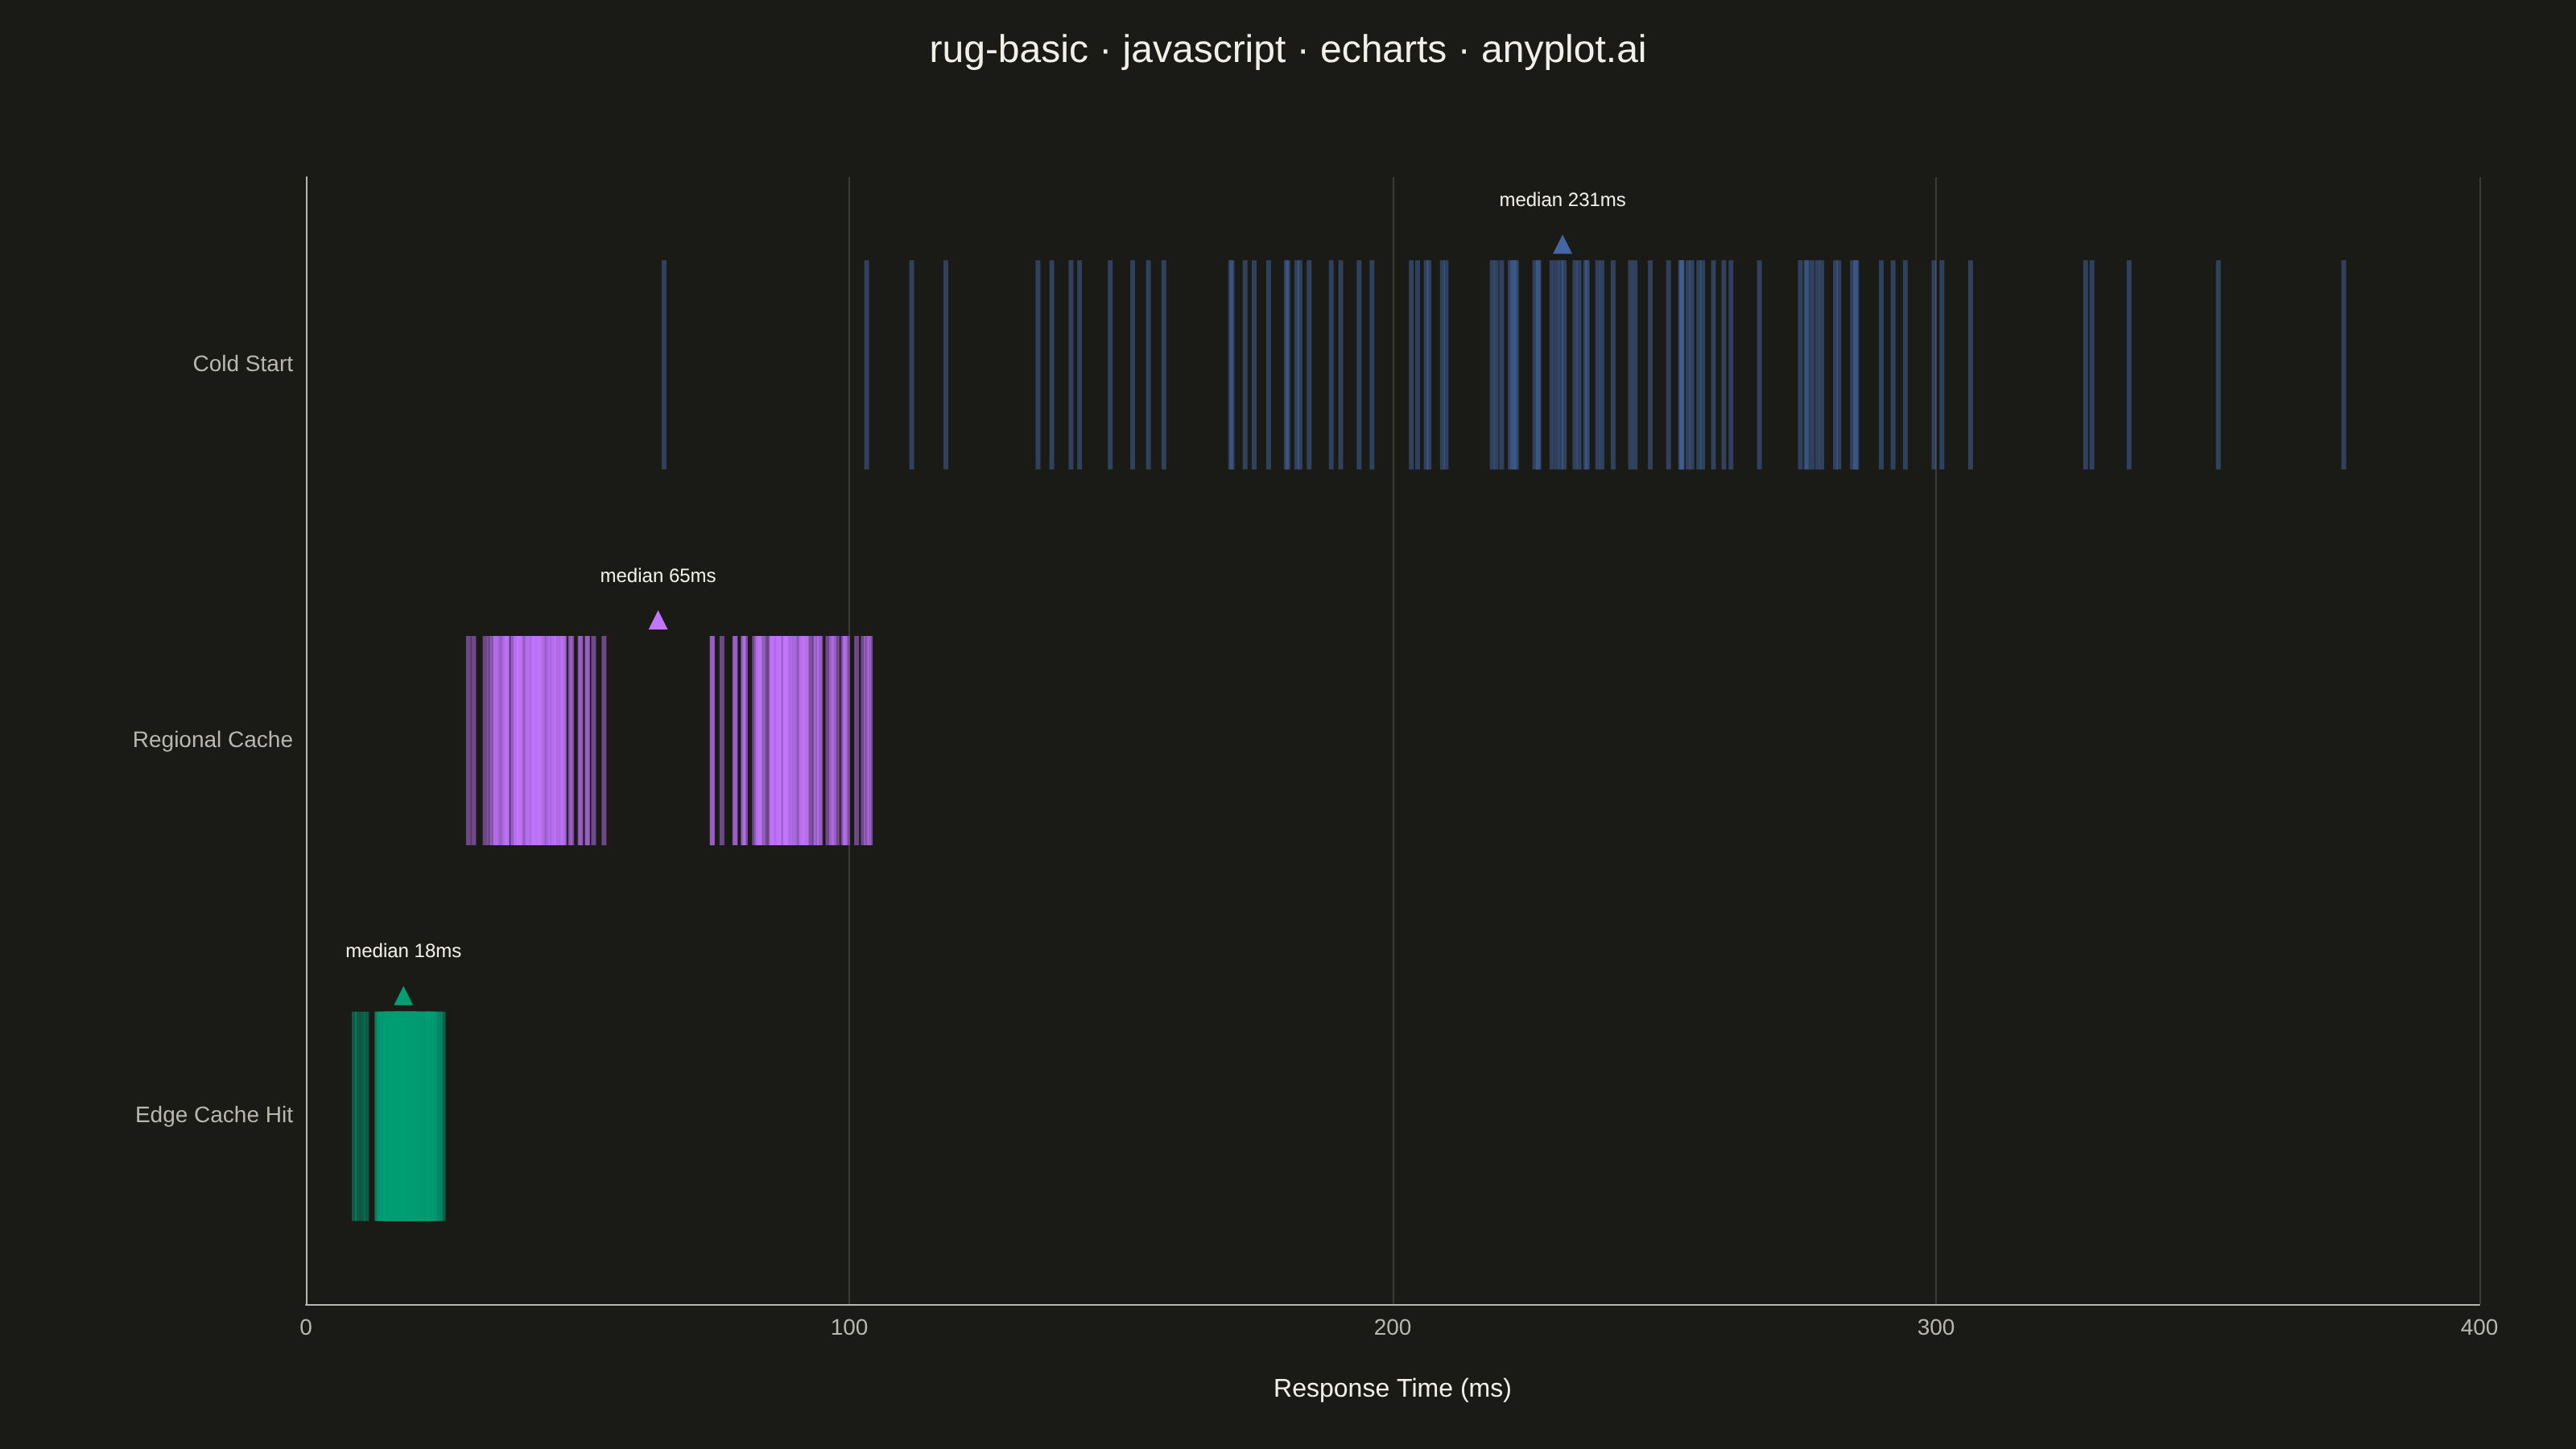
The same plot in 14 other libraries — JavaScript: Chart.js, D3.js, Highcharts, MUI X Charts; Python: Altair, Bokeh, lets-plot, Matplotlib, Plotly, plotnine, Pygal, Seaborn; R: ggplot2; Julia: Makie.jl. Compare all 15 side by side: Basic Rug Plot in Python, R, Julia and JavaScript.
A rug plot displays individual data points as small tick marks along an axis, typically at the bottom or side of another plot. Unlike histograms or density plots that bin data, rug plots show the exact location of every observation. They reveal clustering patterns, gaps in data, and the precise distribution of values with minimal visual footprint.
// anyplot.ai
// rug-basic: Basic Rug Plot
// Library: echarts 6.1.0 | JavaScript 22.23.1
// Quality: 92/100 | Created: 2026-07-25

//# anyplot-orientation: landscape
const t = window.ANYPLOT_TOKENS;

// --- Data (in-memory, deterministic fixed-seed LCG) --------------------------
let seed = 42;
function lcg() {
  seed = (seed * 1103515245 + 12345) & 0x7fffffff;
  return seed / 0x7fffffff;
}
function randNormal(mean, std) {
  const u1 = lcg() || 1e-9;
  const u2 = lcg();
  const z = Math.sqrt(-2 * Math.log(u1)) * Math.cos(2 * Math.PI * u2);
  return mean + z * std;
}

const groups = ["Edge Cache Hit", "Regional Cache", "Cold Start"];

const edgeCacheLatency = Array.from({ length: 140 }, () => randNormal(18, 3));
const regionalCacheLatency = Array.from({ length: 70 }, () =>
  randNormal(42, 6),
).concat(Array.from({ length: 70 }, () => randNormal(88, 8)));
const coldStartLatency = Array.from({ length: 90 }, () => randNormal(230, 55));

const seriesData = [edgeCacheLatency, regionalCacheLatency, coldStartLatency];

// --- Init ---------------------------------------------------------------------
const chart = echarts.init(document.getElementById("container"));

// --- Option ---------------------------------------------------------------------
chart.setOption({
  animation: false,
  backgroundColor: "transparent",
  title: {
    text: "rug-basic · javascript · echarts · anyplot.ai",
    left: "center",
    textStyle: { color: t.ink, fontSize: 24, fontWeight: 500 },
  },
  grid: { left: 190, right: 60, top: 110, bottom: 90 },
  xAxis: {
    type: "value",
    name: "Response Time (ms)",
    nameLocation: "middle",
    nameGap: 45,
    nameTextStyle: { color: t.ink, fontSize: 16 },
    min: 0,
    axisLabel: { color: t.inkSoft, fontSize: 14 },
    axisLine: { show: true, onZero: false, lineStyle: { color: t.inkSoft } },
    axisTick: { show: false },
    splitLine: { lineStyle: { color: t.grid } },
  },
  yAxis: {
    type: "category",
    data: groups,
    axisLabel: { color: t.inkSoft, fontSize: 14 },
    axisLine: { show: true, lineStyle: { color: t.inkSoft } },
    axisTick: { show: false },
    splitLine: { show: false },
  },
  series: groups.map((name, i) => {
    const sorted = [...seriesData[i]].sort((a, b) => a - b);
    const mid = Math.floor(sorted.length / 2);
    const median =
      sorted.length % 2 ? sorted[mid] : (sorted[mid - 1] + sorted[mid]) / 2;
    return {
      name,
      type: "scatter",
      data: seriesData[i].map((v) => [v, i]),
      symbol: "rect",
      symbolSize: [3, 130],
      itemStyle: { color: t.palette[i], opacity: 0.5 },
      markPoint: {
        silent: true,
        symbol: "triangle",
        symbolSize: 12,
        symbolOffset: [0, -75],
        itemStyle: { color: t.palette[i] },
        label: {
          show: true,
          formatter: `median ${median.toFixed(0)}ms`,
          color: t.ink,
          fontSize: 12,
          position: "top",
          offset: [0, -10],
        },
        data: [{ coord: [median, i] }],
      },
    };
  }),
});
Runnable source as JSON, for any HTTP client: https://api.anyplot.ai/specs/rug-basic/echarts/code. Any spec id and library id listed in llms-full.txt fit the same URL shape; every URL below is complete and callable.
{
  "spec_id": "rug-basic",
  "language": "javascript",
  "library": "echarts",
  "page": "https://anyplot.ai/rug-basic/javascript/echarts",
  "hub": "https://anyplot.ai/rug-basic",
  "code_json": "https://api.anyplot.ai/specs/rug-basic/echarts/code",
  "spec_json": "https://api.anyplot.ai/specs/rug-basic",
  "render_light_png": "https://storage.googleapis.com/anyplot-images/plots/rug-basic/javascript/echarts/plot-light.png",
  "render_dark_png": "https://storage.googleapis.com/anyplot-images/plots/rug-basic/javascript/echarts/plot-dark.png",
  "interactive_light_html": "https://storage.googleapis.com/anyplot-images/plots/rug-basic/javascript/echarts/plot-light.html",
  "interactive_dark_html": "https://storage.googleapis.com/anyplot-images/plots/rug-basic/javascript/echarts/plot-dark.html",
  "quality_score": 92.0,
  "license": "MIT",
  "guide": "https://anyplot.ai/llms.txt"
}
Part of Basic Rug Plot on anyplot.ai.