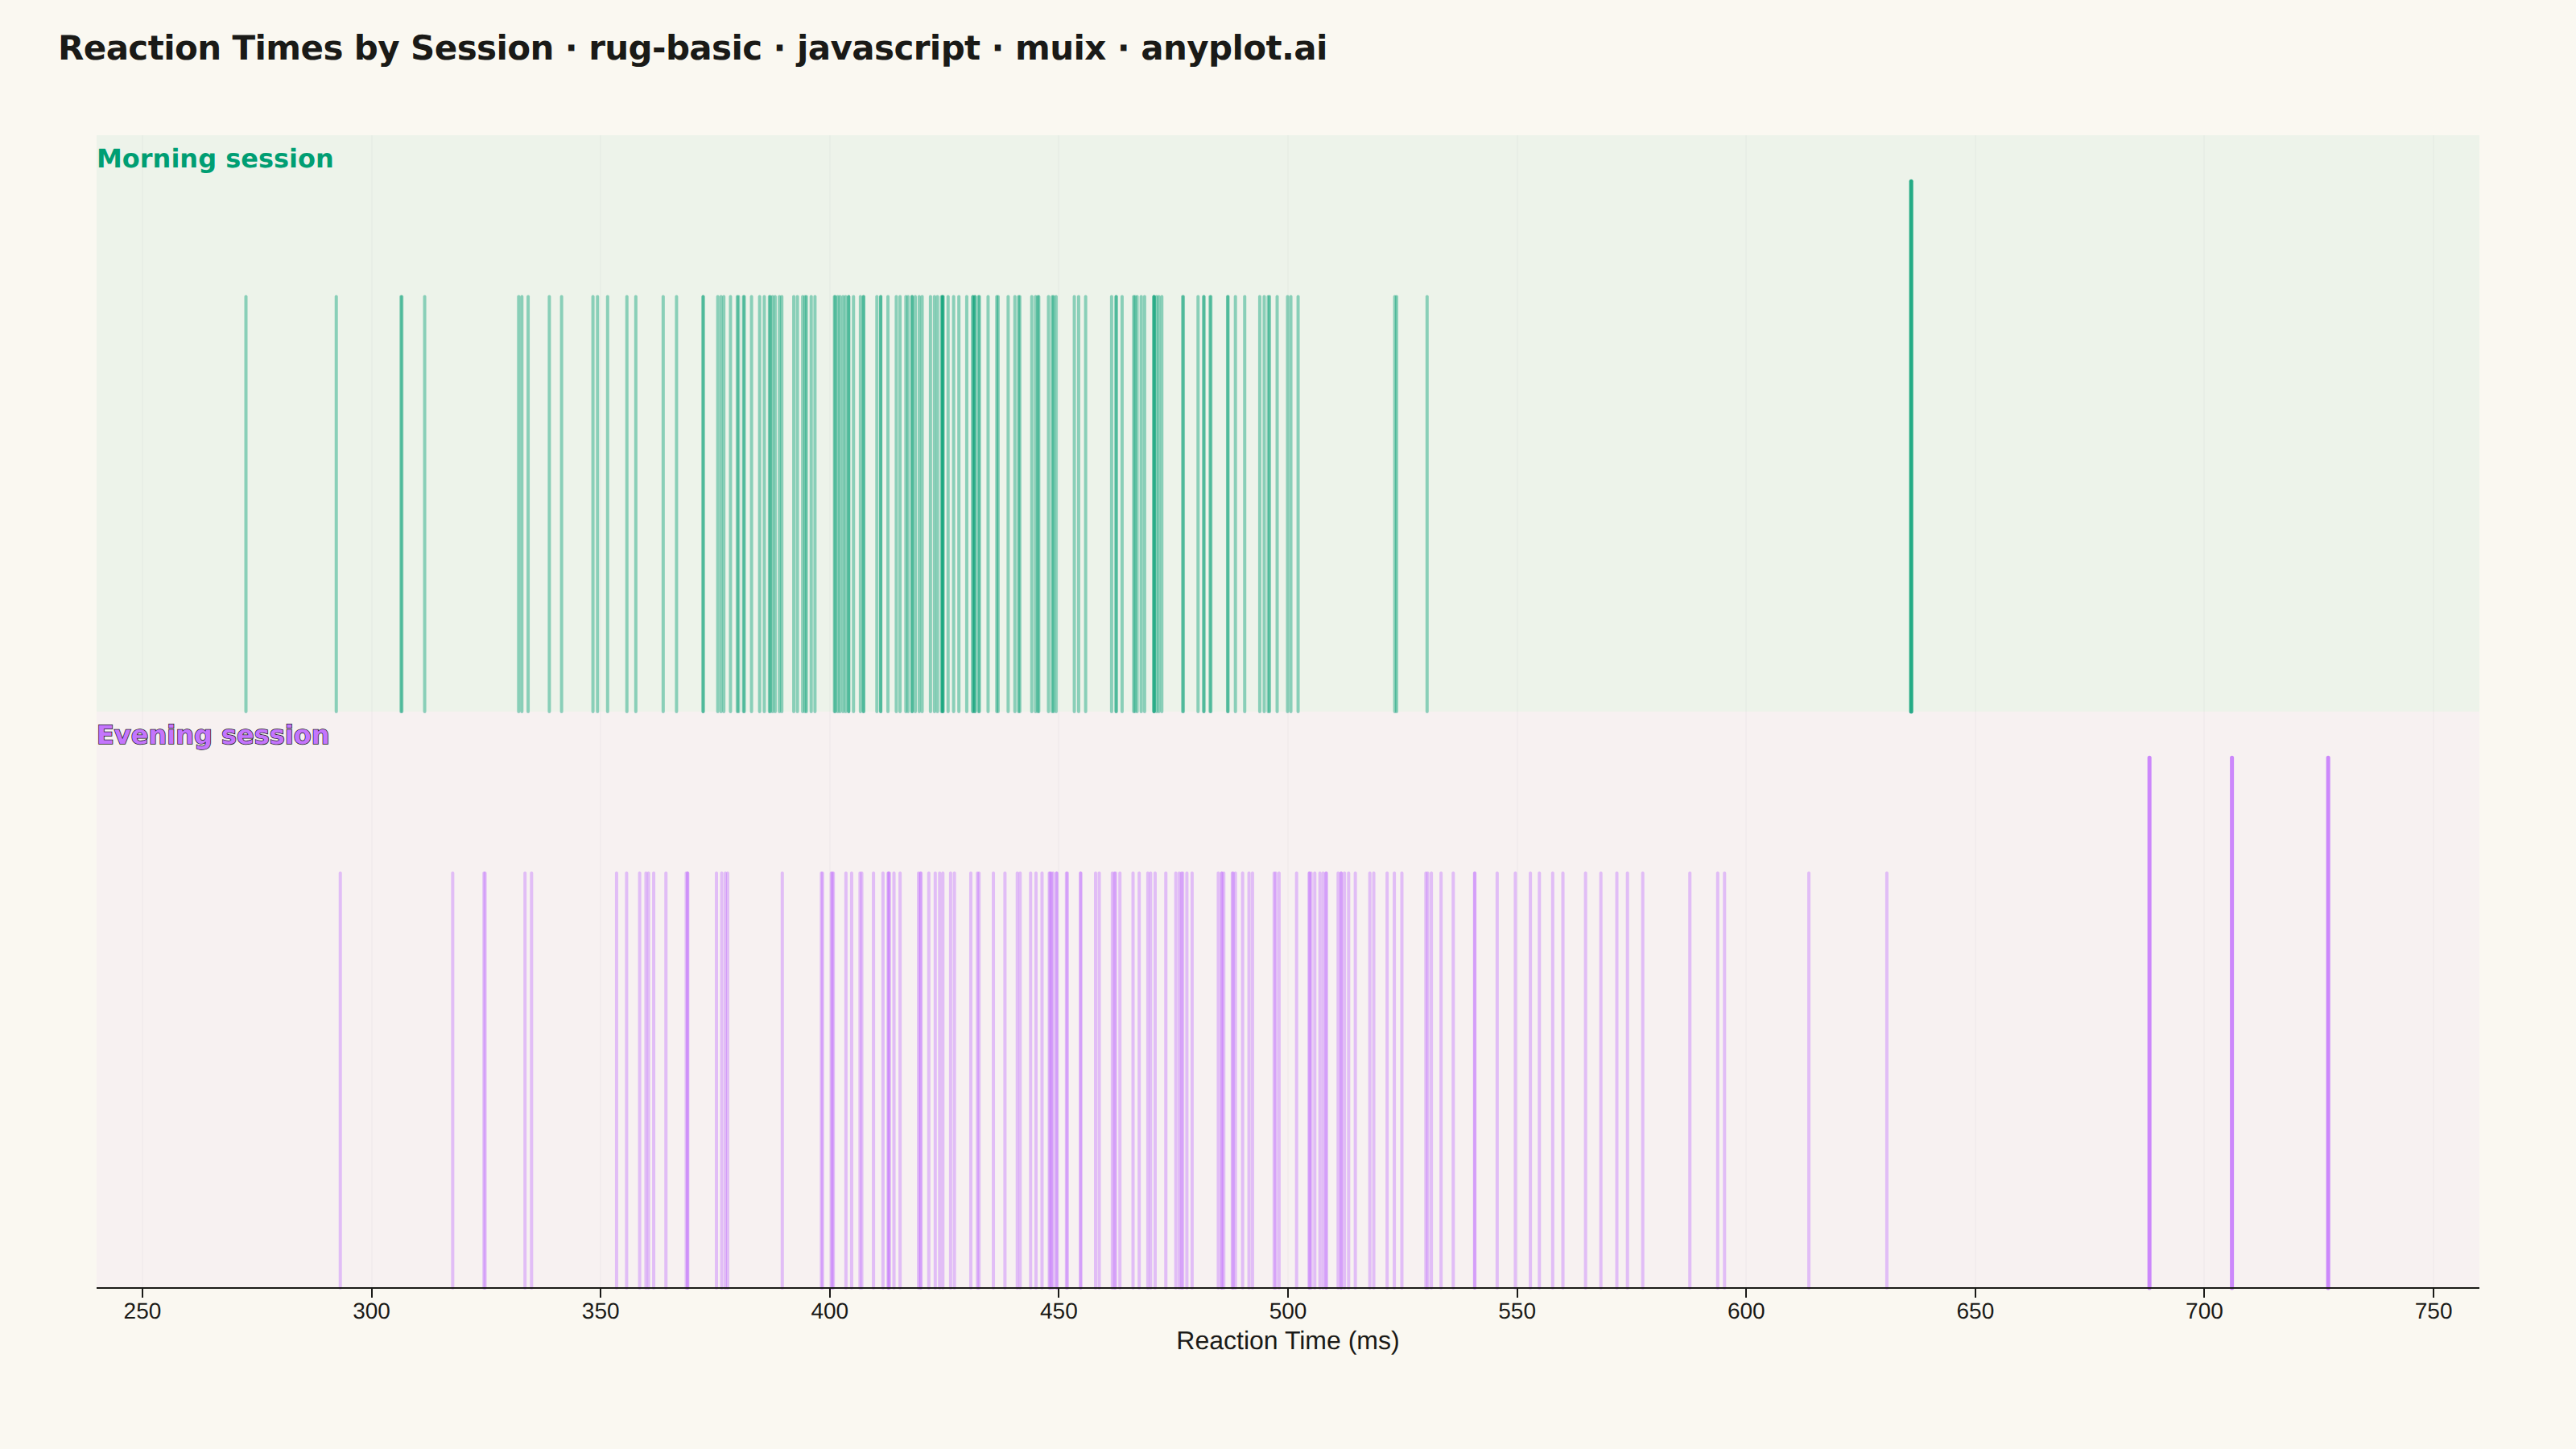
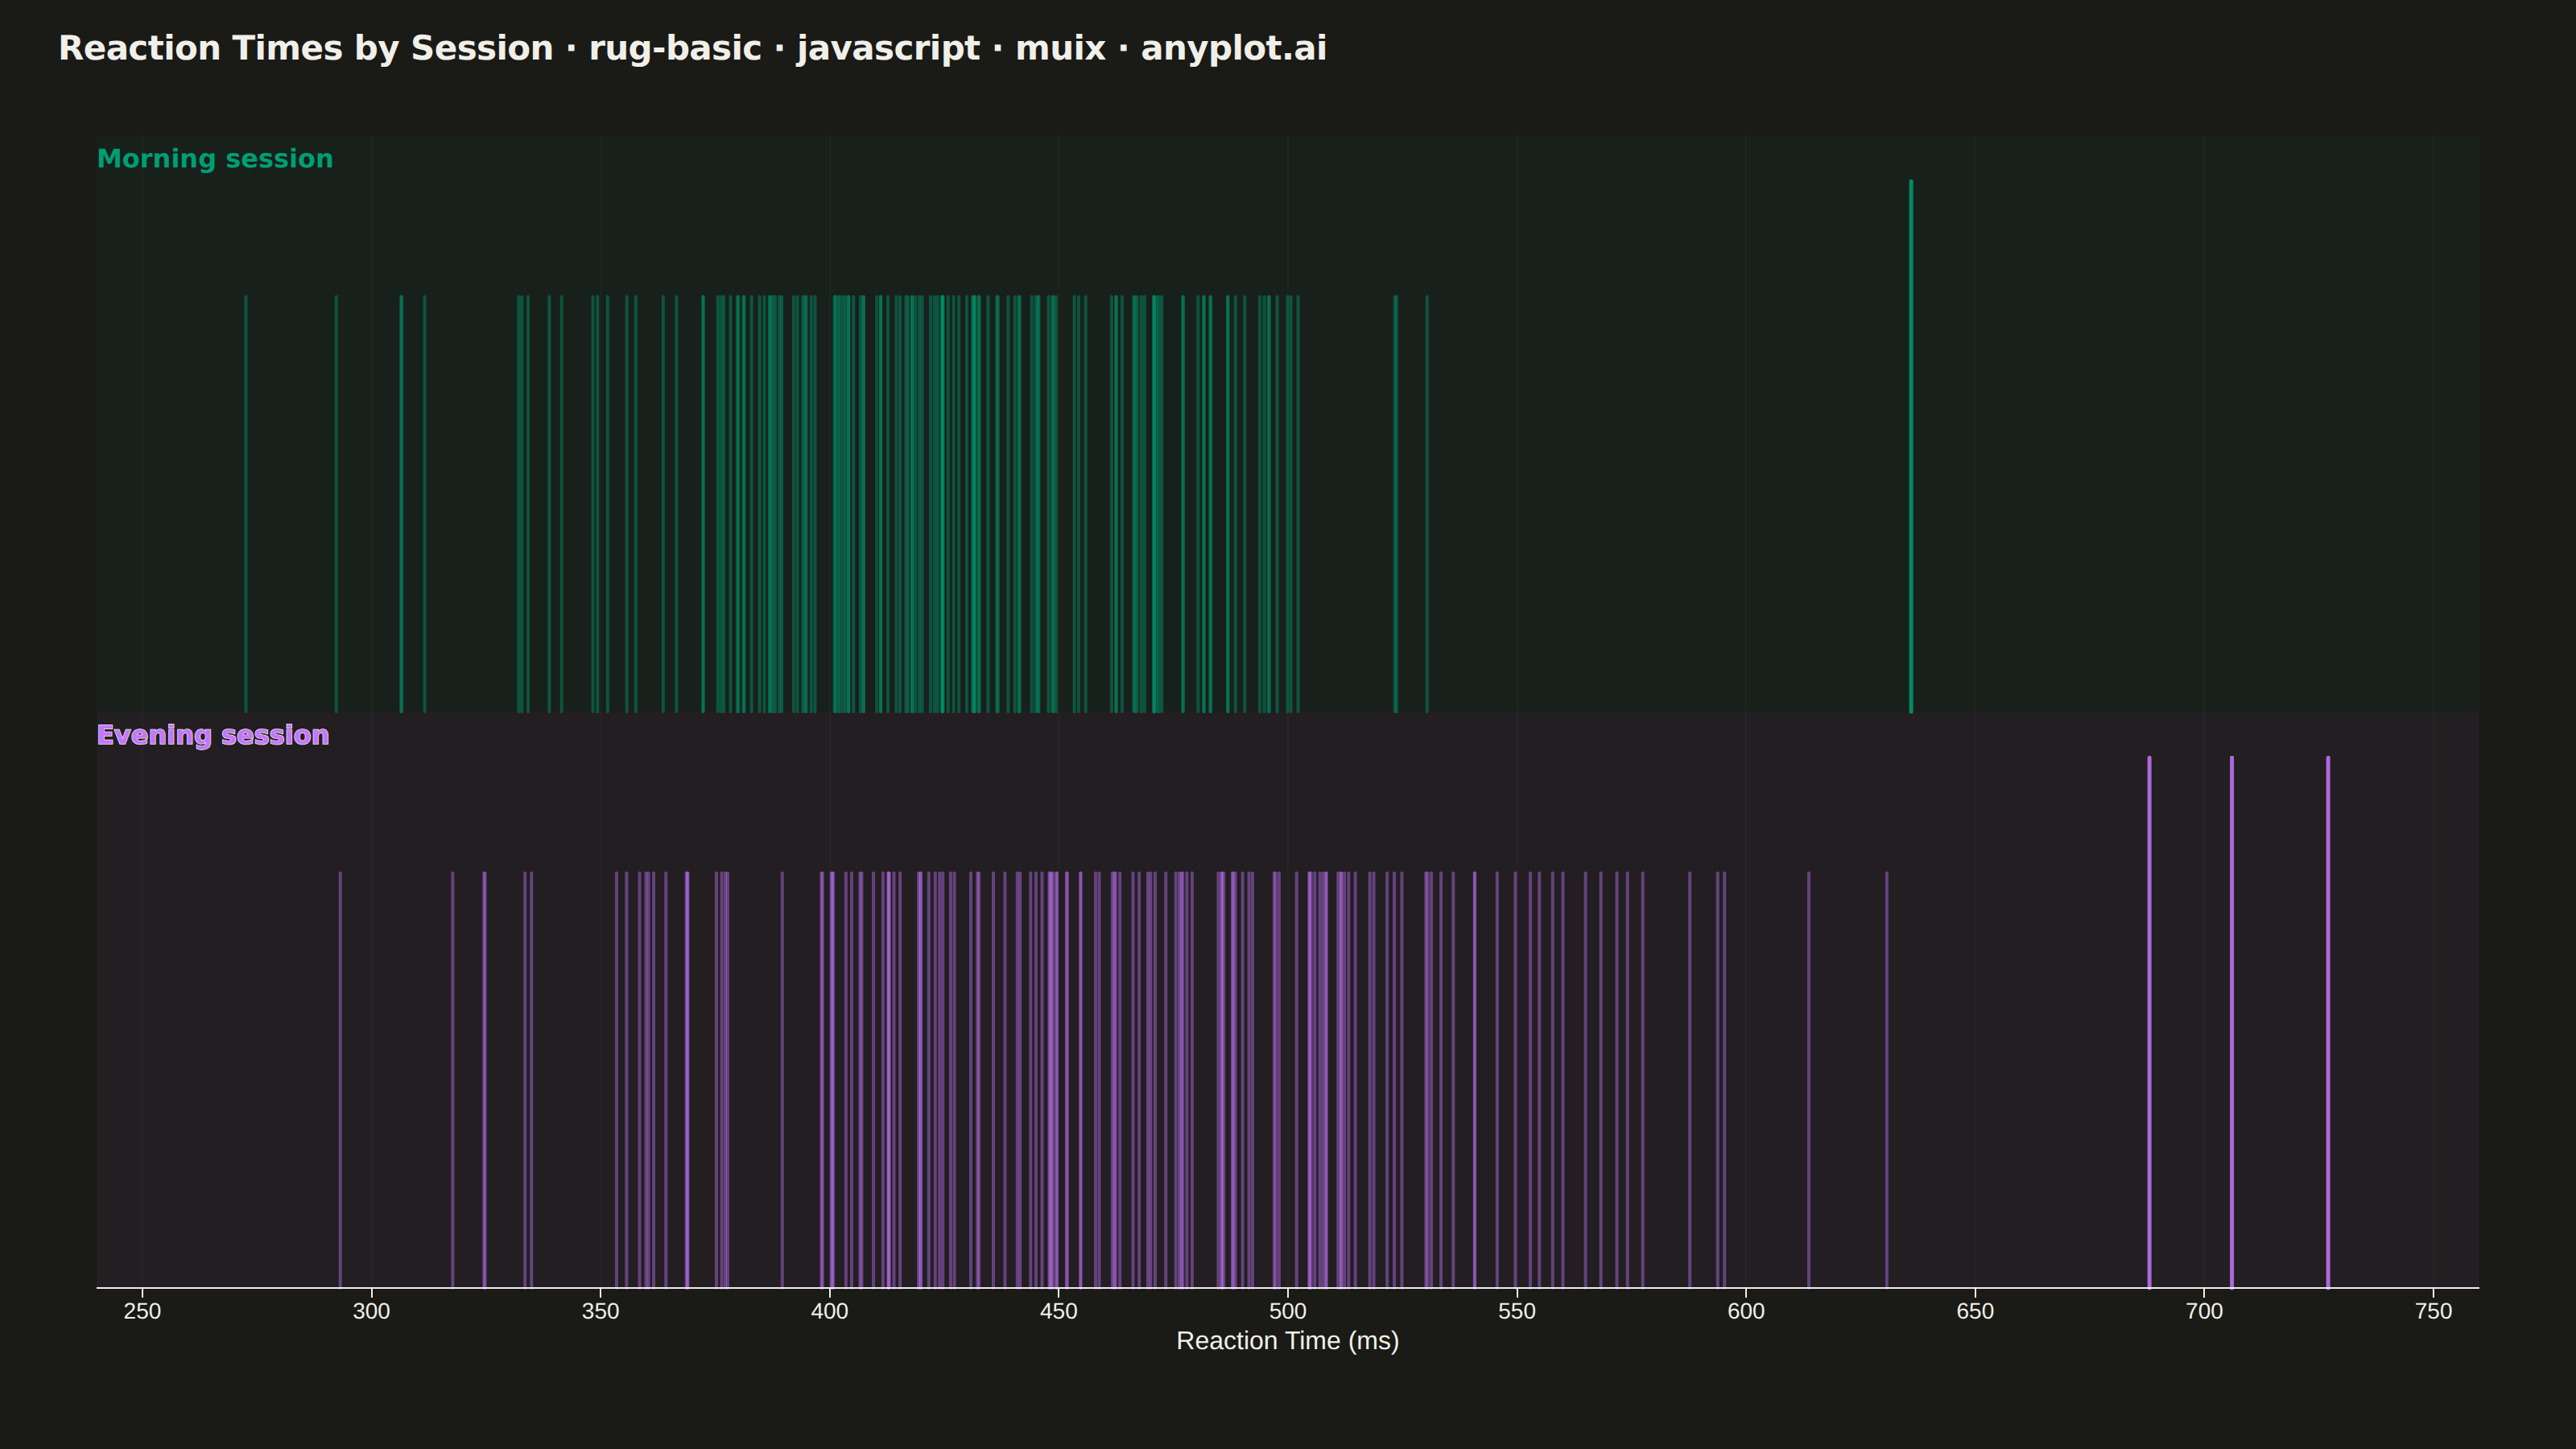
The same plot in 14 other libraries — JavaScript: Chart.js, D3.js, Apache ECharts, Highcharts; Python: Altair, Bokeh, lets-plot, Matplotlib, Plotly, plotnine, Pygal, Seaborn; R: ggplot2; Julia: Makie.jl. Compare all 15 side by side: Basic Rug Plot in Python, R, Julia and JavaScript.
A rug plot displays individual data points as small tick marks along an axis, typically at the bottom or side of another plot. Unlike histograms or density plots that bin data, rug plots show the exact location of every observation. They reveal clustering patterns, gaps in data, and the precise distribution of values with minimal visual footprint.
// anyplot.ai
// rug-basic: Basic Rug Plot
// Library: muix 7.29.1 | JavaScript 22.23.1
// Quality: 91/100 | Created: 2026-07-25

import { ChartContainer } from "@mui/x-charts/ChartContainer";
import { ChartsXAxis } from "@mui/x-charts/ChartsXAxis";
import { ChartsGrid } from "@mui/x-charts/ChartsGrid";
import { useXScale, useDrawingArea } from "@mui/x-charts/hooks";

const t = window.ANYPLOT_TOKENS;
const FONT = "Inter, system-ui, -apple-system, sans-serif";

// Seeded LCG for deterministic data generation (no seeded RNG in browser)
let seed = 42;
function rand() {
  seed = (Math.imul(1664525, seed) + 1013904223) | 0;
  return (seed >>> 0) / 4294967296;
}
function randn() {
  const u = Math.max(rand(), 1e-10);
  return Math.sqrt(-2 * Math.log(u)) * Math.cos(2 * Math.PI * rand());
}

// Reaction times (ms) in a visual cognitive task, two testing sessions.
// Each observation tracks whether it is a slow-trial "attention lapse" so the
// tail can be emphasized visually rather than only in a code comment.
const morning = Array.from({ length: 140 }, () => ({ v: 420 + 55 * randn(), outlier: false }));
const evening = Array.from({ length: 140 }, () => ({ v: 458 + 70 * randn(), outlier: false }));
morning.push({ v: 636, outlier: true });
evening.push({ v: 688, outlier: true }, { v: 706, outlier: true }, { v: 727, outlier: true });

const LANES = [
  { label: "Morning session", values: morning, color: t.palette[0], strokeLabel: false },
  { label: "Evening session", values: evening, color: t.palette[1], strokeLabel: true },
];

const allValues = LANES.flatMap((lane) => lane.values.map((d) => d.v));
const X_MIN = Math.floor(Math.min(...allValues) / 20) * 20 - 20;
const X_MAX = Math.ceil(Math.max(...allValues) / 20) * 20 + 20;

const TITLE_H = 60;
const NORMAL_TICK_FRAC = 0.72; // fraction of the lane band used by regular ticks
const OUTLIER_TICK_FRAC = 0.92; // outlier ticks read taller, at a glance

// One rug lane: a subtle tinted background band plus one semi-transparent
// tick per observation. Overlapping trials (frequent near the distribution
// centre) darken naturally. Outlier "attention lapse" trials are drawn
// taller and more opaque so the tail reads at a glance, not just on close
// reading.
function RugLane({ values, color, top, laneHeight }) {
  const xs = useXScale();
  const { left, width } = useDrawingArea();
  if (!xs) return null;
  const baselineY = top + laneHeight;
  const normalHeight = laneHeight * NORMAL_TICK_FRAC;
  const outlierHeight = laneHeight * OUTLIER_TICK_FRAC;
  return (
    <g>
      <rect x={left} y={top} width={width} height={laneHeight} fill={color} opacity={0.05} />
      {values.map((d, i) => (
        <line
          key={i}
          x1={xs(d.v)}
          x2={xs(d.v)}
          y1={baselineY}
          y2={baselineY - (d.outlier ? outlierHeight : normalHeight)}
          stroke={color}
          strokeWidth={d.outlier ? 2.5 : 2}
          strokeOpacity={d.outlier ? 0.85 : 0.42}
          strokeLinecap="round"
        />
      ))}
    </g>
  );
}

function LaneLabel({ text, top, color, strokeLabel }) {
  const { left } = useDrawingArea();
  return (
    <text
      x={left}
      y={top + 20}
      fontSize={16}
      fontFamily={FONT}
      fontWeight={600}
      fill={color}
      stroke={strokeLabel ? t.ink : "none"}
      strokeWidth={strokeLabel ? 0.75 : 0}
      paintOrder="stroke"
    >
      {text}
    </text>
  );
}

// Two rug lanes sharing one x-axis, evenly split within the drawing area.
// Each lane gets its own faint tinted band instead of a dividing rule, so
// the split reads without adding an extra line of visual clutter.
function RugPlot() {
  const { top, height } = useDrawingArea();
  const laneHeight = height / 2;
  const laneTops = [top, top + laneHeight];
  return (
    <g>
      {LANES.map((lane, i) => (
        <RugLane key={lane.label} values={lane.values} color={lane.color} top={laneTops[i]} laneHeight={laneHeight} />
      ))}
      {LANES.map((lane, i) => (
        <LaneLabel
          key={lane.label}
          text={lane.label}
          top={laneTops[i]}
          color={lane.color}
          strokeLabel={lane.strokeLabel}
        />
      ))}
    </g>
  );
}

export default function Chart() {
  const W = window.ANYPLOT_SIZE.width;
  const H = window.ANYPLOT_SIZE.height;

  return (
    <div
      style={{
        width: W,
        height: H,
        display: "flex",
        flexDirection: "column",
        backgroundColor: t.pageBg,
        fontFamily: FONT,
      }}
    >
      <div
        style={{
          padding: "18px 36px 0",
          fontSize: 21,
          fontWeight: 600,
          color: t.ink,
          height: TITLE_H,
          boxSizing: "border-box",
          letterSpacing: "-0.3px",
        }}
      >
        Reaction Times by Session · rug-basic · javascript · muix · anyplot.ai
      </div>
      <ChartContainer
        width={W}
        height={H - TITLE_H}
        skipAnimation
        series={[]}
        margin={{ top: 24, right: 60, bottom: 100, left: 60 }}
        xAxis={[
          {
            min: X_MIN,
            max: X_MAX,
            scaleType: "linear",
            label: "Reaction Time (ms)",
            tickMinStep: 40,
            valueFormatter: (v) => String(Math.round(v)),
            tickLabelStyle: { fontSize: 14 },
            labelStyle: { fontSize: 16 },
          },
        ]}
        sx={{
          "& .MuiChartsAxis-line": { stroke: t.inkSoft },
          "& .MuiChartsAxis-tick": { stroke: t.inkSoft },
          "& .MuiChartsGrid-line": { strokeOpacity: 0.15 },
        }}
      >
        <ChartsGrid vertical />
        <RugPlot />
        <ChartsXAxis />
      </ChartContainer>
    </div>
  );
}
Runnable source as JSON, for any HTTP client: https://api.anyplot.ai/specs/rug-basic/muix/code. Any spec id and library id listed in llms-full.txt fit the same URL shape; every URL below is complete and callable.
{
  "spec_id": "rug-basic",
  "language": "javascript",
  "library": "muix",
  "page": "https://anyplot.ai/rug-basic/javascript/muix",
  "hub": "https://anyplot.ai/rug-basic",
  "code_json": "https://api.anyplot.ai/specs/rug-basic/muix/code",
  "spec_json": "https://api.anyplot.ai/specs/rug-basic",
  "render_light_png": "https://storage.googleapis.com/anyplot-images/plots/rug-basic/javascript/muix/plot-light.png",
  "render_dark_png": "https://storage.googleapis.com/anyplot-images/plots/rug-basic/javascript/muix/plot-dark.png",
  "interactive_light_html": "https://storage.googleapis.com/anyplot-images/plots/rug-basic/javascript/muix/plot-light.html",
  "interactive_dark_html": "https://storage.googleapis.com/anyplot-images/plots/rug-basic/javascript/muix/plot-dark.html",
  "quality_score": 91.0,
  "license": "MIT",
  "guide": "https://anyplot.ai/llms.txt"
}
Part of Basic Rug Plot on anyplot.ai.