The same plot in 13 other libraries — JavaScript: Apache ECharts, Highcharts, MUI X Charts; Python: Altair, Bokeh, lets-plot, Matplotlib, Plotly, plotnine, Pygal, Seaborn; R: ggplot2; Julia: Makie.jl. Compare all 14 side by side: Basic Sankey Diagram in Python, R, Julia and JavaScript.
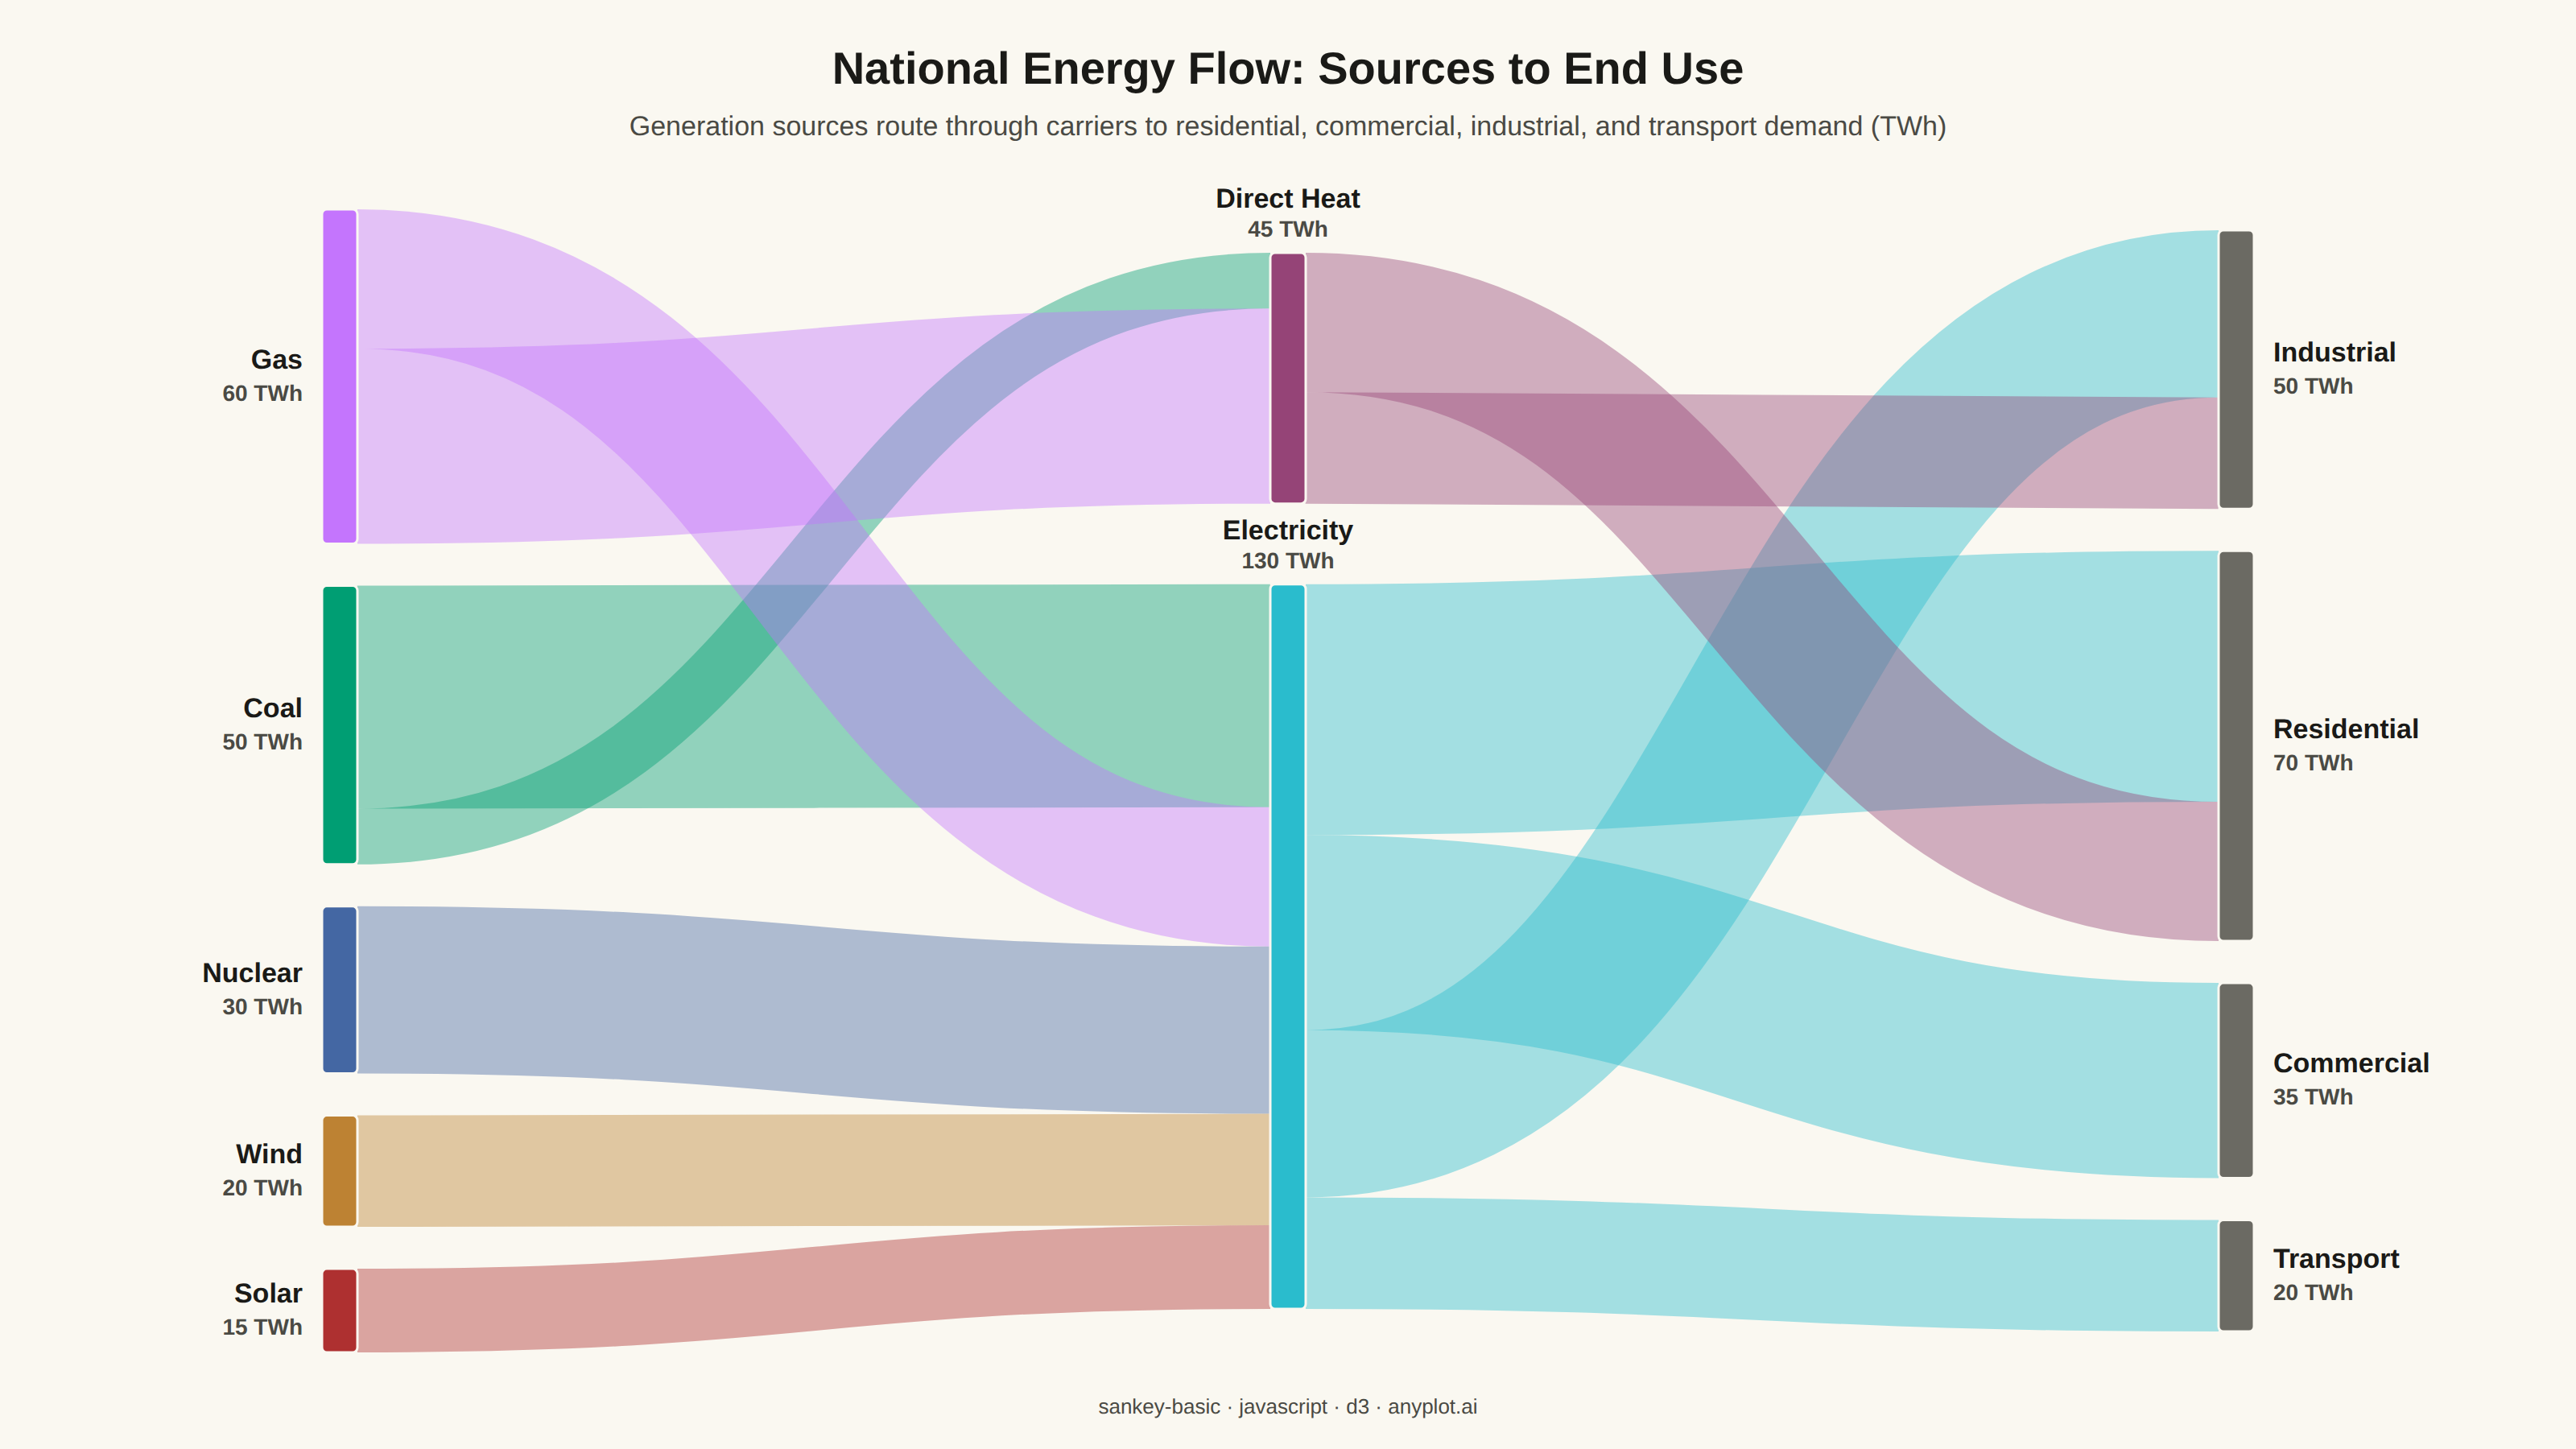
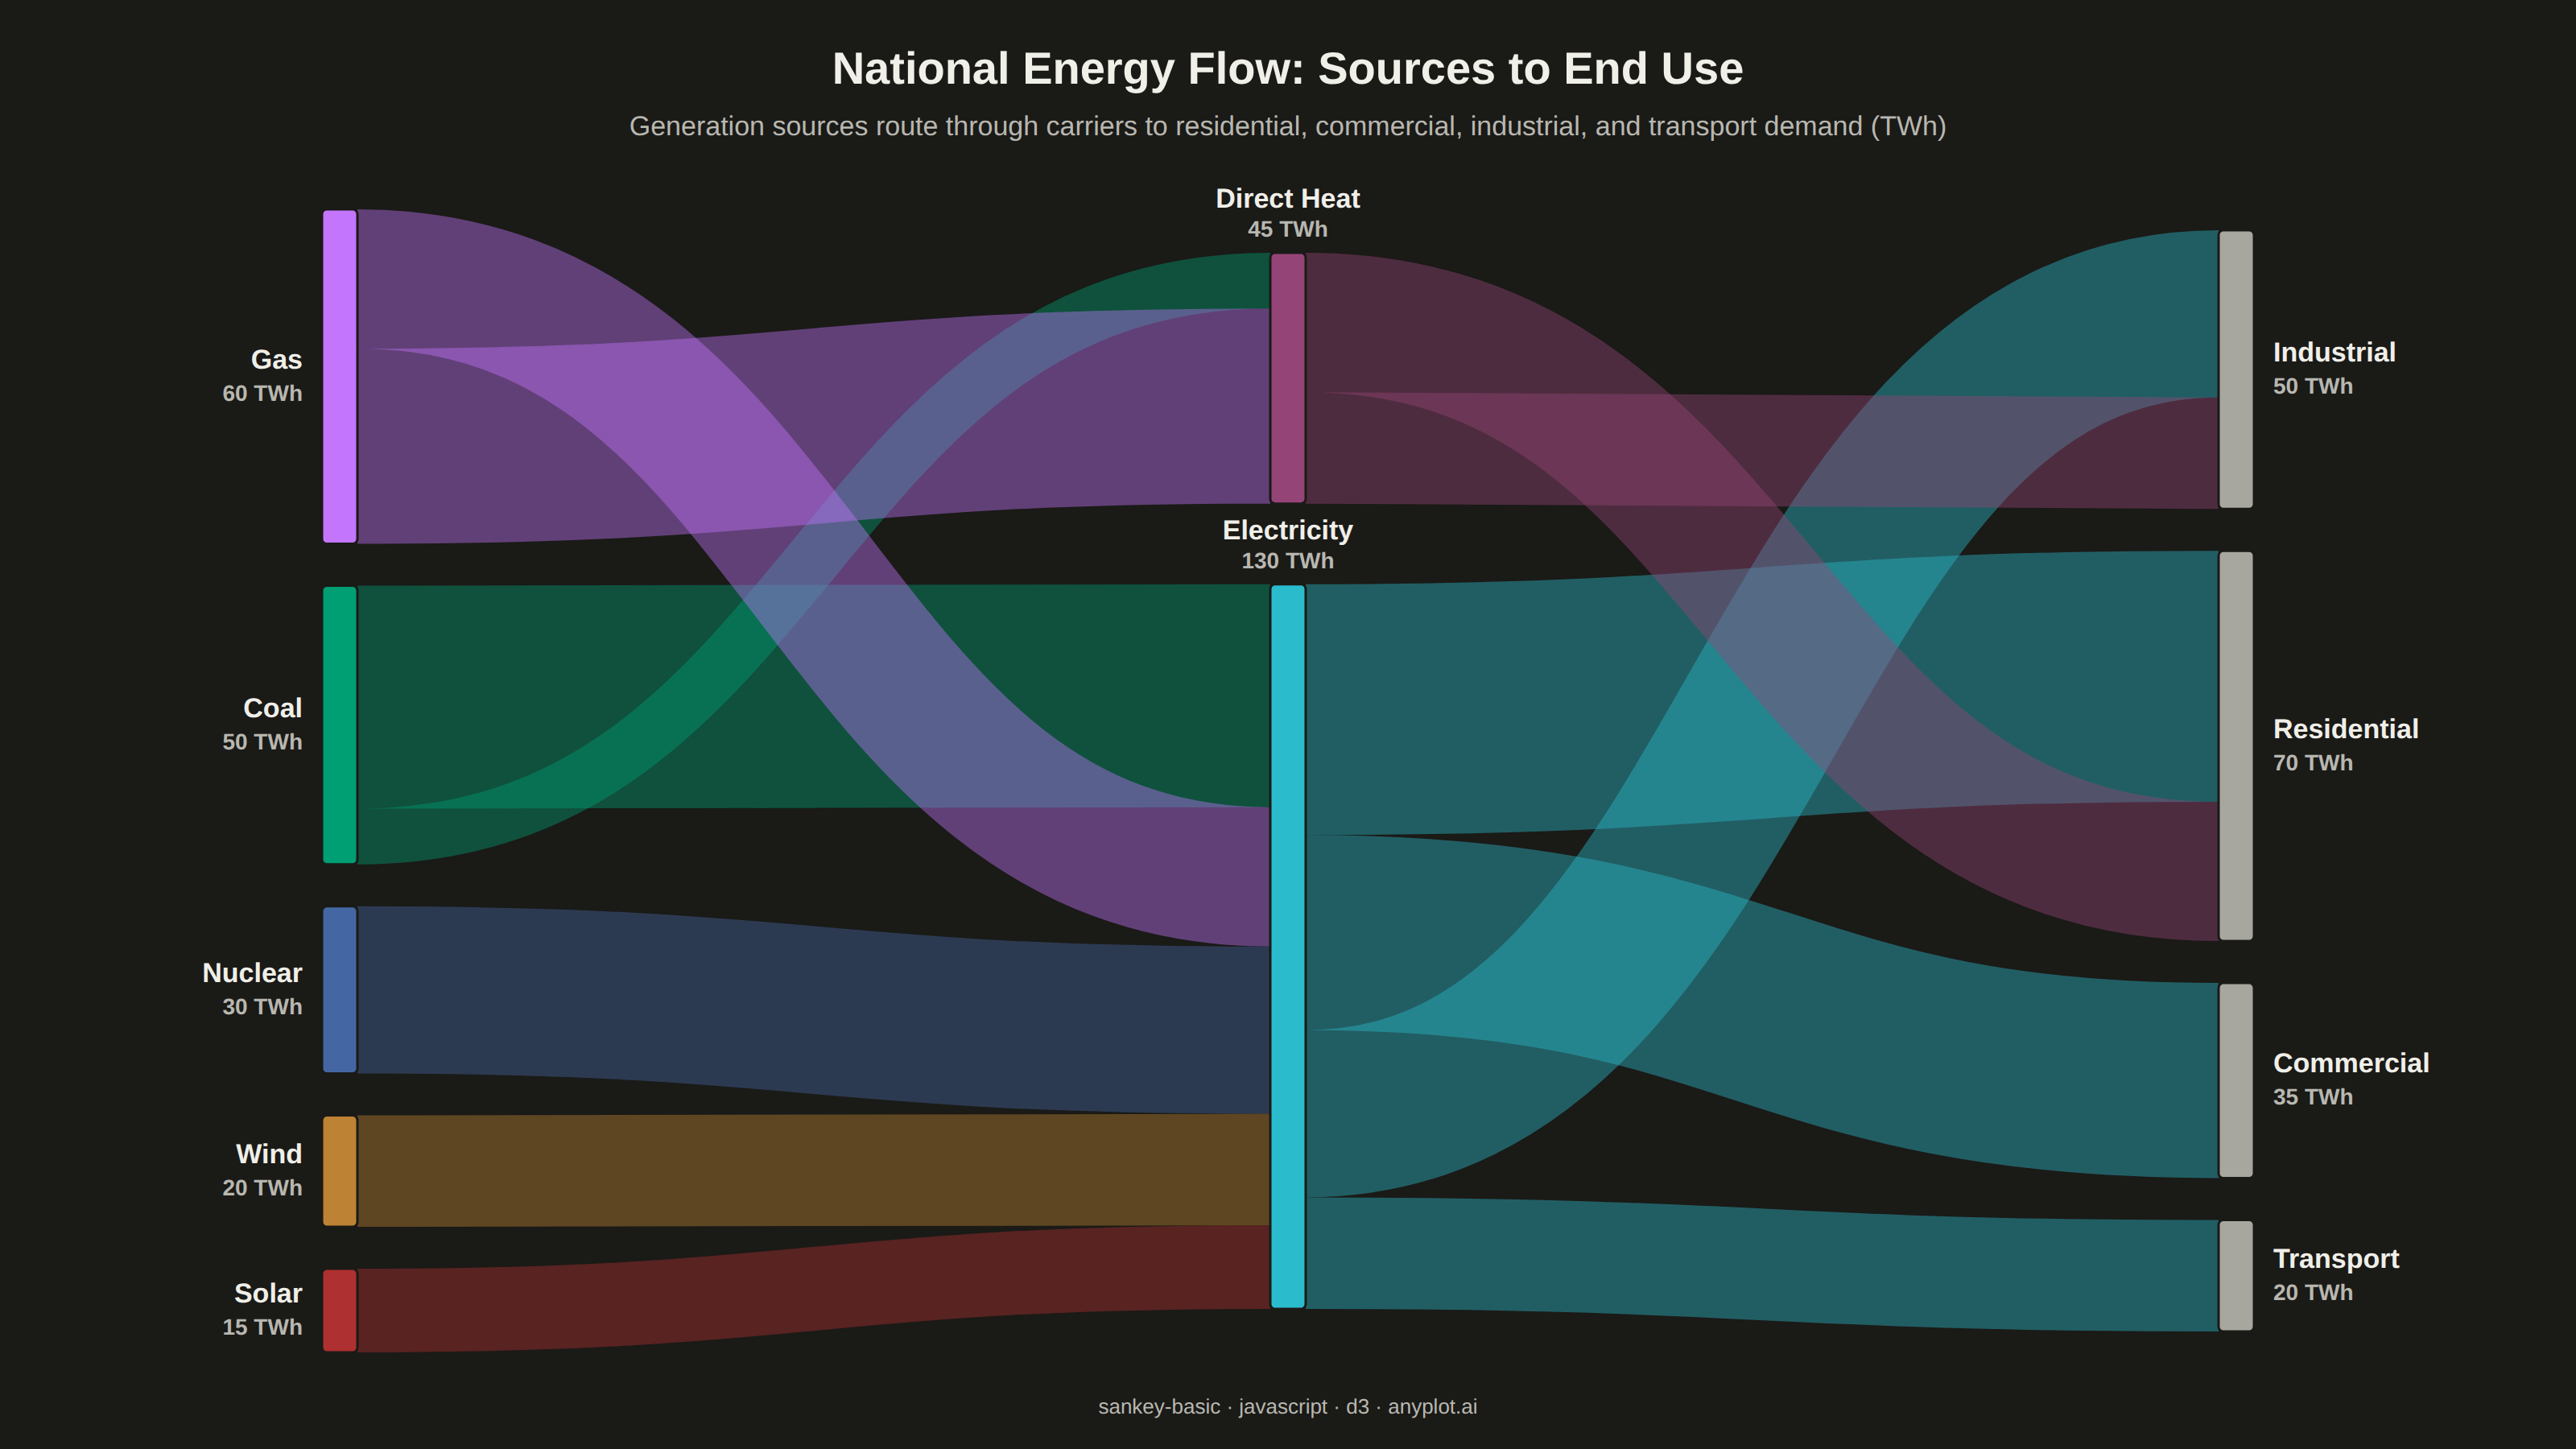
A Sankey diagram visualizes flow or transfer between nodes using links with widths proportional to flow values. It excels at showing how quantities distribute from sources to destinations, revealing patterns in resource allocation, process flows, and system transitions. The diagram makes it easy to identify major pathways and compare relative magnitudes of different flows.
// anyplot.ai
// sankey-basic: Basic Sankey Diagram
// Library: d3 7.9.0 | JavaScript 22.23.1
// Quality: 89/100 | Created: 2026-07-25
//# anyplot-orientation: landscape

// NOTE: the pinned bundle exposes only core d3 (d3-selection, d3-scale,
// d3-shape, d3-array, ...) — the `d3-sankey` layout plugin is not part of it.
// The node/link layout below (columns, value-proportional stacking, link
// centreline routing) is a small hand-rolled Sankey layout using only core d3.

const t = window.ANYPLOT_TOKENS;
const { width, height } = window.ANYPLOT_SIZE;
const margin = { top: 130, right: 200, bottom: 60, left: 200 };
const iw = width - margin.left - margin.right;
const ih = height - margin.top - margin.bottom;

// --- Data: national energy flow, source -> carrier -> end use (TWh) --------
const nodeDefs = [
  { id: "Coal", column: 0 },
  { id: "Gas", column: 0 },
  { id: "Nuclear", column: 0 },
  { id: "Wind", column: 0 },
  { id: "Solar", column: 0 },
  { id: "Electricity", column: 1 },
  { id: "Direct Heat", column: 1 },
  { id: "Residential", column: 2 },
  { id: "Commercial", column: 2 },
  { id: "Industrial", column: 2 },
  { id: "Transport", column: 2 },
];

const linkDefs = [
  { source: "Coal", target: "Electricity", value: 40 },
  { source: "Coal", target: "Direct Heat", value: 10 },
  { source: "Gas", target: "Electricity", value: 25 },
  { source: "Gas", target: "Direct Heat", value: 35 },
  { source: "Nuclear", target: "Electricity", value: 30 },
  { source: "Wind", target: "Electricity", value: 20 },
  { source: "Solar", target: "Electricity", value: 15 },
  { source: "Electricity", target: "Residential", value: 45 },
  { source: "Electricity", target: "Commercial", value: 35 },
  { source: "Electricity", target: "Industrial", value: 30 },
  { source: "Electricity", target: "Transport", value: 20 },
  { source: "Direct Heat", target: "Residential", value: 25 },
  { source: "Direct Heat", target: "Industrial", value: 20 },
];

// --- Build node/link graph ---------------------------------------------------
const numColumns = 1 + d3.max(nodeDefs, (d) => d.column);
const nodeById = new Map(
  nodeDefs.map((d) => [d.id, { ...d, sourceLinks: [], targetLinks: [] }])
);

const links = linkDefs.map((d) => {
  const link = { source: nodeById.get(d.source), target: nodeById.get(d.target), value: d.value };
  link.source.sourceLinks.push(link);
  link.target.targetLinks.push(link);
  return link;
});
const nodes = Array.from(nodeById.values());

for (const n of nodes) {
  const out = d3.sum(n.sourceLinks, (l) => l.value);
  const inn = d3.sum(n.targetLinks, (l) => l.value);
  n.value = Math.max(out, inn);
}

// --- Column x-extents ---------------------------------------------------------
const nodeWidth = 22;
const columnStep = numColumns > 1 ? (iw - nodeWidth) / (numColumns - 1) : 0;
for (const n of nodes) {
  n.x0 = margin.left + n.column * columnStep;
  n.x1 = n.x0 + nodeWidth;
}

// --- Crossing reduction: reorder nodes within each column by the value-
// weighted average rank of the nodes they connect to in the adjacent column
// (barycenter heuristic), sweeping forward then backward until it converges.
// This is a lightweight, d3-sankey-free stand-in for the iterative relaxation
// idiomatic Sankey layouts use, and it only reorders nodes within a column --
// it never touches the `nodes` array that drives palette-index assignment.
const columns = d3.groups(nodes, (d) => d.column).sort((a, b) => a[0] - b[0]);
for (const [, colNodes] of columns) colNodes.forEach((n, i) => (n.rank = i));

const barycenter = (n, links, neighborOf) => {
  const weight = d3.sum(links, (l) => l.value);
  return weight > 0 ? d3.sum(links, (l) => neighborOf(l).rank * l.value) / weight : n.rank;
};

for (let sweep = 0; sweep < 4; sweep++) {
  const forward = sweep % 2 === 0;
  const order = forward ? d3.range(1, numColumns) : d3.range(numColumns - 2, -1, -1);
  for (const c of order) {
    const [, colNodes] = columns[c];
    const links = forward ? "targetLinks" : "sourceLinks";
    const neighborOf = forward ? (l) => l.source : (l) => l.target;
    colNodes
      .map((n) => ({ n, key: barycenter(n, n[links], neighborOf) }))
      .sort((a, b) => a.key - b.key)
      .forEach(({ n }, i) => {
        colNodes[i] = n;
        n.rank = i;
      });
  }
}

// --- Vertical (value-proportional) layout ------------------------------------
// Interior (non-first/last) columns label above each node, which needs ~41px
// of clearance to the sibling node stacked above it -- outer columns label
// beside the node at its own mid-height instead, so they don't need extra
// room. Give interior columns a taller gap so a stacked sibling's rect never
// sits under another node's label (independent of which node the
// crossing-reduction pass above happens to rank first).
const outerPadding = 26;
const innerPadding = 50;
const paddingFor = (c) => (c === 0 || c === numColumns - 1 ? outerPadding : innerPadding);
const maxPadding = d3.max(columns, ([c, ns]) => (ns.length - 1) * paddingFor(c));
const maxColumnValue = d3.max(columns, ([, ns]) => d3.sum(ns, (n) => n.value));
const ky = (ih - maxPadding) / maxColumnValue;

for (const [c, colNodes] of columns) {
  for (const n of colNodes) n.h = n.value * ky;
  const pad = paddingFor(c);
  const total = d3.sum(colNodes, (n) => n.h) + (colNodes.length - 1) * pad;
  let cursor = margin.top + (ih - total) / 2;
  for (const n of colNodes) {
    n.y0 = cursor;
    n.y1 = cursor + n.h;
    cursor = n.y1 + pad;
  }
}

// Stack each node's source/target links along its height, in link-array order,
// and record the vertical centre of each link's allocated segment.
for (const n of nodes) {
  let sy = n.y0;
  for (const l of n.sourceLinks) {
    const h = l.value * ky;
    l.sy = sy + h / 2;
    l.width = Math.max(1.25, h);
    sy += h;
  }
  let ty = n.y0;
  for (const l of n.targetLinks) {
    const h = l.value * ky;
    l.ty = ty + h / 2;
    ty += h;
  }
}

// --- Color: source and carrier nodes each get a distinct Imprint hue (links
// inherit their immediate source node's color); the first encountered node
// (a true source, "Coal") is #009E73 — the mandated first categorical series.
// End-use nodes (the last column) each aggregate multiple unrelated flows, so
// they get the theme-adaptive "muted" semantic anchor instead of continuing
// the palette cycle, which would otherwise recycle hues onto categories that
// have no relationship to the source node that first used that color. ------
const isLight = window.ANYPLOT_THEME === "light";
const muted = isLight ? "#6B6A63" : "#A8A79F";
const colorOf = new Map();
let paletteIdx = 0;
for (const n of nodes) {
  if (n.column === numColumns - 1) {
    colorOf.set(n.id, muted);
  } else {
    colorOf.set(n.id, t.palette[paletteIdx % t.palette.length]);
    paletteIdx++;
  }
}

// --- SVG mount ----------------------------------------------------------------
const svg = d3.select("#container").append("svg").attr("width", width).attr("height", height);

// --- Links ----------------------------------------------------------------
const linkPath = d3
  .linkHorizontal()
  .x((d) => d.x)
  .y((d) => d.y);

svg
  .append("g")
  .attr("fill", "none")
  .selectAll("path")
  .data(links)
  .join("path")
  .attr("d", (l) =>
    linkPath({
      source: { x: l.source.x1, y: l.sy },
      target: { x: l.target.x0, y: l.ty },
    })
  )
  .attr("stroke", (l) => colorOf.get(l.source.id))
  .attr("stroke-width", (l) => l.width)
  .attr("stroke-opacity", 0.42);

// --- Nodes ----------------------------------------------------------------
const nodeG = svg.append("g").selectAll("g").data(nodes).join("g");

nodeG
  .append("rect")
  .attr("x", (n) => n.x0)
  .attr("y", (n) => n.y0)
  .attr("width", (n) => n.x1 - n.x0)
  .attr("height", (n) => Math.max(1, n.y1 - n.y0))
  .attr("rx", 3)
  .attr("fill", (n) => colorOf.get(n.id))
  .attr("stroke", t.pageBg)
  .attr("stroke-width", 1.5);

// --- Node labels: side columns get flush left/right labels outside the
// diagram body; the middle column (fed from both sides) labels above. ---------
const fmt = d3.format(",");
nodeG.each(function (n) {
  const g = d3.select(this);
  const isFirst = n.column === 0;
  const isLast = n.column === numColumns - 1;
  const midY = (n.y0 + n.y1) / 2;

  let anchor, tx, ty1, ty2;
  if (isFirst) {
    anchor = "end";
    tx = n.x0 - 12;
    ty1 = midY - 5;
    ty2 = midY + 15;
  } else if (isLast) {
    anchor = "start";
    tx = n.x1 + 12;
    ty1 = midY - 5;
    ty2 = midY + 15;
  } else {
    anchor = "middle";
    tx = (n.x0 + n.x1) / 2;
    ty1 = n.y0 - 28;
    ty2 = n.y0 - 10;
  }

  // A page-bg halo keeps labels legible where a link ribbon's curve happens
  // to sweep behind them (e.g. the middle carrier column, whose incoming
  // ribbons fan out across the full source-column height).
  g.append("text")
    .attr("x", tx)
    .attr("y", ty1)
    .attr("text-anchor", anchor)
    .attr("fill", t.ink)
    .attr("paint-order", "stroke")
    .attr("stroke", t.pageBg)
    .attr("stroke-width", 5)
    .attr("stroke-linejoin", "round")
    .style("font-size", "17px")
    .style("font-weight", "600")
    .text(n.id);

  g.append("text")
    .attr("x", tx)
    .attr("y", ty2)
    .attr("text-anchor", anchor)
    .attr("fill", t.inkSoft)
    .attr("paint-order", "stroke")
    .attr("stroke", t.pageBg)
    .attr("stroke-width", 5)
    .attr("stroke-linejoin", "round")
    .style("font-size", "14px")
    .style("font-weight", "600")
    .text(`${fmt(n.value)} TWh`);
});

// --- Title + subtitle -----------------------------------------------------
svg
  .append("text")
  .attr("x", width / 2)
  .attr("y", 52)
  .attr("text-anchor", "middle")
  .attr("fill", t.ink)
  .style("font-size", "28px")
  .style("font-weight", "700")
  .text("National Energy Flow: Sources to End Use");

svg
  .append("text")
  .attr("x", width / 2)
  .attr("y", 84)
  .attr("text-anchor", "middle")
  .attr("fill", t.inkSoft)
  .style("font-size", "17px")
  .text("Generation sources route through carriers to residential, commercial, industrial, and transport demand (TWh)");

svg
  .append("text")
  .attr("x", width / 2)
  .attr("y", height - 22)
  .attr("text-anchor", "middle")
  .attr("fill", t.inkSoft)
  .style("font-size", "13px")
  .text("sankey-basic · javascript · d3 · anyplot.ai");
Runnable source as JSON, for any HTTP client: https://api.anyplot.ai/specs/sankey-basic/d3/code. Any spec id and library id listed in llms-full.txt fit the same URL shape; every URL below is complete and callable.
{
  "spec_id": "sankey-basic",
  "language": "javascript",
  "library": "d3",
  "page": "https://anyplot.ai/sankey-basic/javascript/d3",
  "hub": "https://anyplot.ai/sankey-basic",
  "code_json": "https://api.anyplot.ai/specs/sankey-basic/d3/code",
  "spec_json": "https://api.anyplot.ai/specs/sankey-basic",
  "render_light_png": "https://storage.googleapis.com/anyplot-images/plots/sankey-basic/javascript/d3/plot-light.png",
  "render_dark_png": "https://storage.googleapis.com/anyplot-images/plots/sankey-basic/javascript/d3/plot-dark.png",
  "interactive_light_html": "https://storage.googleapis.com/anyplot-images/plots/sankey-basic/javascript/d3/plot-light.html",
  "interactive_dark_html": "https://storage.googleapis.com/anyplot-images/plots/sankey-basic/javascript/d3/plot-dark.html",
  "quality_score": 89.0,
  "license": "MIT",
  "guide": "https://anyplot.ai/llms.txt"
}
Part of Basic Sankey Diagram on anyplot.ai.