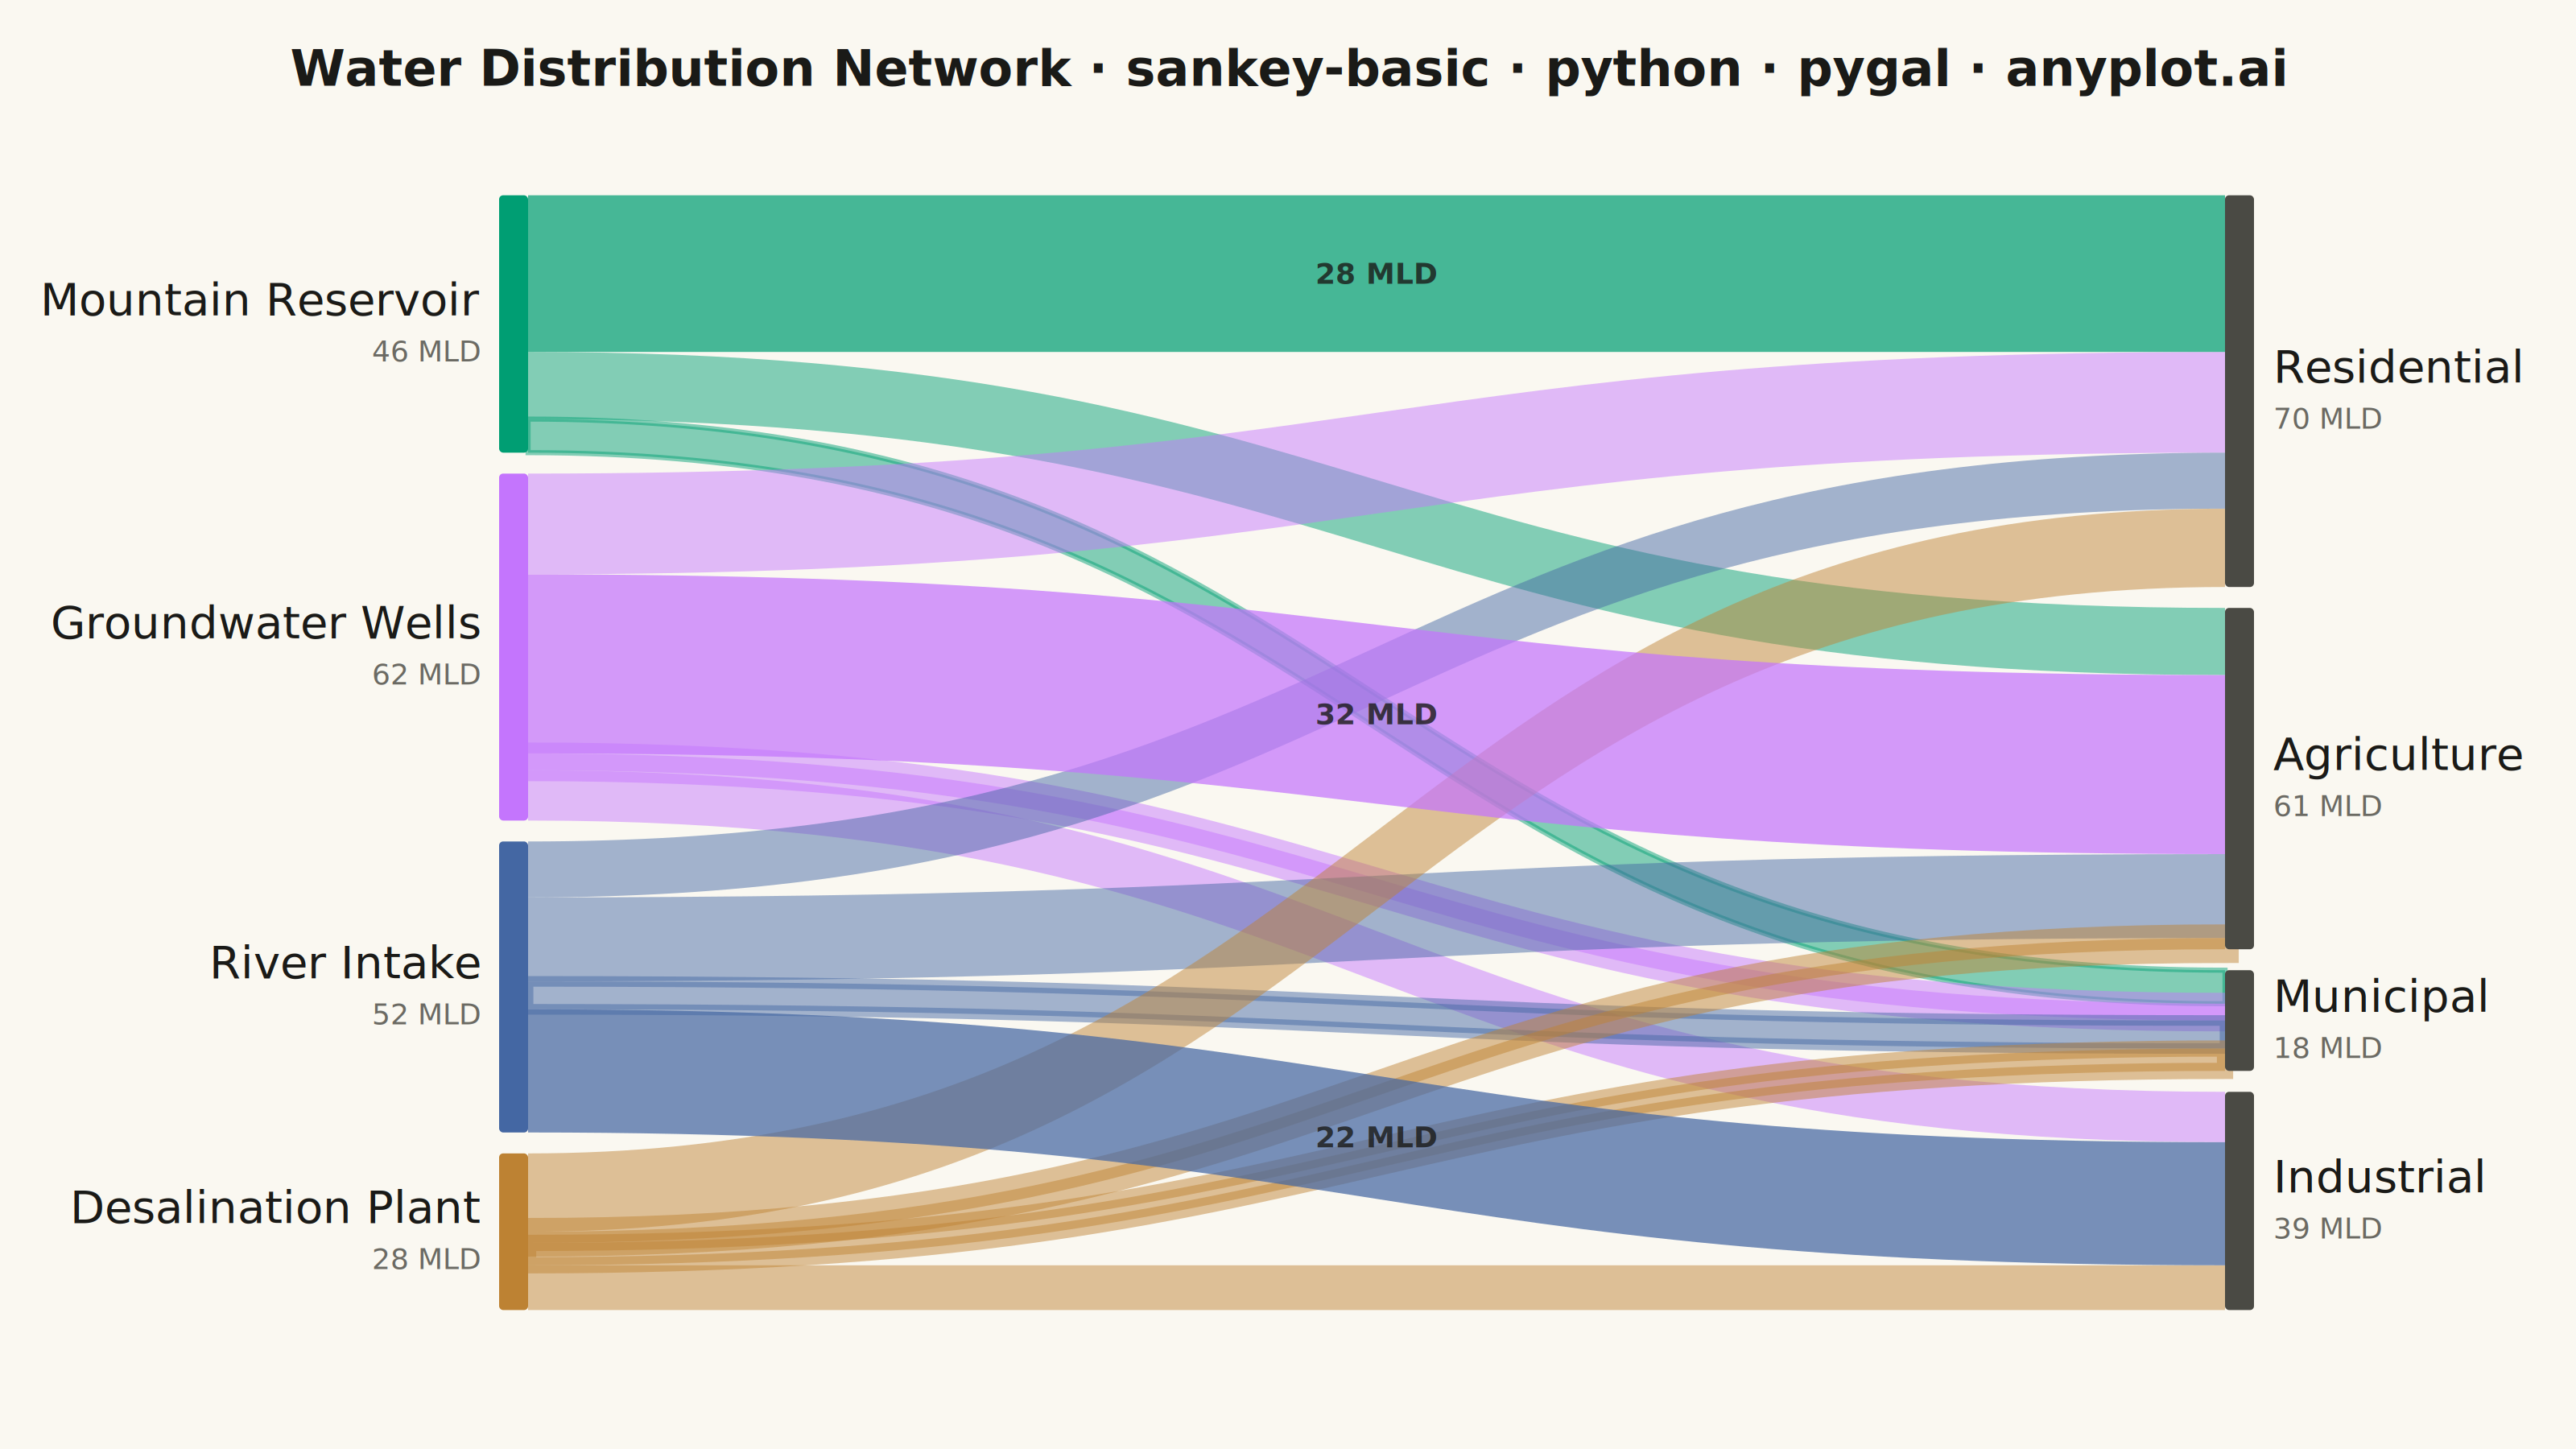
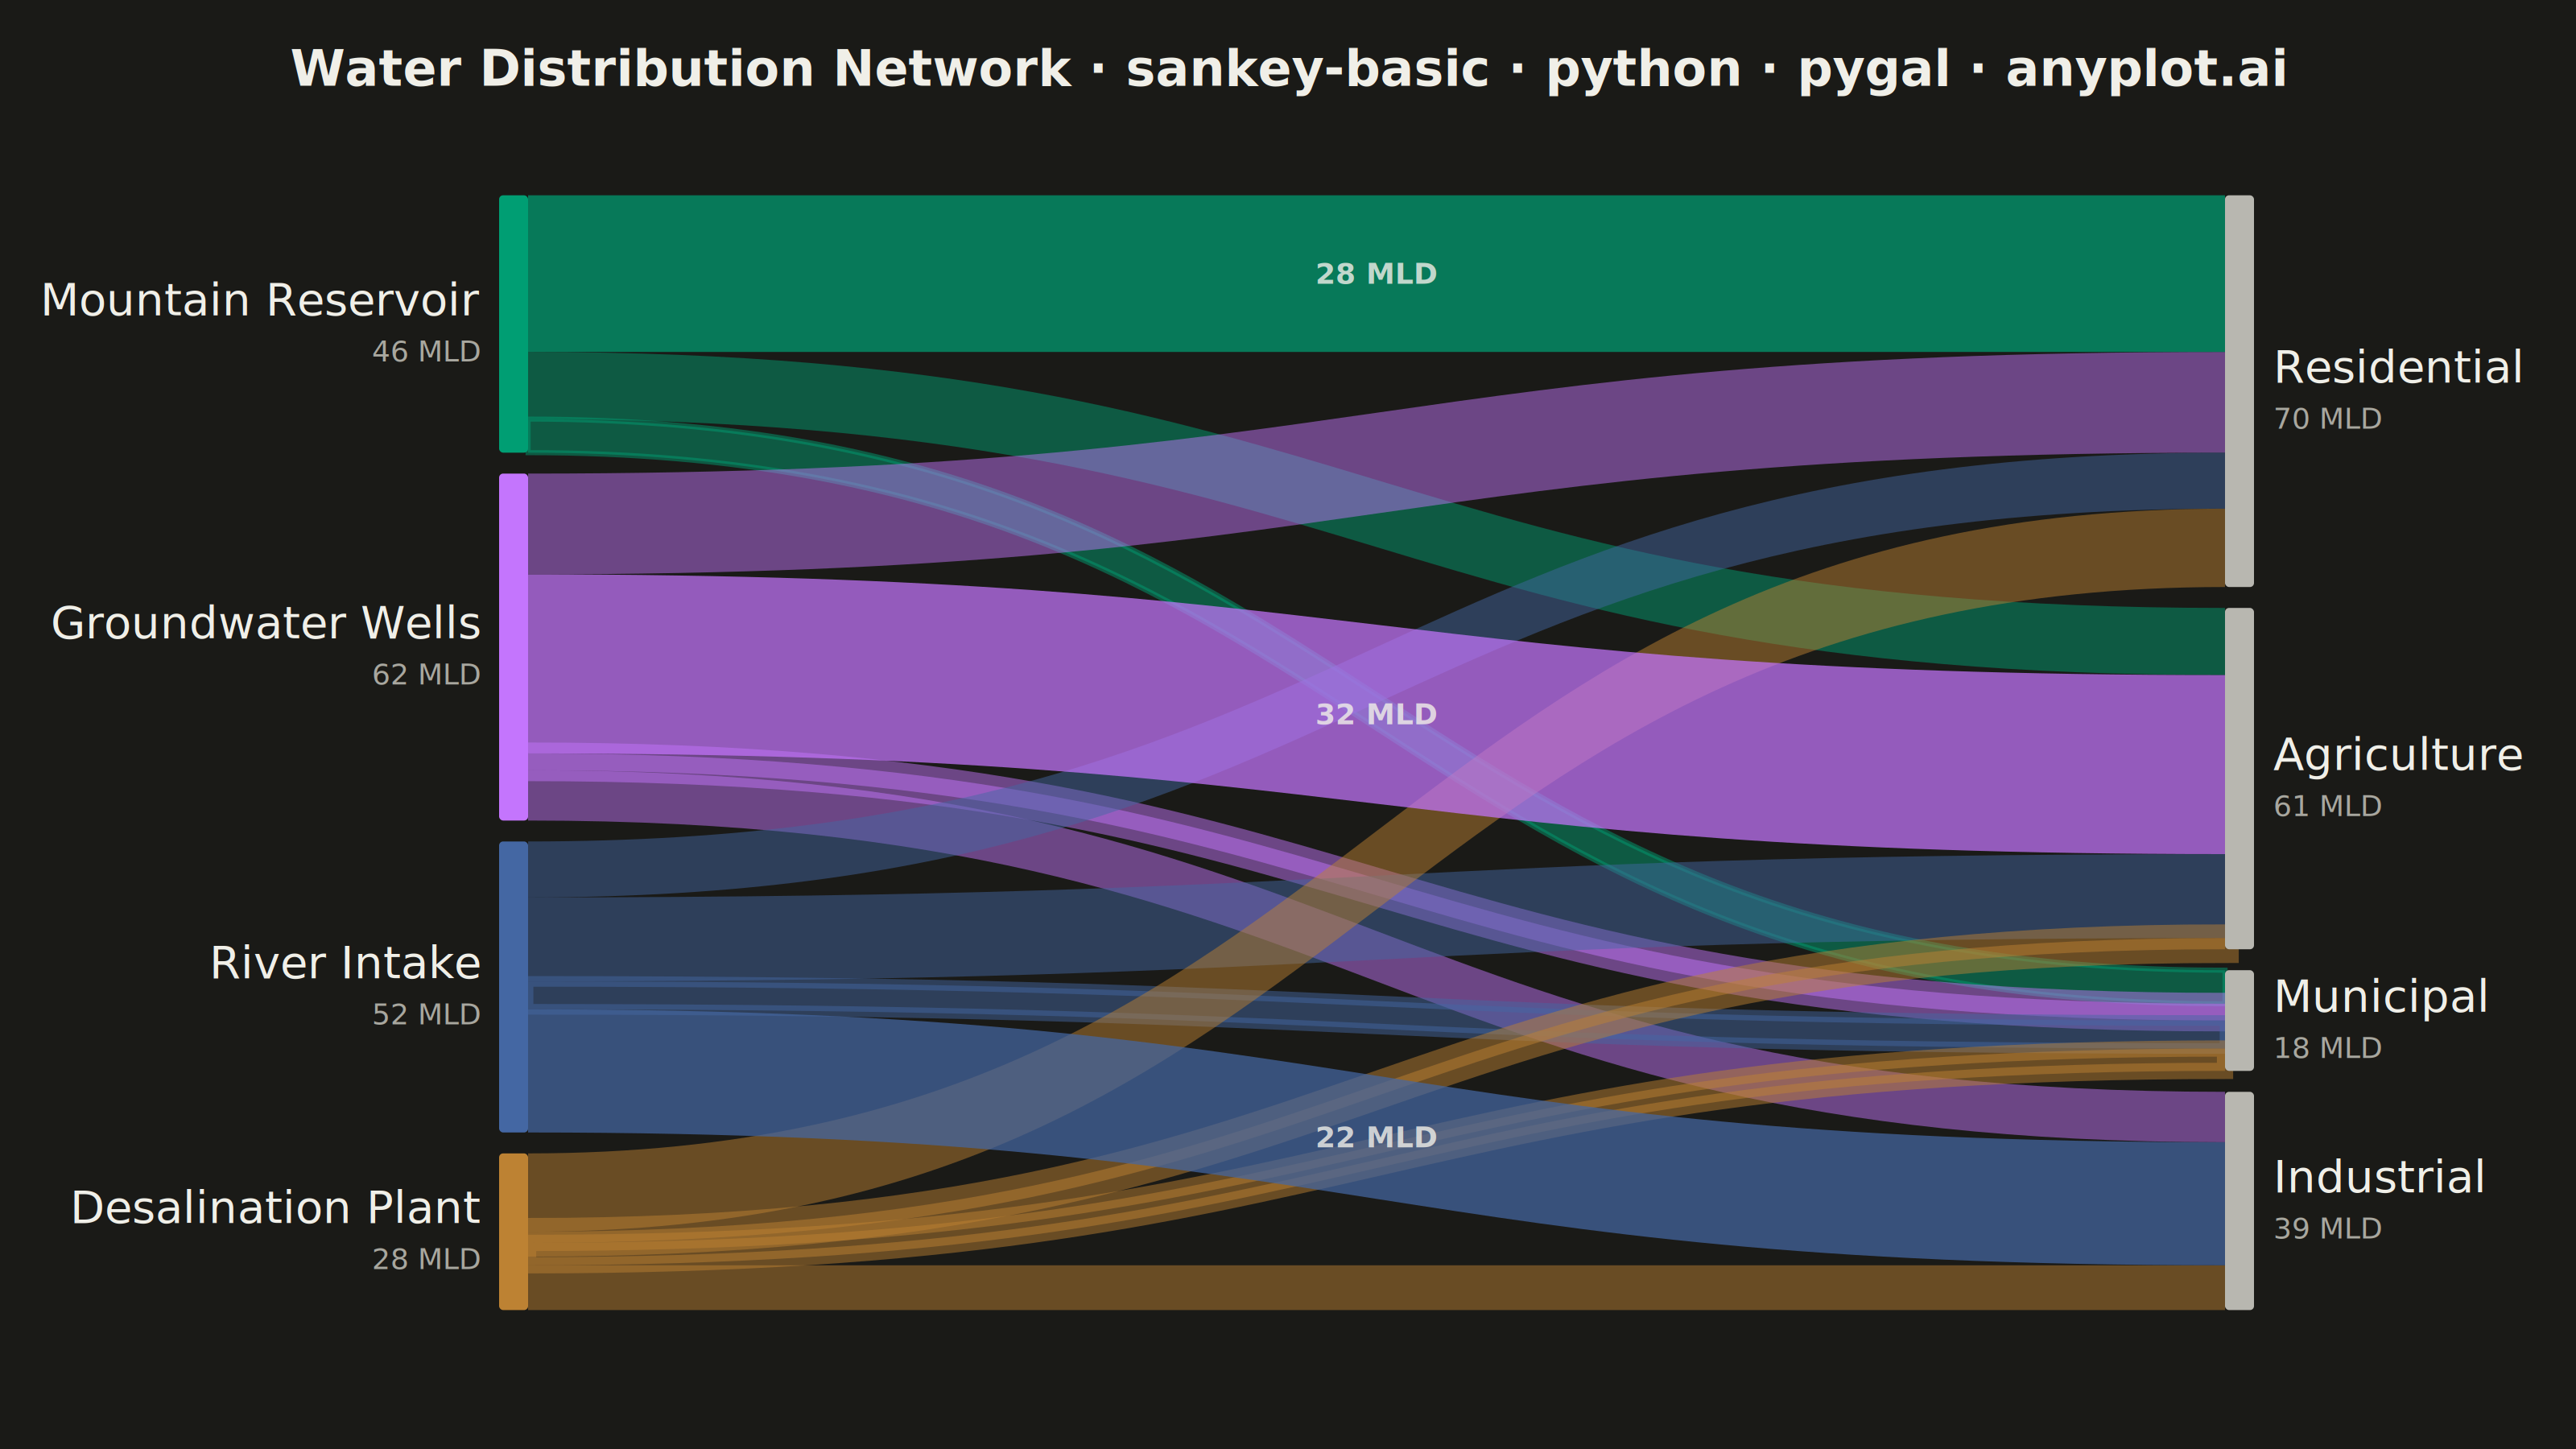
A Sankey diagram visualizes flow or transfer between nodes using links with widths proportional to flow values. It excels at showing how quantities distribute from sources to destinations, revealing patterns in resource allocation, process flows, and system transitions. The diagram makes it easy to identify major pathways and compare relative magnitudes of different flows.
""" anyplot.ai
sankey-basic: Basic Sankey Diagram
Library: pygal 3.1.3 | Python 3.13.14
Quality: 89/100 | Updated: 2026-07-25
"""

import os
import sys
from itertools import permutations


# Pop script dir so this file (pygal.py) doesn't shadow the installed pygal package
_script_dir = sys.path.pop(0)
import cairosvg
from pygal.style import Style


sys.path.insert(0, _script_dir)

# Theme tokens
THEME = os.getenv("ANYPLOT_THEME", "light")
PAGE_BG = "#FAF8F1" if THEME == "light" else "#1A1A17"
INK = "#1A1A17" if THEME == "light" else "#F0EFE8"
INK_SOFT = "#4A4A44" if THEME == "light" else "#B8B7B0"
INK_MUTED = "#6B6A63" if THEME == "light" else "#A8A79F"

IMPRINT = ("#009E73", "#C475FD", "#4467A3", "#BD8233", "#AE3030", "#2ABCCD", "#954477", "#99B314")

# pygal Style is the single source of truth for all Imprint tokens.
# pygal has no native Sankey chart class, so the diagram itself is built as raw
# SVG below (also true of every other pygal Sankey in this codebase) — but every
# color/font value the SVG uses is read back off this Style object rather than
# hardcoded twice.
chart_style = Style(
    background=PAGE_BG,
    plot_background=PAGE_BG,
    foreground=INK,
    foreground_strong=INK,
    foreground_subtle=INK_MUTED,
    colors=IMPRINT,
    title_font_size=66,
    label_font_size=56,
    value_font_size=36,
    font_family="sans-serif",
)

# Read all visual tokens from the Style object — single source of truth
BG = chart_style.background
FG = chart_style.foreground
FG_SUBTLE = chart_style.foreground_subtle
PALETTE = chart_style.colors
LABEL_SIZE = chart_style.label_font_size
VALUE_SIZE = chart_style.value_font_size
FONT = chart_style.font_family

# Canvas — 3200x1800 landscape (Step 0 hard contract)
WIDTH = 3200
HEIGHT = 1800
MARGIN_L = 620
MARGIN_R = 400
MARGIN_T = 170
MARGIN_B = 100
NODE_W = 36
NODE_GAP = 26
BREATHING_ROOM = 0.90  # shrink node/link scale so columns don't touch top/bottom margins

# Dominant flows get higher opacity to direct attention to key pathways
ALPHA_DOMINANT = 0.72
ALPHA_DEFAULT = 0.48
DOMINANT_THRESHOLD = 20  # MLD (million liters per day)

# Thinnest ribbons get a same-color stroke halo so they stay visible once the
# 3200px canvas is downscaled to the ~400px mobile width (previous review:
# ~2px flows vanished on mobile)
MIN_RIBBON_PX = 48

# Data — municipal water distribution, sources to end-use sectors (MLD)
node_labels = [
    "Mountain Reservoir",
    "Groundwater Wells",
    "River Intake",
    "Desalination Plant",
    "Residential",
    "Agriculture",
    "Industrial",
    "Municipal",
]
N_SRC = 4  # first 4 are sources; rest are targets

flows = [
    (0, 4, 28),  # Mountain Reservoir -> Residential  <- dominant
    (0, 5, 12),  # Mountain Reservoir -> Agriculture
    (0, 7, 6),  # Mountain Reservoir -> Municipal
    (1, 4, 18),  # Groundwater Wells -> Residential
    (1, 5, 32),  # Groundwater Wells -> Agriculture   <- dominant
    (1, 6, 9),  # Groundwater Wells -> Industrial
    (1, 7, 3),  # Groundwater Wells -> Municipal
    (2, 4, 10),  # River Intake -> Residential
    (2, 5, 15),  # River Intake -> Agriculture
    (2, 6, 22),  # River Intake -> Industrial         <- dominant
    (2, 7, 5),  # River Intake -> Municipal
    (3, 4, 14),  # Desalination Plant -> Residential
    (3, 5, 2),  # Desalination Plant -> Agriculture
    (3, 6, 8),  # Desalination Plant -> Industrial
    (3, 7, 4),  # Desalination Plant -> Municipal
]

# Compute per-node totals
node_total = [0] * len(node_labels)
for src, tgt, val in flows:
    node_total[src] += val
    node_total[tgt] += val

# Crossing-minimization: with 4x4 nodes both columns can be exhaustively
# searched (4! x 4! = 576 combinations) to find the vertical stacking order
# that minimizes link crossings — previous review flagged the unordered
# layout as a dense "hairball" in the middle of the diagram.
tgt_indices = list(range(N_SRC, len(node_labels)))


def _count_crossings(src_perm, tgt_perm):
    src_pos = {node: pos for pos, node in enumerate(src_perm)}
    tgt_pos = {node: pos for pos, node in enumerate(tgt_perm)}
    crossings = 0
    for i in range(len(flows)):
        s1, t1, _ = flows[i]
        for j in range(i + 1, len(flows)):
            s2, t2, _ = flows[j]
            if s1 == s2 or t1 == t2:
                continue
            if (src_pos[s1] - src_pos[s2]) * (tgt_pos[t1] - tgt_pos[t2]) < 0:
                crossings += 1
    return crossings


src_order, tgt_order = min(
    ((sp, tp) for sp in permutations(range(N_SRC)) for tp in permutations(tgt_indices)),
    key=lambda pair: _count_crossings(*pair),
)

# Layout: vertical scale so the taller column fills available height, with
# breathing room left top/bottom (previous review: whitespace too tight)
avail_h = HEIGHT - MARGIN_T - MARGIN_B
n_src_gaps = N_SRC - 1
n_tgt_gaps = len(node_labels) - N_SRC - 1
scale = (avail_h - max(n_src_gaps, n_tgt_gaps) * NODE_GAP) / sum(node_total[:N_SRC]) * BREATHING_ROOM

# Node y positions, indexed by original node index. Stacking order within
# each column follows src_order/tgt_order (the crossing-minimized order),
# not the raw node index.
node_x = [0.0] * len(node_labels)
node_y0 = [0.0] * len(node_labels)
node_y1 = [0.0] * len(node_labels)

# Source nodes (left column)
src_block_h = sum(node_total[i] * scale for i in range(N_SRC)) + n_src_gaps * NODE_GAP
y = MARGIN_T + (avail_h - src_block_h) / 2
for i in src_order:
    h = node_total[i] * scale
    node_x[i] = MARGIN_L
    node_y0[i] = y
    node_y1[i] = y + h
    y += h + NODE_GAP

# Target nodes (right column)
tgt_block_h = sum(node_total[i] * scale for i in tgt_indices) + n_tgt_gaps * NODE_GAP
y = MARGIN_T + (avail_h - tgt_block_h) / 2
for i in tgt_order:
    h = node_total[i] * scale
    node_x[i] = WIDTH - MARGIN_R - NODE_W
    node_y0[i] = y
    node_y1[i] = y + h
    y += h + NODE_GAP

# Link paths (cubic bezier ribbons). Each node's incident flows are stacked
# by the *other* endpoint's column position (not data-definition order) so
# ribbons don't gratuitously twist right where they leave/enter a node —
# this complements the src_order/tgt_order column reorder above in cutting
# down the crossing "hairball" the previous review flagged.
src_pos = {node: pos for pos, node in enumerate(src_order)}
tgt_pos = {node: pos for pos, node in enumerate(tgt_order)}
src_link_order = sorted(range(len(flows)), key=lambda i: (flows[i][0], tgt_pos[flows[i][1]]))
tgt_link_order = sorted(range(len(flows)), key=lambda i: (flows[i][1], src_pos[flows[i][0]]))

y1t_by_flow = [0.0] * len(flows)
src_cursor = list(node_y0[:N_SRC])
for i in src_link_order:
    src, _tgt, val = flows[i]
    y1t_by_flow[i] = src_cursor[src]
    src_cursor[src] += val * scale

y2t_by_flow = [0.0] * len(flows)
tgt_cursor = list(node_y0[N_SRC:])
for i in tgt_link_order:
    _src, tgt, val = flows[i]
    tgt_local = tgt - N_SRC
    y2t_by_flow[i] = tgt_cursor[tgt_local]
    tgt_cursor[tgt_local] += val * scale

link_data = []
for i, (src, tgt, val) in enumerate(flows):
    h = val * scale
    x1 = node_x[src] + NODE_W
    y1t = y1t_by_flow[i]
    y1b = y1t + h
    x2 = node_x[tgt]
    y2t = y2t_by_flow[i]
    y2b = y2t + h

    cx = (x1 + x2) / 2
    path = (
        f"M {x1:.1f},{y1t:.1f} "
        f"C {cx:.1f},{y1t:.1f} {cx:.1f},{y2t:.1f} {x2:.1f},{y2t:.1f} "
        f"L {x2:.1f},{y2b:.1f} "
        f"C {cx:.1f},{y2b:.1f} {cx:.1f},{y1b:.1f} {x1:.1f},{y1b:.1f} Z"
    )
    c = PALETTE[src]  # color drawn from Style object palette
    r, g, b = int(c[1:3], 16), int(c[3:5], 16), int(c[5:7], 16)
    alpha = ALPHA_DOMINANT if val >= DOMINANT_THRESHOLD else ALPHA_DEFAULT
    dominant = val >= DOMINANT_THRESHOLD
    # Ribbon midpoint for annotation placement
    ribbon_mid_y = (y1t + y1b + y2t + y2b) / 4
    tooltip = f"{node_labels[src]} → {node_labels[tgt]}: {val} MLD"
    # Same-color stroke halo widens the visible ribbon for thin flows without
    # disturbing the node-band geometry (previous review: ~2 MLD ribbons
    # shrank to ~2px once downscaled to the 400px mobile width)
    thin_halo = max(0.0, MIN_RIBBON_PX - h)
    link_data.append((f"rgba({r},{g},{b},{alpha})", path, dominant, cx, ribbon_mid_y, val, tooltip, thin_halo))

# Title — scale fontsize down for long titles (see plot-generator.md "Title
# fontsize must scale with title length")
title_text = "Water Distribution Network · sankey-basic · python · pygal · anyplot.ai"
title_ratio = 67 / len(title_text) if len(title_text) > 67 else 1.0
title_size = max(44, round(chart_style.title_font_size * title_ratio))

# Build SVG string. pygal ships no Sankey chart class, so nodes/links are drawn
# as raw SVG (colors/fonts still sourced from chart_style above). Hover
# highlighting + native <title> tooltips give the HTML output real
# interactivity even without pygal's own chart JS.
parts = [
    f'<svg xmlns="http://www.w3.org/2000/svg" width="{WIDTH}" height="{HEIGHT}" viewBox="0 0 {WIDTH} {HEIGHT}">',
    "<style>.flow{transition:opacity 0.15s ease}.flow:hover{opacity:0.95 !important}.node:hover{opacity:0.85}</style>",
    f'<rect width="{WIDTH}" height="{HEIGHT}" fill="{BG}"/>',
    # Title — font size from chart_style.title_font_size, scaled for length
    f'<text x="{WIDTH // 2}" y="{MARGIN_T // 2}" text-anchor="middle" '
    f'dominant-baseline="middle" font-family="{FONT}" font-size="{title_size}" '
    f'font-weight="700" fill="{FG}">{title_text}</text>',
    '<g id="links">',
]

# Non-dominant flows drawn first (background layer)
for fill, path, dominant, _cx, _ribbon_mid_y, _val, tooltip, thin_halo in link_data:
    if not dominant:
        stroke = f' stroke="{fill}" stroke-width="{thin_halo:.1f}"' if thin_halo > 0 else ' stroke="none"'
        parts.append(f'<path class="flow" d="{path}" fill="{fill}"{stroke}><title>{tooltip}</title></path>')

# Dominant flows drawn on top with annotation showing their magnitude
for fill, path, dominant, cx, ribbon_mid_y, val, tooltip, thin_halo in link_data:
    if dominant:
        stroke = f' stroke="{fill}" stroke-width="{thin_halo:.1f}"' if thin_halo > 0 else ' stroke="none"'
        parts.append(f'<path class="flow" d="{path}" fill="{fill}"{stroke}><title>{tooltip}</title></path>')
        parts.append(
            f'<text x="{cx:.1f}" y="{ribbon_mid_y:.1f}" text-anchor="middle" '
            f'dominant-baseline="middle" font-family="{FONT}" font-size="{VALUE_SIZE}" '
            f'font-weight="700" fill="{FG}" opacity="0.80">{val} MLD</text>'
        )

parts.append("</g>")

# Nodes
parts.append('<g id="nodes">')
for i in range(len(node_labels)):
    color = PALETTE[i] if i < N_SRC else INK_SOFT
    x = node_x[i]
    y0 = node_y0[i]
    h = node_y1[i] - node_y0[i]
    parts.append(
        f'<rect class="node" x="{x:.1f}" y="{y0:.1f}" width="{NODE_W}" height="{h:.1f}" '
        f'fill="{color}" rx="5"><title>{node_labels[i]}: {node_total[i]} MLD</title></rect>'
    )
parts.append("</g>")

# Labels — font sizes from chart_style.label_font_size / chart_style.value_font_size
parts.append('<g id="labels">')
for i in range(len(node_labels)):
    y_mid = (node_y0[i] + node_y1[i]) / 2
    label = node_labels[i]
    val_str = f"{node_total[i]} MLD"
    if i < N_SRC:
        tx = node_x[i] - 24
        anchor = "end"
    else:
        tx = node_x[i] + NODE_W + 24
        anchor = "start"
    parts.append(
        f'<text x="{tx:.1f}" y="{y_mid - 30:.1f}" text-anchor="{anchor}" '
        f'dominant-baseline="middle" font-family="{FONT}" font-size="{LABEL_SIZE}" '
        f'font-weight="500" fill="{FG}">{label}</text>'
    )
    parts.append(
        f'<text x="{tx:.1f}" y="{y_mid + 34:.1f}" text-anchor="{anchor}" '
        f'dominant-baseline="middle" font-family="{FONT}" font-size="{VALUE_SIZE}" '
        f'fill="{FG_SUBTLE}">{val_str}</text>'
    )
parts.append("</g>")
parts.append("</svg>")

svg_content = "\n".join(parts)

# Save HTML (pygal-style interactive output — hover a flow or node for its tooltip)
html_content = (
    f'<!DOCTYPE html><html><head><meta charset="utf-8">'
    f"<title>sankey-basic · pygal · anyplot.ai</title>"
    f"<style>body{{margin:0;background:{BG}}}</style></head>"
    f"<body>{svg_content}</body></html>"
)
with open(f"plot-{THEME}.html", "w", encoding="utf-8") as fh:
    fh.write(html_content)

# Save PNG via cairosvg (same pipeline pygal.render_to_png uses internally)
cairosvg.svg2png(bytestring=svg_content.encode("utf-8"), write_to=f"plot-{THEME}.png")
Runnable source as JSON, for any HTTP client: https://api.anyplot.ai/specs/sankey-basic/pygal/code. Any spec id and library id listed in llms-full.txt fit the same URL shape; every URL below is complete and callable.
{
  "spec_id": "sankey-basic",
  "language": "python",
  "library": "pygal",
  "page": "https://anyplot.ai/sankey-basic/python/pygal",
  "hub": "https://anyplot.ai/sankey-basic",
  "code_json": "https://api.anyplot.ai/specs/sankey-basic/pygal/code",
  "spec_json": "https://api.anyplot.ai/specs/sankey-basic",
  "render_light_png": "https://storage.googleapis.com/anyplot-images/plots/sankey-basic/python/pygal/plot-light.png",
  "render_dark_png": "https://storage.googleapis.com/anyplot-images/plots/sankey-basic/python/pygal/plot-dark.png",
  "interactive_light_html": "https://storage.googleapis.com/anyplot-images/plots/sankey-basic/python/pygal/plot-light.html",
  "interactive_dark_html": "https://storage.googleapis.com/anyplot-images/plots/sankey-basic/python/pygal/plot-dark.html",
  "quality_score": 89.0,
  "license": "MIT",
  "guide": "https://anyplot.ai/llms.txt"
}
Part of Basic Sankey Diagram on anyplot.ai.