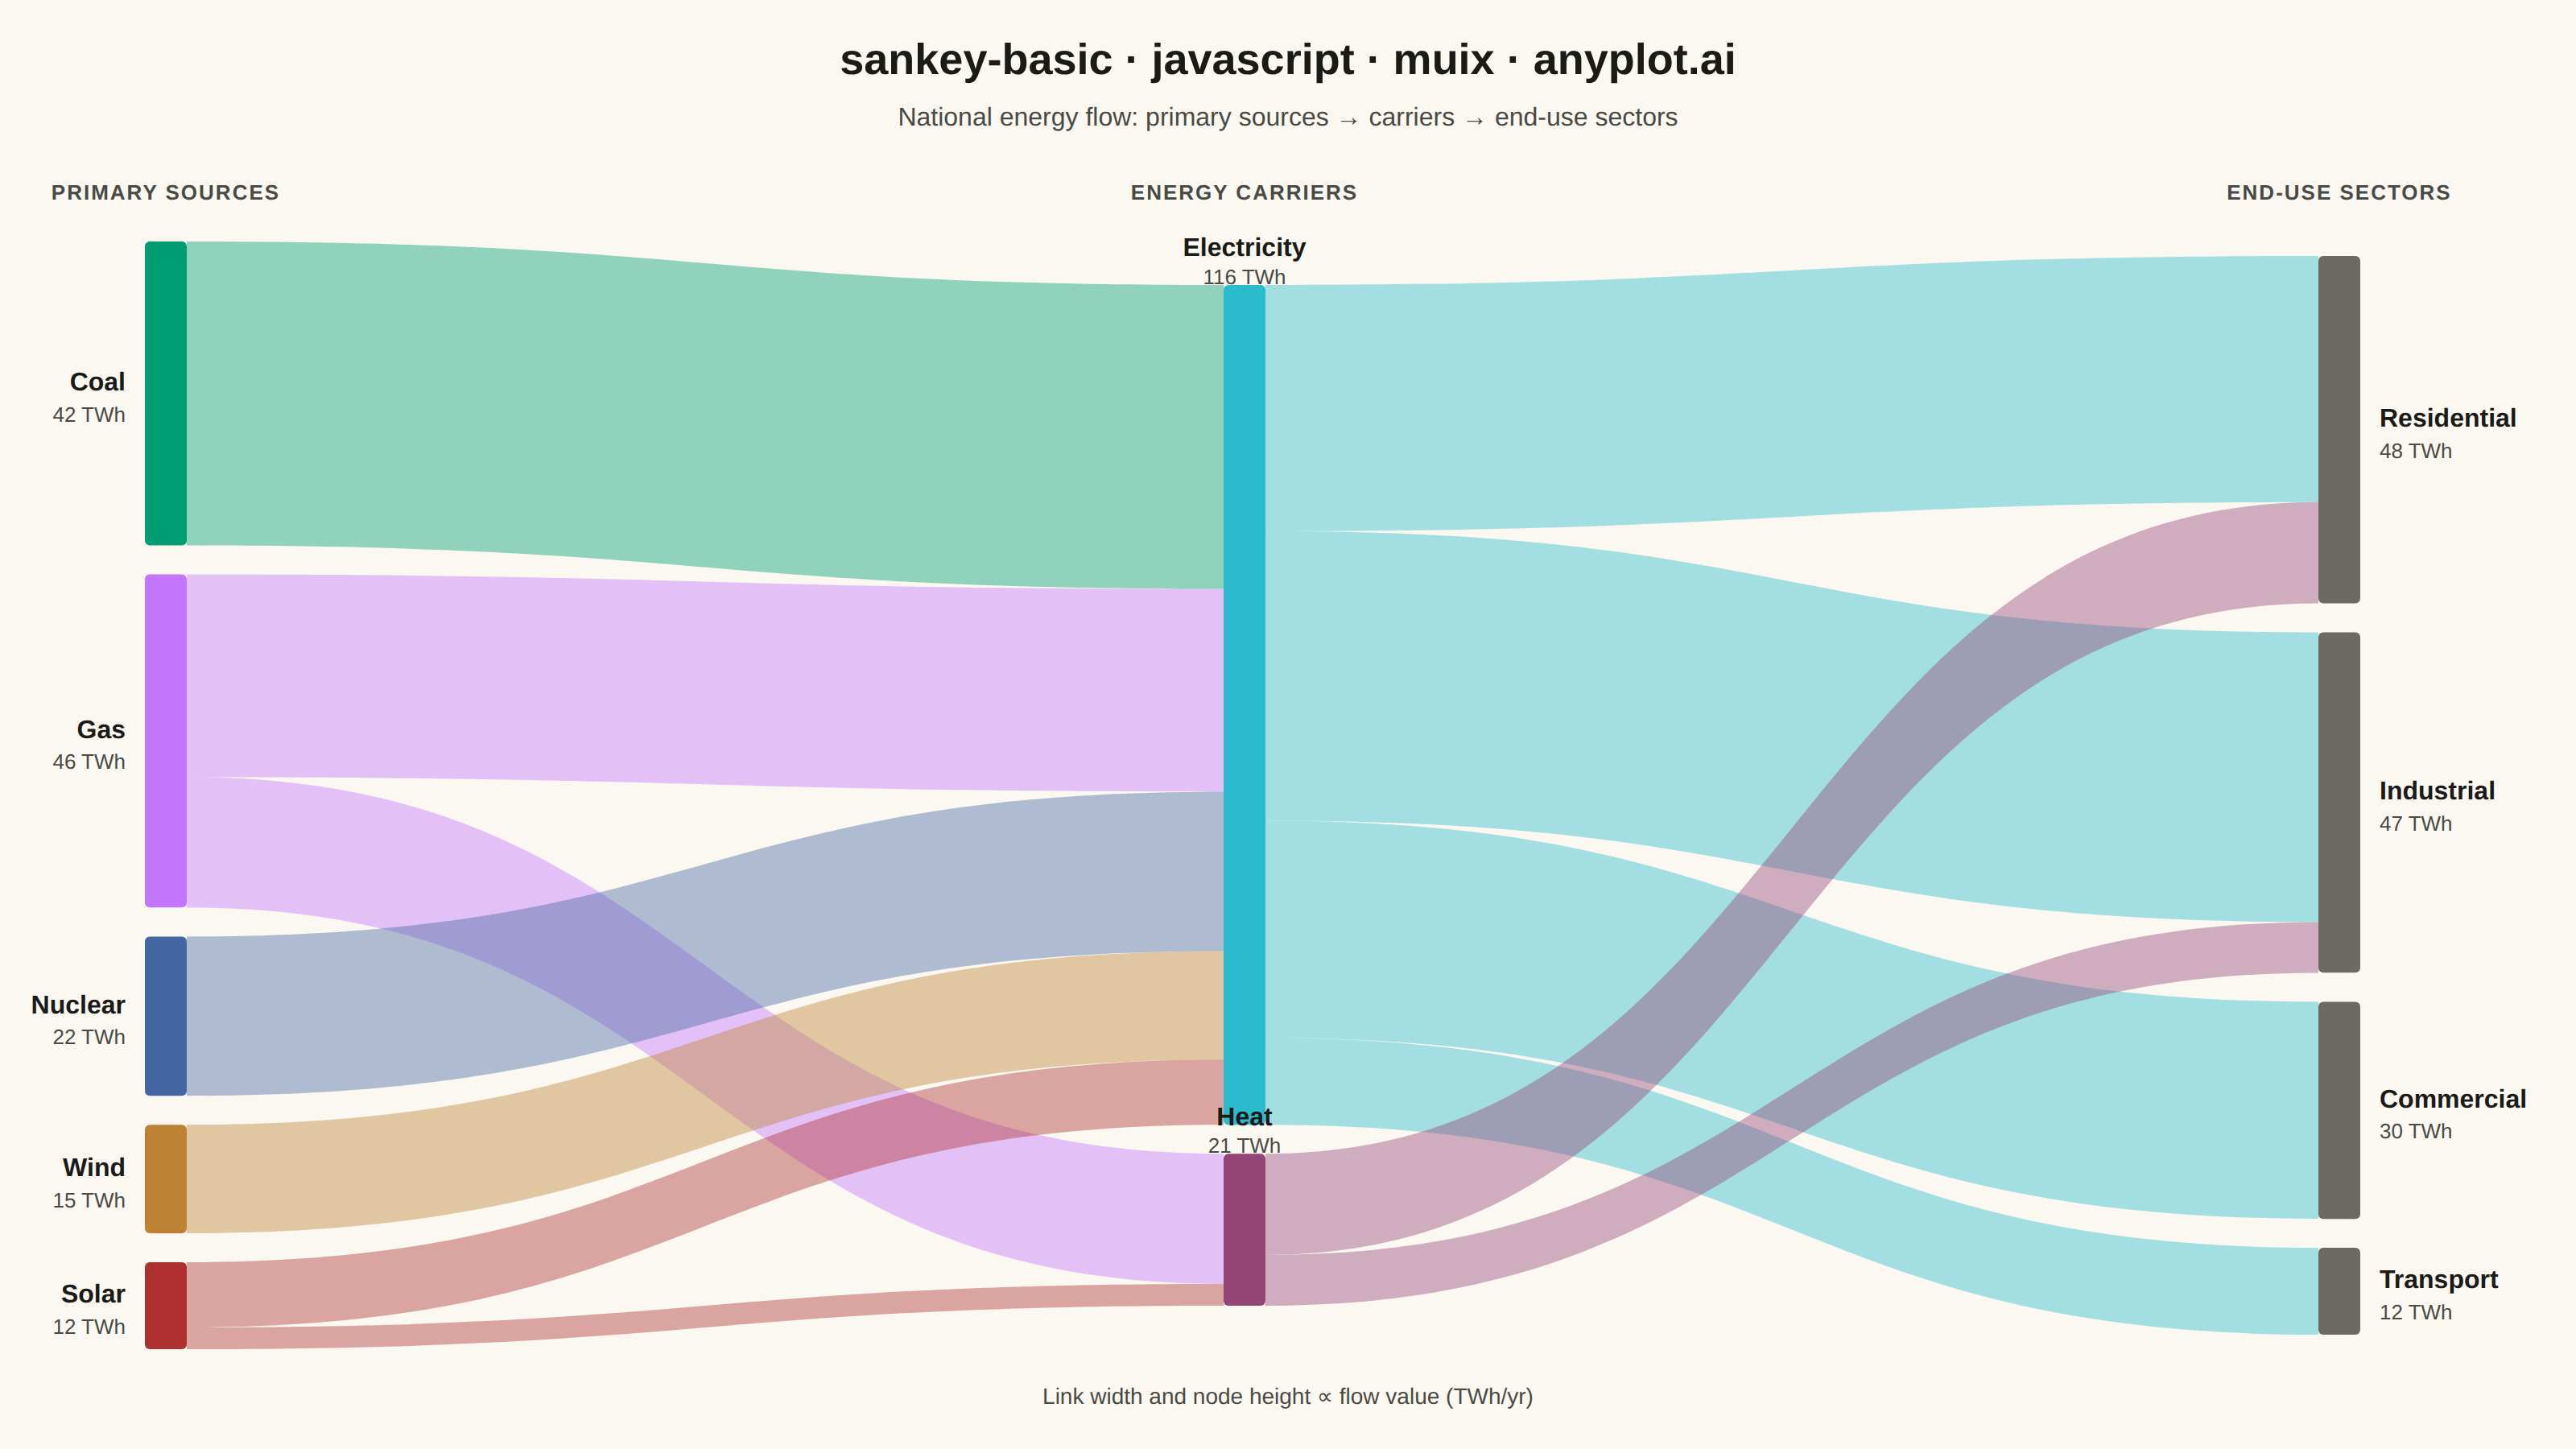
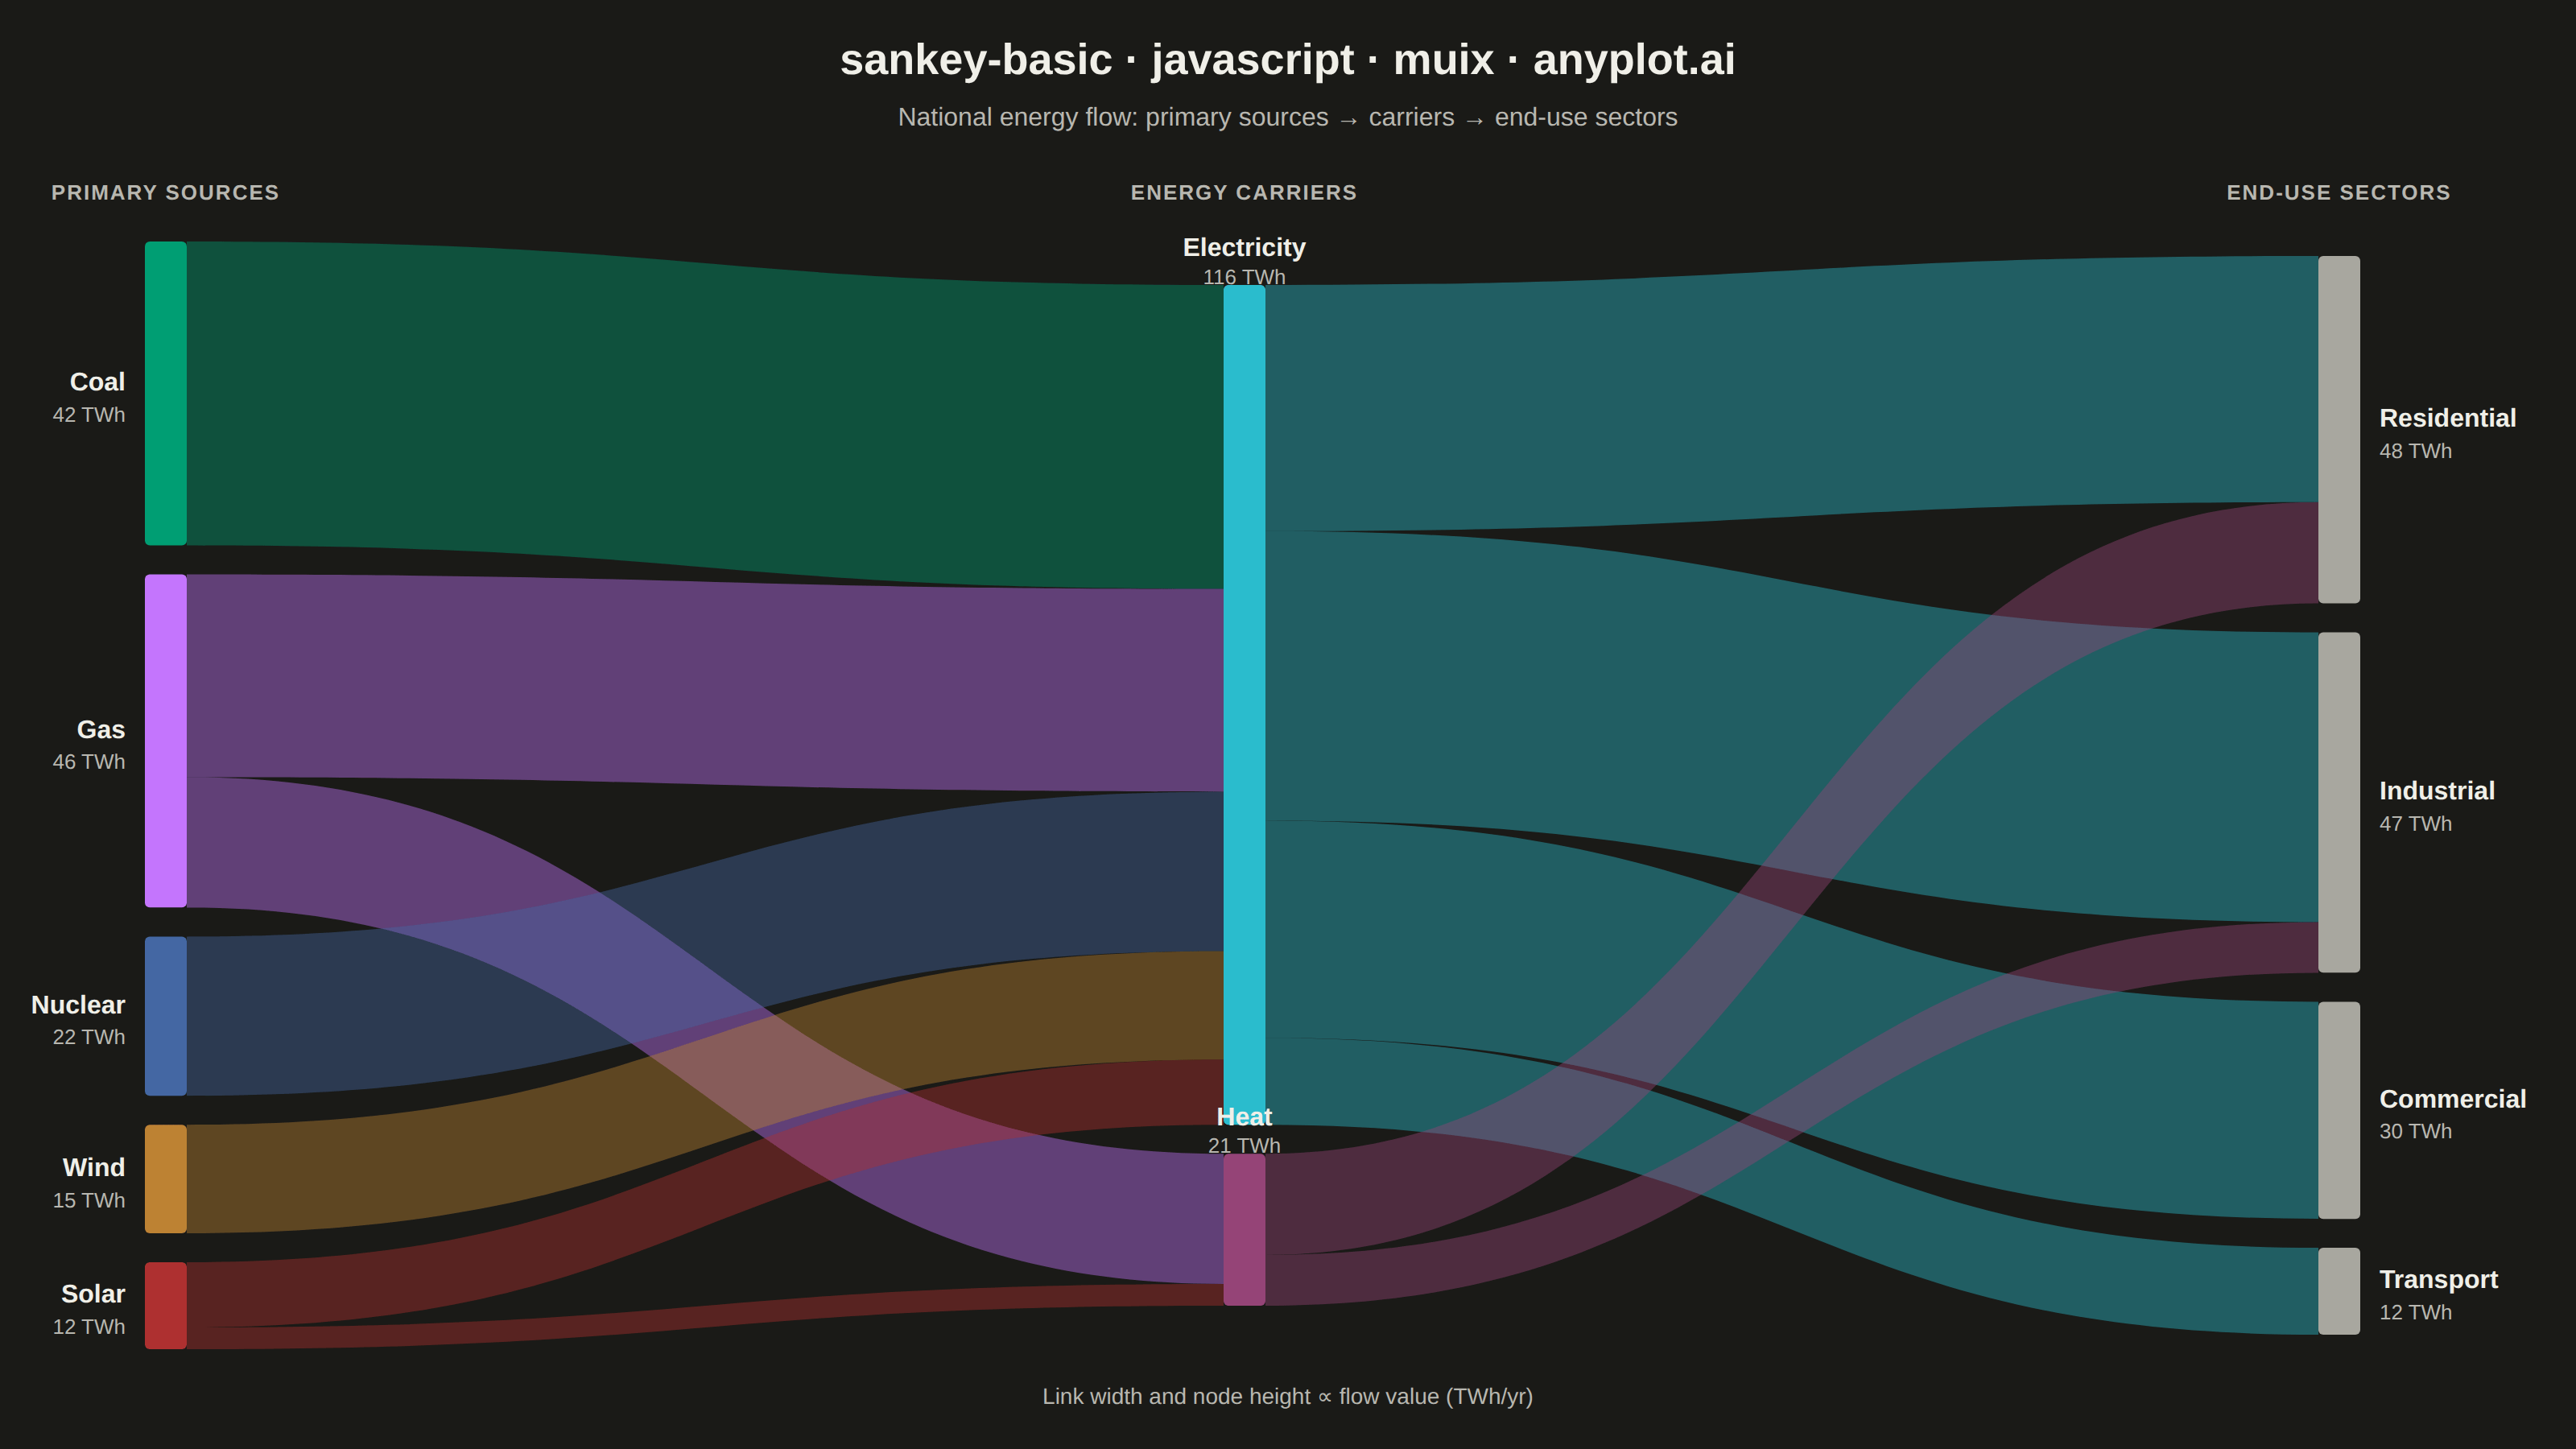
The same plot in 13 other libraries — JavaScript: D3.js, Apache ECharts, Highcharts; Python: Altair, Bokeh, lets-plot, Matplotlib, Plotly, plotnine, Pygal, Seaborn; R: ggplot2; Julia: Makie.jl. Compare all 14 side by side: Basic Sankey Diagram in Python, R, Julia and JavaScript.
A Sankey diagram visualizes flow or transfer between nodes using links with widths proportional to flow values. It excels at showing how quantities distribute from sources to destinations, revealing patterns in resource allocation, process flows, and system transitions. The diagram makes it easy to identify major pathways and compare relative magnitudes of different flows.
// anyplot.ai
// sankey-basic: Basic Sankey Diagram
// Library: muix 7.29.1 | JavaScript 22.23.1
// Quality: 90/100 | Created: 2026-07-25
import { ChartContainer } from "@mui/x-charts/ChartContainer";
import { useXScale, useYScale } from "@mui/x-charts/hooks";

const t = window.ANYPLOT_TOKENS;
const SIZE = window.ANYPLOT_SIZE;
const TITLE = "sankey-basic · javascript · muix · anyplot.ai";
const MUTED = t.theme === "light" ? "#6B6A63" : "#A8A79F"; // Imprint muted anchor

const FONT =
  '-apple-system, BlinkMacSystemFont, "Segoe UI", Roboto, Helvetica, Arial, sans-serif';

// --- Data: national energy flow, sources → carriers → end-use sectors (TWh) --
// Deterministic, in-memory. No link has source === target, and the graph is a
// strict left-to-right DAG (3 stages), so there are no circular flows. Wind
// and Solar are combined into one "Renewables" source so the 4 source
// categories stay within canonical palette positions 1-4 — position 5
// (#AE3030) is the reserved bad/loss/error anchor, not a free ordinal slot.
const NODES_RAW = [
  { id: "coal", label: "Coal", col: 0, color: t.palette[0] },
  { id: "gas", label: "Gas", col: 0, color: t.palette[1] },
  { id: "nuclear", label: "Nuclear", col: 0, color: t.palette[2] },
  { id: "renewables", label: "Renewables", col: 0, color: t.palette[3] },
  { id: "electricity", label: "Electricity", col: 1, color: t.palette[5] },
  { id: "heat", label: "Heat", col: 1, color: t.palette[6] },
  { id: "residential", label: "Residential", col: 2, color: MUTED },
  { id: "industrial", label: "Industrial", col: 2, color: MUTED },
  { id: "commercial", label: "Commercial", col: 2, color: MUTED },
  { id: "transport", label: "Transport", col: 2, color: MUTED },
];

const LINKS_RAW = [
  { source: "coal", target: "electricity", value: 42 },
  { source: "gas", target: "electricity", value: 28 },
  { source: "gas", target: "heat", value: 18 },
  { source: "nuclear", target: "electricity", value: 22 },
  { source: "renewables", target: "electricity", value: 24 }, // wind 15 + solar 9
  { source: "renewables", target: "heat", value: 3 }, // solar 3
  { source: "electricity", target: "residential", value: 34 },
  { source: "electricity", target: "industrial", value: 40 },
  { source: "electricity", target: "commercial", value: 30 },
  { source: "electricity", target: "transport", value: 12 },
  { source: "heat", target: "residential", value: 14 },
  { source: "heat", target: "industrial", value: 7 },
];

const COL_HEADERS = ["PRIMARY SOURCES", "ENERGY CARRIERS", "END-USE SECTORS"];
const COL_X = [170, 760, 1440]; // left edge of the node bar per column; left-most gives "Renewables" room to the left
const NODE_W = 26;
const GAP = 18; // vertical gap between stacked nodes in the same column
const PLOT_TOP = 150;
const PLOT_BOTTOM = 838;
const PLOT_H = PLOT_BOTTOM - PLOT_TOP;
const H = SIZE.height; // used to flip top-down pixel y into the chart's data y

// --- Layout: node sizes, per-column vertical stacking, link attach points ----
const nodes = NODES_RAW.map((n) => ({ ...n, out: [], in: [] }));
const byId = Object.fromEntries(nodes.map((n) => [n.id, n]));
for (const l of LINKS_RAW) {
  byId[l.source].out.push(l);
  byId[l.target].in.push(l);
}
for (const n of nodes) {
  const outSum = n.out.reduce((s, l) => s + l.value, 0);
  const inSum = n.in.reduce((s, l) => s + l.value, 0);
  n.value = Math.max(outSum, inSum);
}

const columns = [0, 1, 2].map((c) => nodes.filter((n) => n.col === c));

// Reorder nodes within each column by the value-weighted average rank of
// their linked counterparts (Sugiyama-style barycenter heuristic), sweeping
// left-to-right then right-to-left until it converges. This keeps nodes with
// shared flow paths adjacent, which cuts down ribbon crossings between
// columns instead of relying on the arbitrary NODES_RAW order.
const assignRanks = (col) => col.forEach((n, i) => (n.rank = i));
const barycenter = (links, counterpartId) => {
  const total = links.reduce((s, l) => s + l.value, 0);
  if (!total) return null;
  return links.reduce((s, l) => s + byId[counterpartId(l)].rank * l.value, 0) / total;
};
const reorder = (col, links, counterpartId) =>
  col
    .map((n, i) => ({ n, key: barycenter(links(n), counterpartId) ?? n.rank ?? i }))
    .sort((a, b) => a.key - b.key)
    .map((s) => s.n);

assignRanks(columns[0]);
for (let pass = 0; pass < 4; pass++) {
  if (pass % 2 === 0) {
    for (let c = 1; c < columns.length; c++) {
      columns[c] = reorder(columns[c], (n) => n.in, (l) => l.source);
      assignRanks(columns[c]);
    }
  } else {
    for (let c = columns.length - 2; c >= 0; c--) {
      columns[c] = reorder(columns[c], (n) => n.out, (l) => l.target);
      assignRanks(columns[c]);
    }
  }
}

// One shared px/unit scale (from the tightest-fitting column) keeps a given
// flow value the same thickness everywhere it appears in the diagram.
const scale = Math.min(
  ...columns.map((col) => {
    const total = col.reduce((s, n) => s + n.value, 0);
    return (PLOT_H - GAP * (col.length - 1)) / total;
  }),
);

for (const col of columns) {
  const stackH = col.reduce((s, n) => s + n.value * scale, 0) + GAP * (col.length - 1);
  let cursor = PLOT_TOP + (PLOT_H - stackH) / 2;
  for (const n of col) {
    n.x0 = COL_X[n.col];
    n.x1 = n.x0 + NODE_W;
    n.y0 = cursor; // top edge, top-down px
    n.h = n.value * scale;
    n.y1 = n.y0 + n.h; // bottom edge, top-down px
    cursor = n.y1 + GAP;
  }
}

// Stack each node's links along its edge, ordered by the counterpart's
// position, so ribbons fan out with minimal crossing near the node.
for (const n of nodes) {
  n.out.sort((a, b) => byId[a.target].y0 - byId[b.target].y0);
  let oc = n.y0;
  for (const l of n.out) {
    l.sy0 = oc;
    l.sy1 = oc + l.value * scale;
    l.sx = n.x1;
    oc = l.sy1;
  }
  n.in.sort((a, b) => byId[a.source].y0 - byId[b.source].y0);
  let ic = n.y0;
  for (const l of n.in) {
    l.ty0 = ic;
    l.ty1 = ic + l.value * scale;
    l.tx = n.x0;
    ic = l.ty1;
  }
}

const fmt = (v) => `${v} TWh`;

function ribbonPath(xs, ys, l) {
  const cx = (l.sx + l.tx) / 2;
  const P = (x, yPix) => `${xs(x).toFixed(1)} ${ys(H - yPix).toFixed(1)}`;
  const C = (yPix) => `${xs(cx).toFixed(1)} ${ys(H - yPix).toFixed(1)}`;
  return (
    `M ${P(l.sx, l.sy0)} ` +
    `C ${C(l.sy0)}, ${C(l.ty0)}, ${P(l.tx, l.ty0)} ` +
    `L ${P(l.tx, l.ty1)} ` +
    `C ${C(l.ty1)}, ${C(l.sy1)}, ${P(l.sx, l.sy1)} Z`
  );
}

// --- Overlay layers -----------------------------------------------------------
function Links() {
  const xs = useXScale();
  const ys = useYScale();
  return (
    <g>
      {LINKS_RAW.map((l, k) => (
        <path key={k} d={ribbonPath(xs, ys, l)} fill={byId[l.source].color} fillOpacity={0.42}>
          <title>{`${byId[l.source].label} → ${byId[l.target].label}: ${fmt(l.value)}`}</title>
        </path>
      ))}
    </g>
  );
}

function Nodes() {
  const xs = useXScale();
  const ys = useYScale();
  return (
    <g>
      {nodes.map((n) => (
        <rect
          key={n.id}
          x={xs(n.x0).toFixed(1)}
          y={ys(H - n.y0).toFixed(1)}
          width={(xs(n.x1) - xs(n.x0)).toFixed(1)}
          height={(ys(H - n.y1) - ys(H - n.y0)).toFixed(1)}
          fill={n.color}
          rx={3}
        >
          <title>{`${n.label}: ${fmt(n.value)}`}</title>
        </rect>
      ))}
    </g>
  );
}

function Labels() {
  const xs = useXScale();
  const ys = useYScale();
  return (
    <g fontFamily={FONT}>
      {COL_HEADERS.map((label, c) => (
        <text
          key={label}
          x={xs(COL_X[c] + NODE_W / 2)}
          y={ys(H - (PLOT_TOP - 26))}
          textAnchor="middle"
          fontSize={13}
          fontWeight={600}
          letterSpacing={1}
          fill={t.inkSoft}
        >
          {label}
        </text>
      ))}
      {nodes.map((n) => {
        const cy = ys(H - (n.y0 + n.h / 2));
        const anchor = n.col === 0 ? "end" : n.col === 2 ? "start" : "middle";
        const lx = n.col === 0 ? xs(n.x0) - 12 : n.col === 2 ? xs(n.x1) + 12 : xs((n.x0 + n.x1) / 2);
        const midAbove = n.col === 1;
        return (
          <g key={n.id}>
            <text
              x={lx}
              y={midAbove ? ys(H - n.y0) - 22 : cy - 6}
              textAnchor={anchor}
              dominantBaseline="middle"
              fontSize={16}
              fontWeight={600}
              fill={t.ink}
            >
              {n.label}
            </text>
            <text
              x={lx}
              y={midAbove ? ys(H - n.y0) - 4 : cy + 14}
              textAnchor={anchor}
              dominantBaseline="middle"
              fontSize={13}
              fill={t.inkSoft}
            >
              {fmt(n.value)}
            </text>
          </g>
        );
      })}
    </g>
  );
}

function Frame() {
  const xs = useXScale();
  const ys = useYScale();
  return (
    <g fontFamily={FONT}>
      <text x={xs(SIZE.width / 2)} y={ys(H - 46)} textAnchor="middle" fontSize={27} fontWeight={600} fill={t.ink}>
        {TITLE}
      </text>
      <text x={xs(SIZE.width / 2)} y={ys(H - 78)} textAnchor="middle" fontSize={16} fill={t.inkSoft}>
        National energy flow: primary sources → carriers → end-use sectors
      </text>
      <text x={xs(SIZE.width / 2)} y={ys(H - 872)} textAnchor="middle" fontSize={14} fill={t.inkSoft}>
        Link width and node height ∝ flow value (TWh/yr)
      </text>
    </g>
  );
}

// --- Chart (default-exported component — the harness mounts it) -------------
export default function Chart() {
  return (
    <ChartContainer
      width={SIZE.width}
      height={SIZE.height}
      margin={{ top: 0, right: 0, bottom: 0, left: 0 }}
      series={[]}
      xAxis={[{ id: "x", scaleType: "linear", min: 0, max: SIZE.width }]}
      yAxis={[{ id: "y", scaleType: "linear", min: 0, max: SIZE.height }]}
      skipAnimation
    >
      <Links />
      <Nodes />
      <Labels />
      <Frame />
    </ChartContainer>
  );
}
Runnable source as JSON, for any HTTP client: https://api.anyplot.ai/specs/sankey-basic/muix/code. Any spec id and library id listed in llms-full.txt fit the same URL shape; every URL below is complete and callable.
{
  "spec_id": "sankey-basic",
  "language": "javascript",
  "library": "muix",
  "page": "https://anyplot.ai/sankey-basic/javascript/muix",
  "hub": "https://anyplot.ai/sankey-basic",
  "code_json": "https://api.anyplot.ai/specs/sankey-basic/muix/code",
  "spec_json": "https://api.anyplot.ai/specs/sankey-basic",
  "render_light_png": "https://storage.googleapis.com/anyplot-images/plots/sankey-basic/javascript/muix/plot-light.png",
  "render_dark_png": "https://storage.googleapis.com/anyplot-images/plots/sankey-basic/javascript/muix/plot-dark.png",
  "interactive_light_html": "https://storage.googleapis.com/anyplot-images/plots/sankey-basic/javascript/muix/plot-light.html",
  "interactive_dark_html": "https://storage.googleapis.com/anyplot-images/plots/sankey-basic/javascript/muix/plot-dark.html",
  "quality_score": 90.0,
  "license": "MIT",
  "guide": "https://anyplot.ai/llms.txt"
}
Part of Basic Sankey Diagram on anyplot.ai.