The same plot in 13 other libraries — JavaScript: D3.js, Highcharts, MUI X Charts; Python: Altair, Bokeh, lets-plot, Matplotlib, Plotly, plotnine, Pygal, Seaborn; R: ggplot2; Julia: Makie.jl. Compare all 14 side by side: Basic Sankey Diagram in Python, R, Julia and JavaScript.
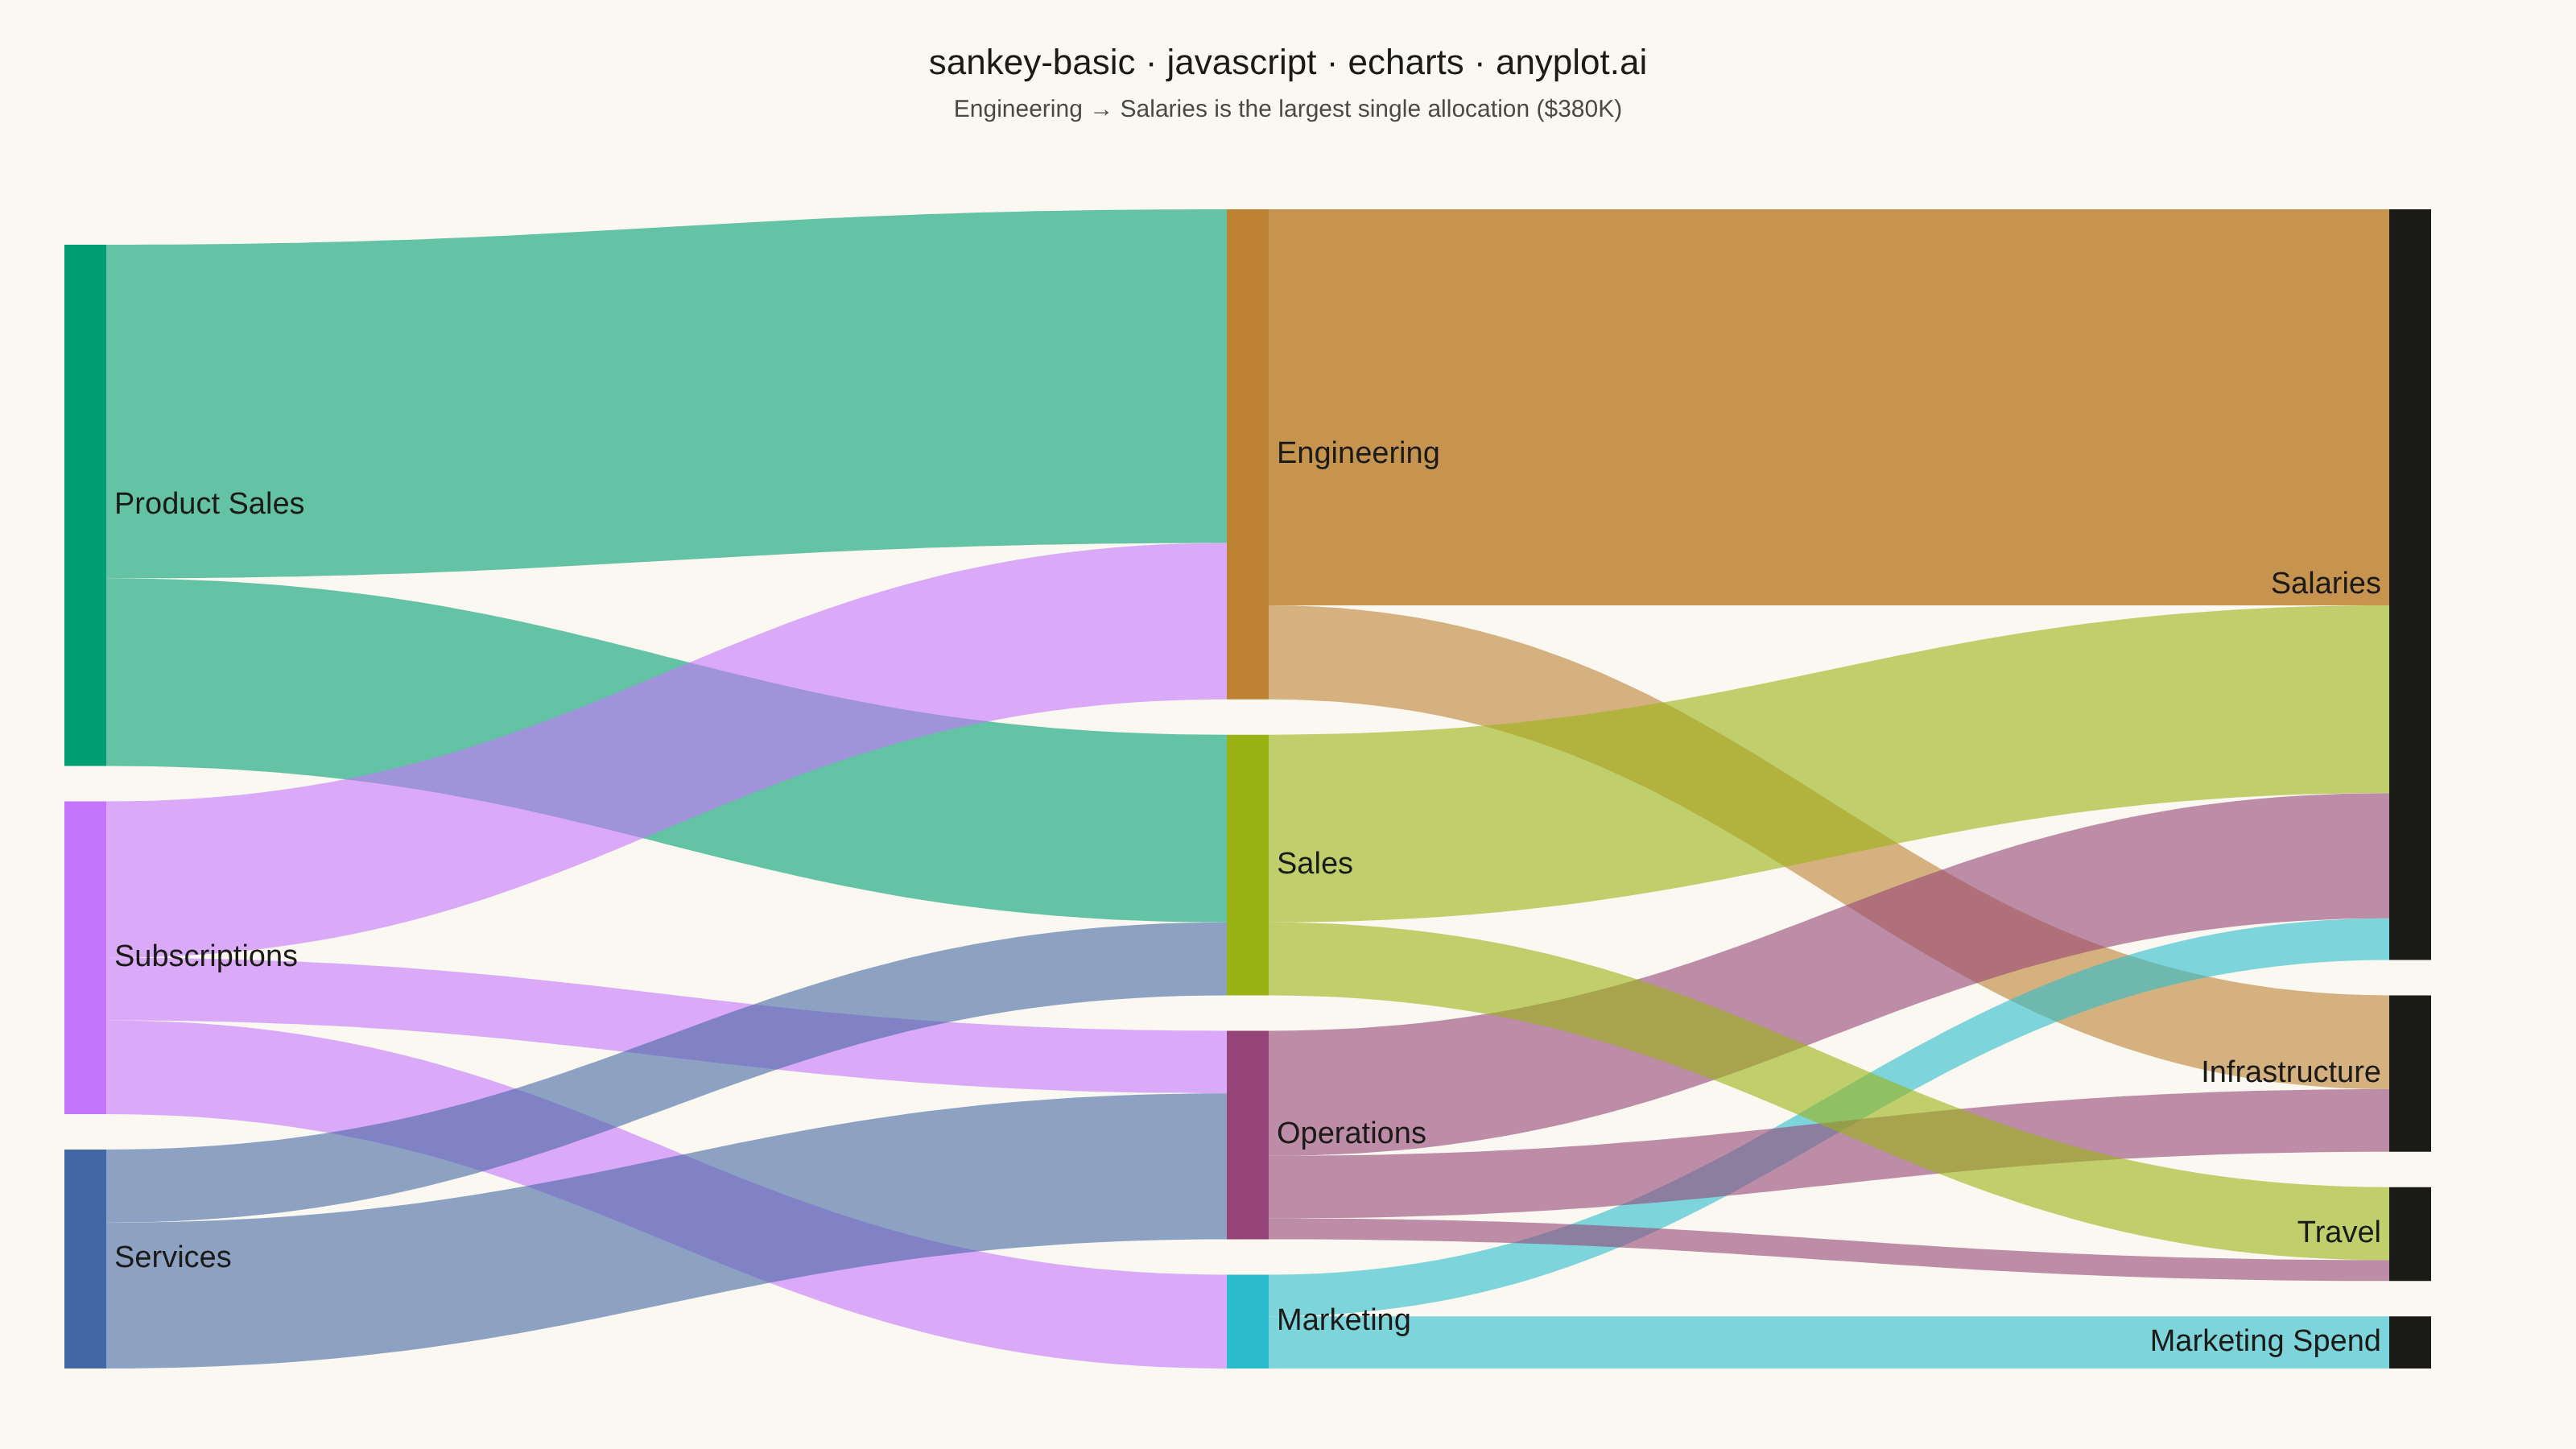
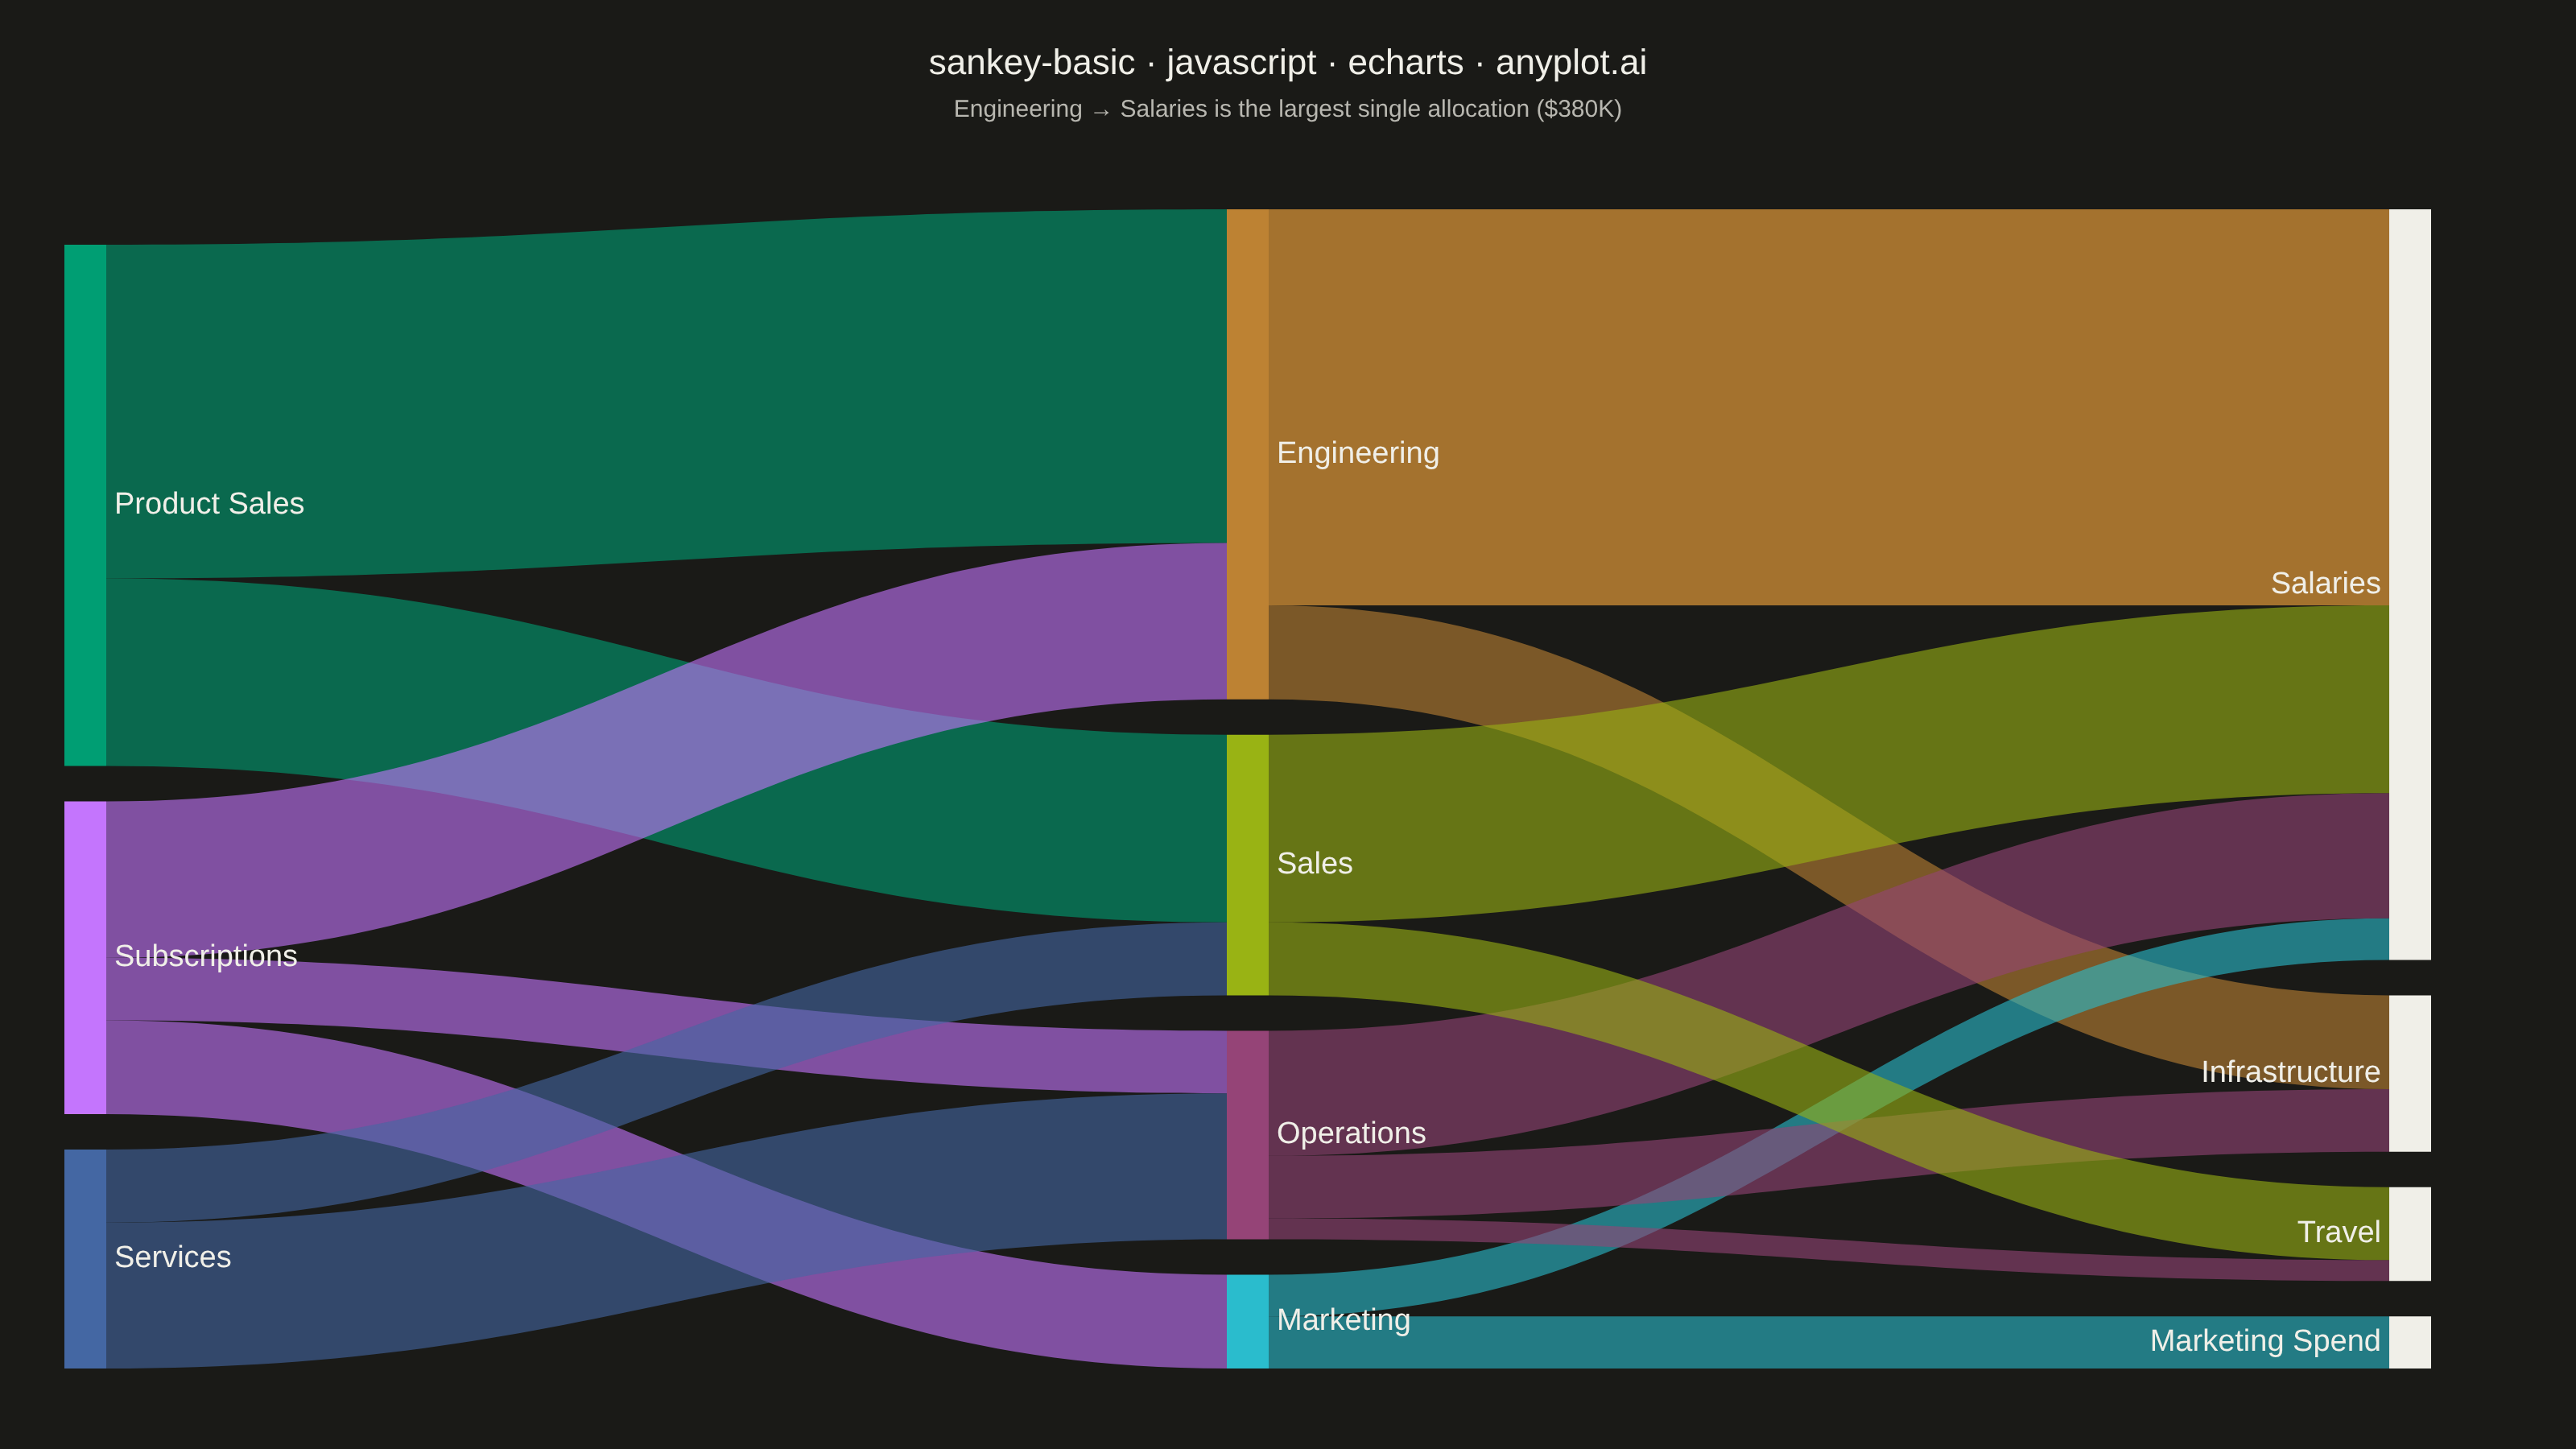
A Sankey diagram visualizes flow or transfer between nodes using links with widths proportional to flow values. It excels at showing how quantities distribute from sources to destinations, revealing patterns in resource allocation, process flows, and system transitions. The diagram makes it easy to identify major pathways and compare relative magnitudes of different flows.
// anyplot.ai
// sankey-basic: Basic Sankey Diagram
// Library: echarts 6.1.0 | JavaScript 22.23.1
// Quality: 88/100 | Created: 2026-07-25

const t = window.ANYPLOT_TOKENS;

// --- Data (in-memory, deterministic) ----------------------------------------
// Budget allocation: revenue sources -> departments -> expense categories.
const nodes = [
  { name: "Product Sales", itemStyle: { color: t.palette[0] } },
  { name: "Subscriptions", itemStyle: { color: t.palette[1] } },
  { name: "Services", itemStyle: { color: t.palette[2] } },
  { name: "Engineering", itemStyle: { color: t.palette[3] } },
  { name: "Marketing", itemStyle: { color: t.palette[5] } },
  { name: "Operations", itemStyle: { color: t.palette[6] } },
  { name: "Sales", itemStyle: { color: t.palette[7] } },
  { name: "Salaries", itemStyle: { color: t.ink }, label: { position: "left" } },
  { name: "Marketing Spend", itemStyle: { color: t.ink }, label: { position: "left" } },
  { name: "Infrastructure", itemStyle: { color: t.ink }, label: { position: "left" } },
  { name: "Travel", itemStyle: { color: t.ink }, label: { position: "left" } },
];

// The Engineering -> Salaries link (380) is the single largest flow in the
// budget; it gets a higher-opacity ribbon so it reads as the focal path.
const links = [
  { source: "Product Sales", target: "Engineering", value: 320 },
  { source: "Product Sales", target: "Sales", value: 180 },
  { source: "Subscriptions", target: "Engineering", value: 150 },
  { source: "Subscriptions", target: "Marketing", value: 90 },
  { source: "Subscriptions", target: "Operations", value: 60 },
  { source: "Services", target: "Operations", value: 140 },
  { source: "Services", target: "Sales", value: 70 },
  {
    source: "Engineering",
    target: "Salaries",
    value: 380,
    lineStyle: { opacity: 0.85 },
  },
  { source: "Engineering", target: "Infrastructure", value: 90 },
  { source: "Marketing", target: "Salaries", value: 40 },
  { source: "Marketing", target: "Marketing Spend", value: 50 },
  { source: "Operations", target: "Salaries", value: 120 },
  { source: "Operations", target: "Infrastructure", value: 60 },
  { source: "Operations", target: "Travel", value: 20 },
  { source: "Sales", target: "Salaries", value: 180 },
  { source: "Sales", target: "Travel", value: 70 },
];

// --- Init --------------------------------------------------------------------
const chart = echarts.init(document.getElementById("container"));

// --- Option --------------------------------------------------------------------
chart.setOption({
  animation: false,
  backgroundColor: "transparent",
  title: {
    text: "sankey-basic · javascript · echarts · anyplot.ai",
    subtext: "Engineering → Salaries is the largest single allocation ($380K)",
    left: "center",
    top: 24,
    textStyle: { color: t.ink, fontSize: 22, fontWeight: 500 },
    subtextStyle: { color: t.inkSoft, fontSize: 15 },
  },
  tooltip: { trigger: "item", triggerOn: "mousemove" },
  series: [
    {
      type: "sankey",
      left: 40,
      right: 90,
      top: 130,
      bottom: 50,
      nodeWidth: 26,
      nodeGap: 22,
      layoutIterations: 100,
      draggable: false,
      emphasis: { focus: "adjacency" },
      label: {
        color: t.ink,
        fontSize: 19,
        fontWeight: 500,
      },
      lineStyle: {
        color: "source",
        opacity: 0.6,
        curveness: 0.45,
      },
      itemStyle: { borderWidth: 0 },
      data: nodes,
      links: links,
    },
  ],
});
Runnable source as JSON, for any HTTP client: https://api.anyplot.ai/specs/sankey-basic/echarts/code. Any spec id and library id listed in llms-full.txt fit the same URL shape; every URL below is complete and callable.
{
  "spec_id": "sankey-basic",
  "language": "javascript",
  "library": "echarts",
  "page": "https://anyplot.ai/sankey-basic/javascript/echarts",
  "hub": "https://anyplot.ai/sankey-basic",
  "code_json": "https://api.anyplot.ai/specs/sankey-basic/echarts/code",
  "spec_json": "https://api.anyplot.ai/specs/sankey-basic",
  "render_light_png": "https://storage.googleapis.com/anyplot-images/plots/sankey-basic/javascript/echarts/plot-light.png",
  "render_dark_png": "https://storage.googleapis.com/anyplot-images/plots/sankey-basic/javascript/echarts/plot-dark.png",
  "interactive_light_html": "https://storage.googleapis.com/anyplot-images/plots/sankey-basic/javascript/echarts/plot-light.html",
  "interactive_dark_html": "https://storage.googleapis.com/anyplot-images/plots/sankey-basic/javascript/echarts/plot-dark.html",
  "quality_score": 88.0,
  "license": "MIT",
  "guide": "https://anyplot.ai/llms.txt"
}
Part of Basic Sankey Diagram on anyplot.ai.