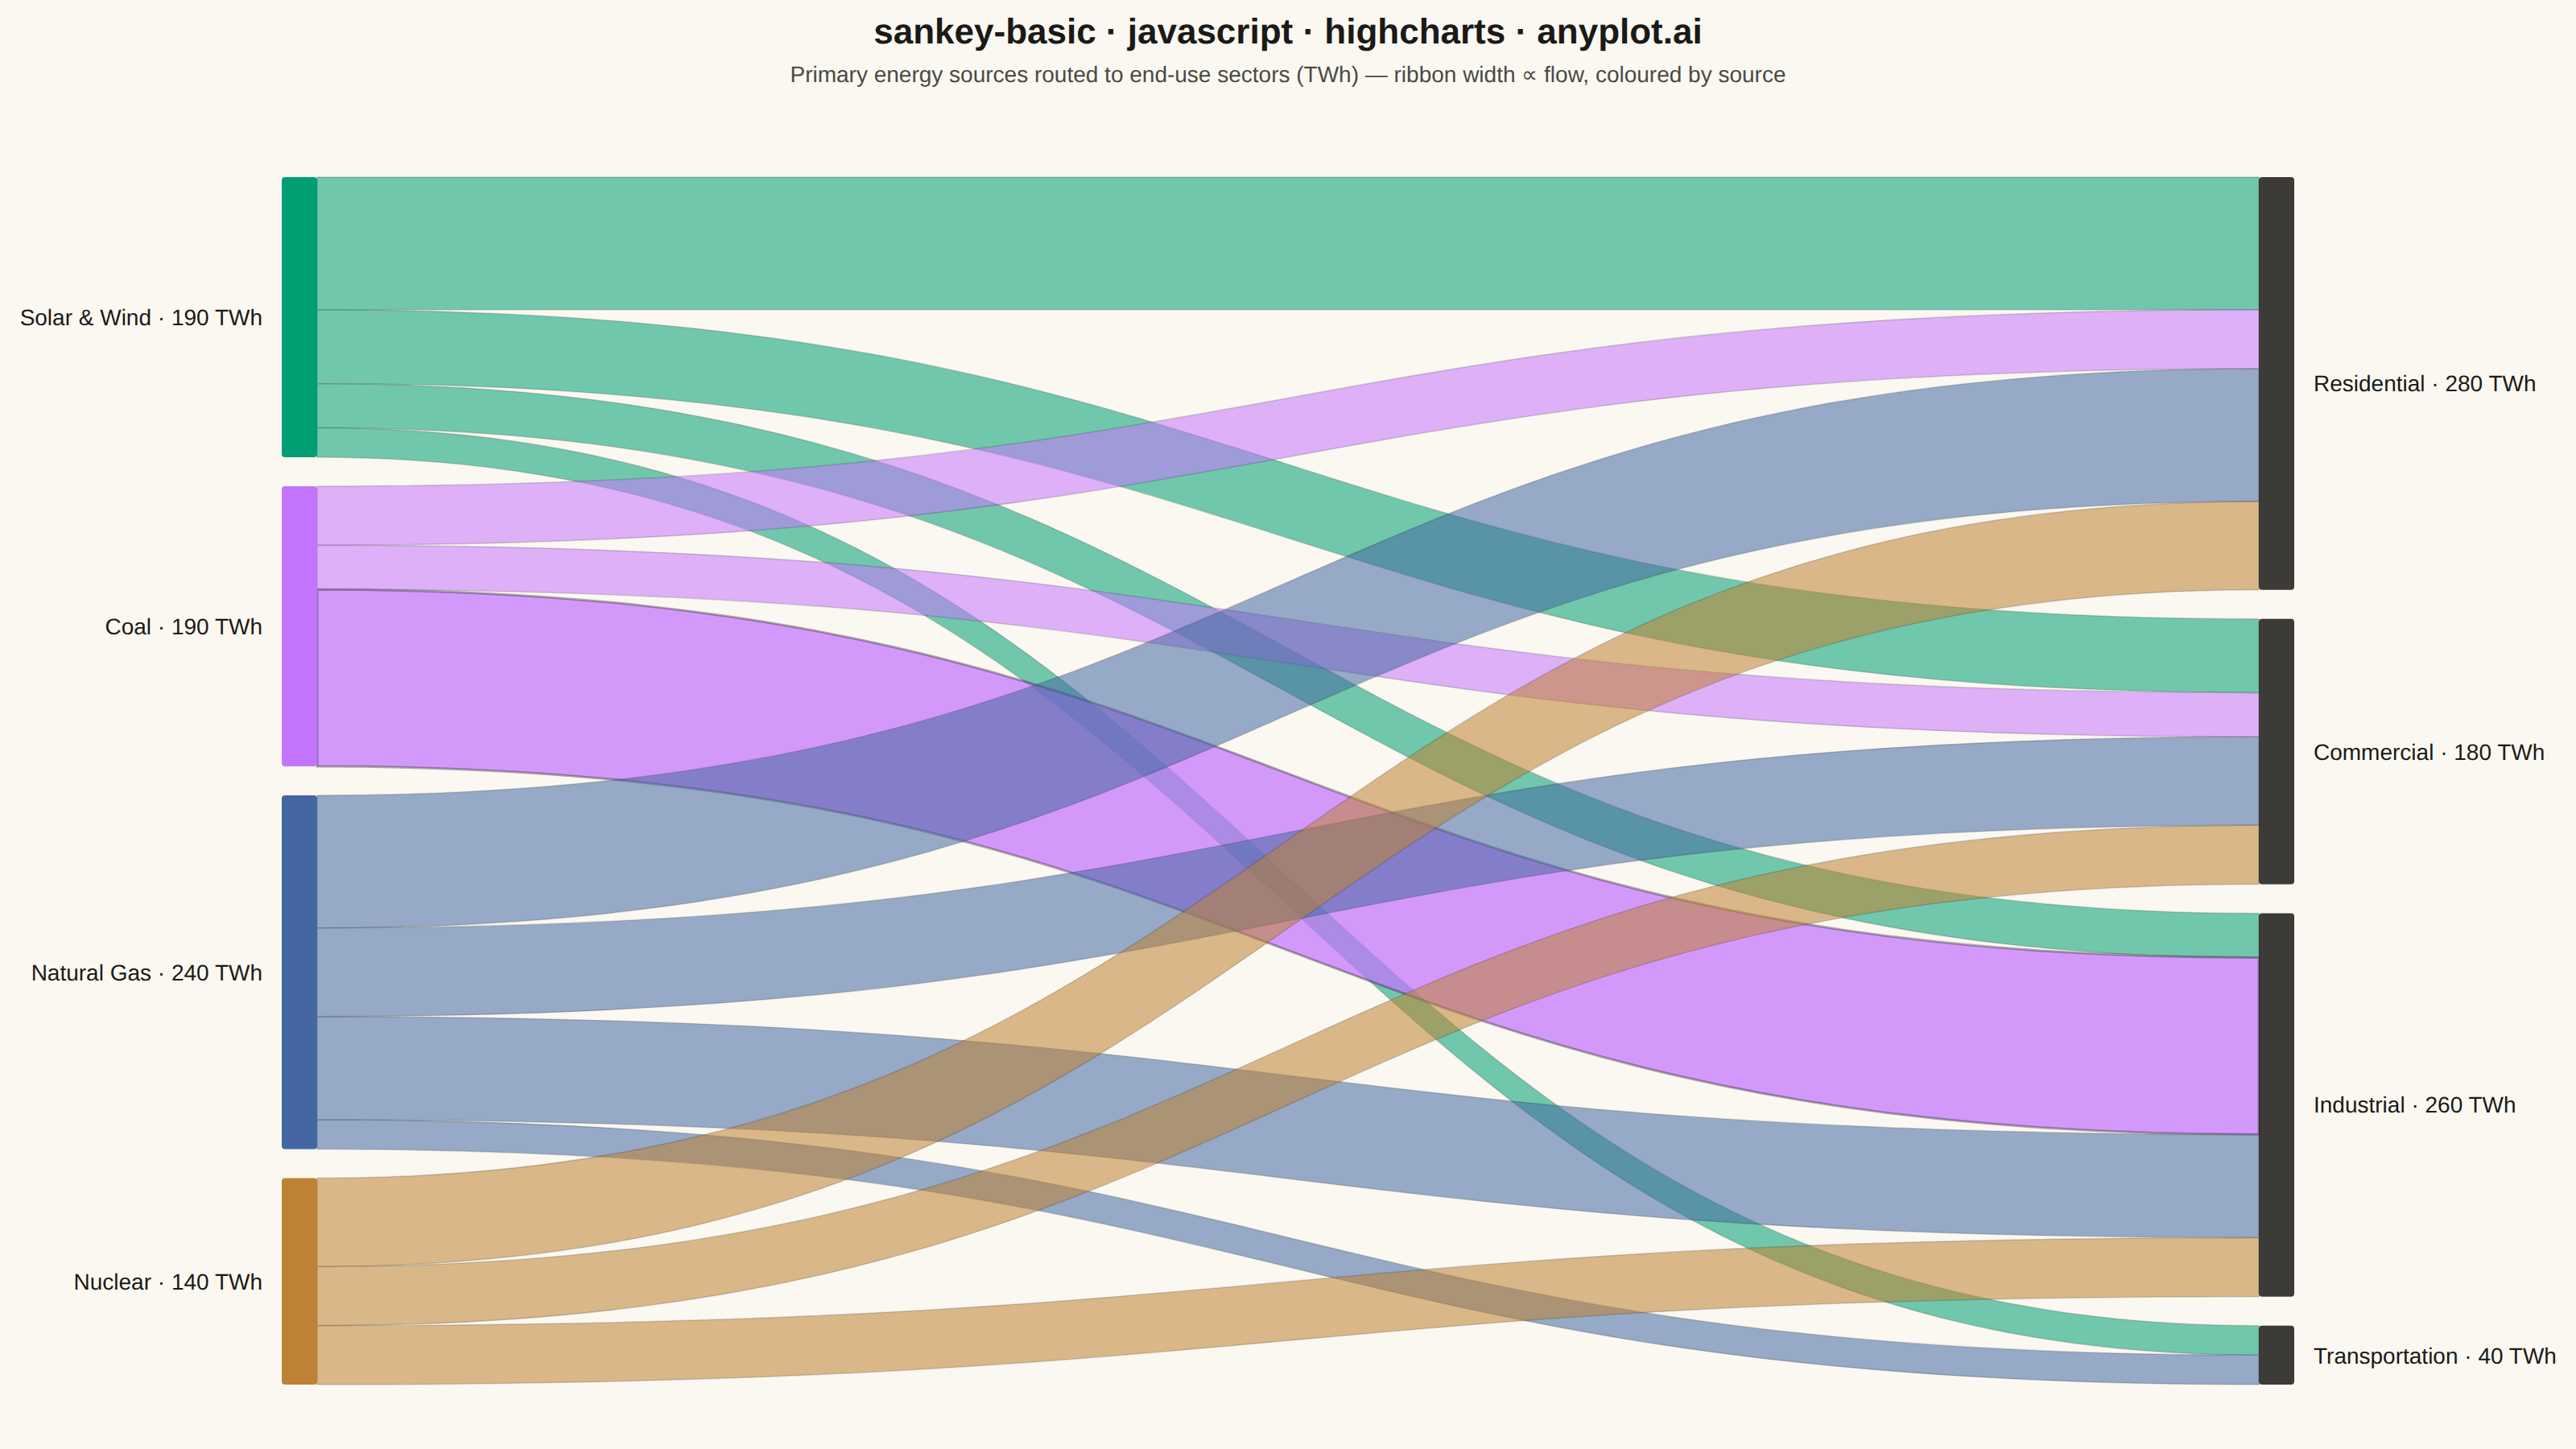
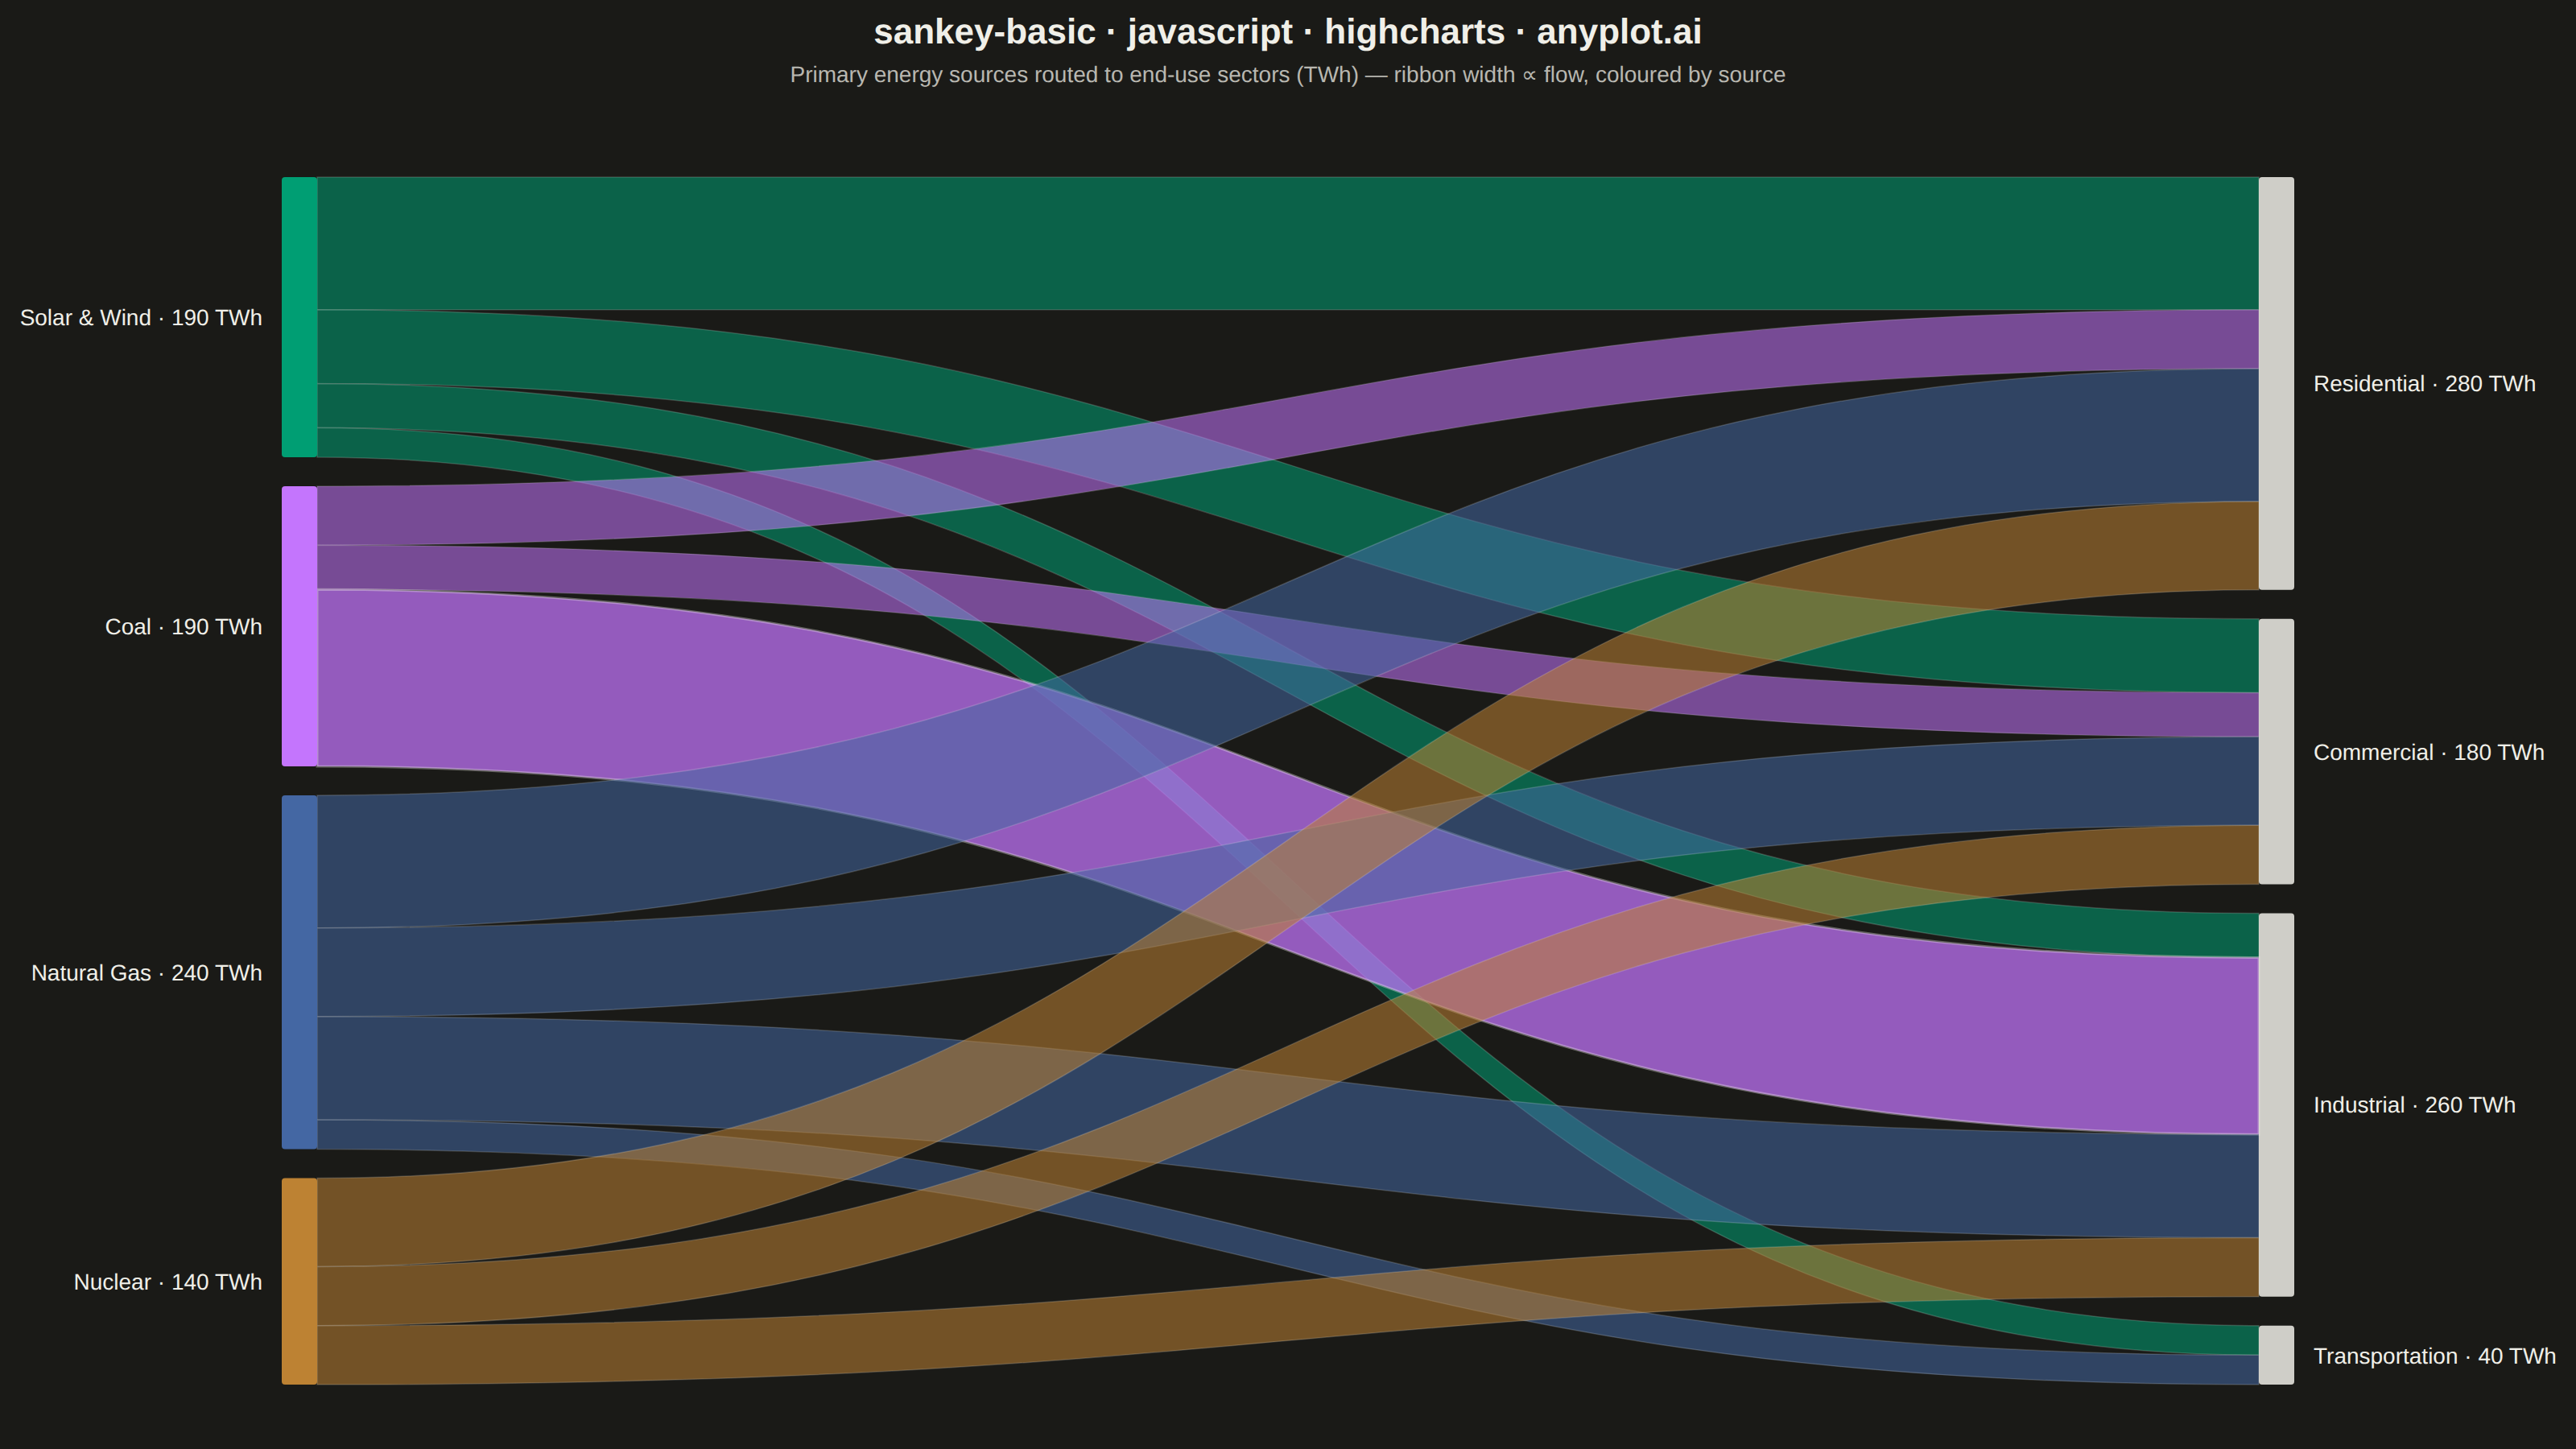
The same plot in 13 other libraries — JavaScript: D3.js, Apache ECharts, MUI X Charts; Python: Altair, Bokeh, lets-plot, Matplotlib, Plotly, plotnine, Pygal, Seaborn; R: ggplot2; Julia: Makie.jl. Compare all 14 side by side: Basic Sankey Diagram in Python, R, Julia and JavaScript.
A Sankey diagram visualizes flow or transfer between nodes using links with widths proportional to flow values. It excels at showing how quantities distribute from sources to destinations, revealing patterns in resource allocation, process flows, and system transitions. The diagram makes it easy to identify major pathways and compare relative magnitudes of different flows.
// anyplot.ai
// sankey-basic: Basic Sankey Diagram
// Library: highcharts 12.6.0 | JavaScript 22.23.1
// Quality: 90/100 | Created: 2026-07-25

// Only the core Highcharts bundle is loaded (no `sankey` module), so the
// diagram is drawn natively with `chart.renderer`: node rectangles plus
// cubic-bezier ribbons (width ∝ flow) — the same technique anyone would use
// without the add-on module. Labels sit in the outer margins, clear of every
// ribbon, so they never overlap a flow.

const t = window.ANYPLOT_TOKENS;

// --- Data: US primary energy sources routed to end-use sectors (TWh) -------
const NODES = [
  { id: "Solar & Wind", side: "source" },
  { id: "Coal", side: "source" },
  { id: "Natural Gas", side: "source" },
  { id: "Nuclear", side: "source" },
  { id: "Residential", side: "sink" },
  { id: "Commercial", side: "sink" },
  { id: "Industrial", side: "sink" },
  { id: "Transportation", side: "sink" },
];

// [source, target, value] — no circular flows, source never equals target.
const LINKS = [
  ["Solar & Wind", "Residential", 90],
  ["Solar & Wind", "Commercial", 50],
  ["Solar & Wind", "Industrial", 30],
  ["Solar & Wind", "Transportation", 20],
  ["Coal", "Residential", 40],
  ["Coal", "Commercial", 30],
  ["Coal", "Industrial", 120],
  ["Natural Gas", "Residential", 90],
  ["Natural Gas", "Commercial", 60],
  ["Natural Gas", "Industrial", 70],
  ["Natural Gas", "Transportation", 20],
  ["Nuclear", "Residential", 60],
  ["Nuclear", "Commercial", 40],
  ["Nuclear", "Industrial", 40],
];

// First categorical series is always the brand green (Imprint position 1).
// Sources get distinct hues (also the color of every link leaving them);
// sinks stay neutral ink since they aggregate multiple source colors.
const SOURCE_COLOR = {
  "Solar & Wind": t.palette[0],
  Coal: t.palette[1],
  "Natural Gas": t.palette[2],
  Nuclear: t.palette[3],
};

// --- Chart shell (no series/axes — everything below is drawn by hand) ------
const chart = Highcharts.chart("container", {
  chart: {
    backgroundColor: "transparent",
    animation: false,
    style: { fontFamily: "inherit" },
    marginTop: 110,
    marginBottom: 40,
    marginLeft: 175,
    marginRight: 175,
  },
  credits: { enabled: false },
  colors: t.palette,
  title: {
    text: "sankey-basic · javascript · highcharts · anyplot.ai",
    style: { color: t.ink, fontSize: "22px", fontWeight: "600" },
  },
  subtitle: {
    text: "Primary energy sources routed to end-use sectors (TWh) — ribbon width ∝ flow, coloured by source",
    style: { color: t.inkSoft, fontSize: "14px" },
  },
  xAxis: { visible: false },
  yAxis: { visible: false },
  legend: { enabled: false },
  plotOptions: { series: { animation: false } },
  series: [],
});

// --- Layout: two node columns, values in the plot's own pixel space --------
const nodeWidth = 22;
const gapPx = 18;
const x0Col = { source: chart.plotLeft, sink: chart.plotLeft + chart.plotWidth - nodeWidth };

const totalFor = (id) =>
  Math.max(
    LINKS.filter((l) => l[0] === id).reduce((sum, l) => sum + l[2], 0),
    LINKS.filter((l) => l[1] === id).reduce((sum, l) => sum + l[2], 0),
  );

const columns = { source: NODES.filter((n) => n.side === "source"), sink: NODES.filter((n) => n.side === "sink") };
const unitScale = Math.min(
  ...Object.values(columns).map((nodes) => {
    const colTotal = nodes.reduce((sum, n) => sum + totalFor(n.id), 0);
    return (chart.plotHeight - (nodes.length - 1) * gapPx) / colTotal;
  }),
);

const nodeById = {};
["source", "sink"].forEach((side) => {
  let cursor = chart.plotTop;
  columns[side].forEach((n) => {
    const value = totalFor(n.id);
    const height = value * unitScale;
    nodeById[n.id] = {
      ...n,
      value,
      x0: x0Col[side],
      x1: x0Col[side] + nodeWidth,
      y0: cursor,
      y1: cursor + height,
      outCursor: cursor,
      inCursor: cursor,
    };
    cursor += height + gapPx;
  });
});

// --- Draw: node rectangles, ribbons, labels ---------------------------------
const g = chart.renderer.g("sankey").add();
const f = (v) => v.toFixed(2);
const maxValue = Math.max(...LINKS.map((l) => l[2]));

// Ribbons first so the node rectangles sit cleanly on top of their ends.
// A thin ink stroke on every ribbon keeps individual flows traceable where
// several 0.55-alpha fills overlap and would otherwise blend into off-palette
// secondary hues in the crossing zone.
const ribbons = LINKS.map(([sourceId, targetId, value]) => {
  const src = nodeById[sourceId];
  const tgt = nodeById[targetId];
  const h = value * unitScale;
  const sy0 = src.outCursor;
  const sy1 = sy0 + h;
  const ty0 = tgt.inCursor;
  const ty1 = ty0 + h;
  src.outCursor = sy1;
  tgt.inCursor = ty1;

  const midX = (src.x1 + tgt.x0) / 2;
  const d =
    `M ${f(src.x1)} ${f(sy0)} C ${f(midX)} ${f(sy0)} ${f(midX)} ${f(ty0)} ${f(tgt.x0)} ${f(ty0)} ` +
    `L ${f(tgt.x0)} ${f(ty1)} C ${f(midX)} ${f(ty1)} ${f(midX)} ${f(sy1)} ${f(src.x1)} ${f(sy1)} Z`;

  // The single largest flow (Coal -> Industrial) gets a bolder stroke and a
  // touch more fill so the diagram's main point reads at a glance.
  const isDominant = value === maxValue;
  const baseOpacity = isDominant ? 0.72 : 0.55;

  const path = chart.renderer
    .path()
    .attr({
      fill: SOURCE_COLOR[sourceId],
      "fill-opacity": baseOpacity,
      stroke: t.ink,
      "stroke-width": isDominant ? 1.5 : 0.75,
      "stroke-opacity": isDominant ? 0.35 : 0.18,
    })
    .css({ cursor: "pointer" })
    .add(g);
  path.element.setAttribute("d", d);

  // Honest native tooltip for the interactive HTML view (absent from the PNG).
  const titleEl = document.createElementNS("http://www.w3.org/2000/svg", "title");
  titleEl.textContent = `${sourceId} → ${targetId}: ${value} TWh`;
  path.element.appendChild(titleEl);

  return { path, baseOpacity };
});

// Genuine hover-highlight interactivity for the HTML view: dim every other
// ribbon and bring the hovered one to full opacity, using chart.renderer's
// element-level event API (no sankey series/tooltip module available).
ribbons.forEach((ribbon) => {
  ribbon.path.on("mouseover", () => {
    ribbons.forEach((other) => {
      other.path.attr({ "fill-opacity": other === ribbon ? 1 : 0.12 });
    });
  });
  ribbon.path.on("mouseout", () => {
    ribbons.forEach((other) => other.path.attr({ "fill-opacity": other.baseOpacity }));
  });
});

NODES.forEach((n) => {
  const node = nodeById[n.id];
  const fill = n.side === "source" ? SOURCE_COLOR[n.id] : t.ink;
  chart.renderer
    .rect(node.x0, node.y0, nodeWidth, node.y1 - node.y0, 2)
    .attr({ fill, "fill-opacity": n.side === "source" ? 1 : 0.85 })
    .add(g);

  const midY = (node.y0 + node.y1) / 2;
  const label = `${n.id} · ${node.value} TWh`;
  const labelX = n.side === "source" ? node.x0 - 12 : node.x1 + 12;
  chart.renderer
    .text(label, labelX, midY + 5)
    .attr({ align: n.side === "source" ? "right" : "left" })
    .css({ color: t.ink, fontSize: "14px", fontWeight: "500" })
    .add(g);
});

// Static-frame timing signal for the harness.
window.__anyplotReady = true;
Runnable source as JSON, for any HTTP client: https://api.anyplot.ai/specs/sankey-basic/highcharts/code. Any spec id and library id listed in llms-full.txt fit the same URL shape; every URL below is complete and callable.
{
  "spec_id": "sankey-basic",
  "language": "javascript",
  "library": "highcharts",
  "page": "https://anyplot.ai/sankey-basic/javascript/highcharts",
  "hub": "https://anyplot.ai/sankey-basic",
  "code_json": "https://api.anyplot.ai/specs/sankey-basic/highcharts/code",
  "spec_json": "https://api.anyplot.ai/specs/sankey-basic",
  "render_light_png": "https://storage.googleapis.com/anyplot-images/plots/sankey-basic/javascript/highcharts/plot-light.png",
  "render_dark_png": "https://storage.googleapis.com/anyplot-images/plots/sankey-basic/javascript/highcharts/plot-dark.png",
  "interactive_light_html": "https://storage.googleapis.com/anyplot-images/plots/sankey-basic/javascript/highcharts/plot-light.html",
  "interactive_dark_html": "https://storage.googleapis.com/anyplot-images/plots/sankey-basic/javascript/highcharts/plot-dark.html",
  "quality_score": 90.0,
  "license": "MIT",
  "guide": "https://anyplot.ai/llms.txt"
}
Part of Basic Sankey Diagram on anyplot.ai.