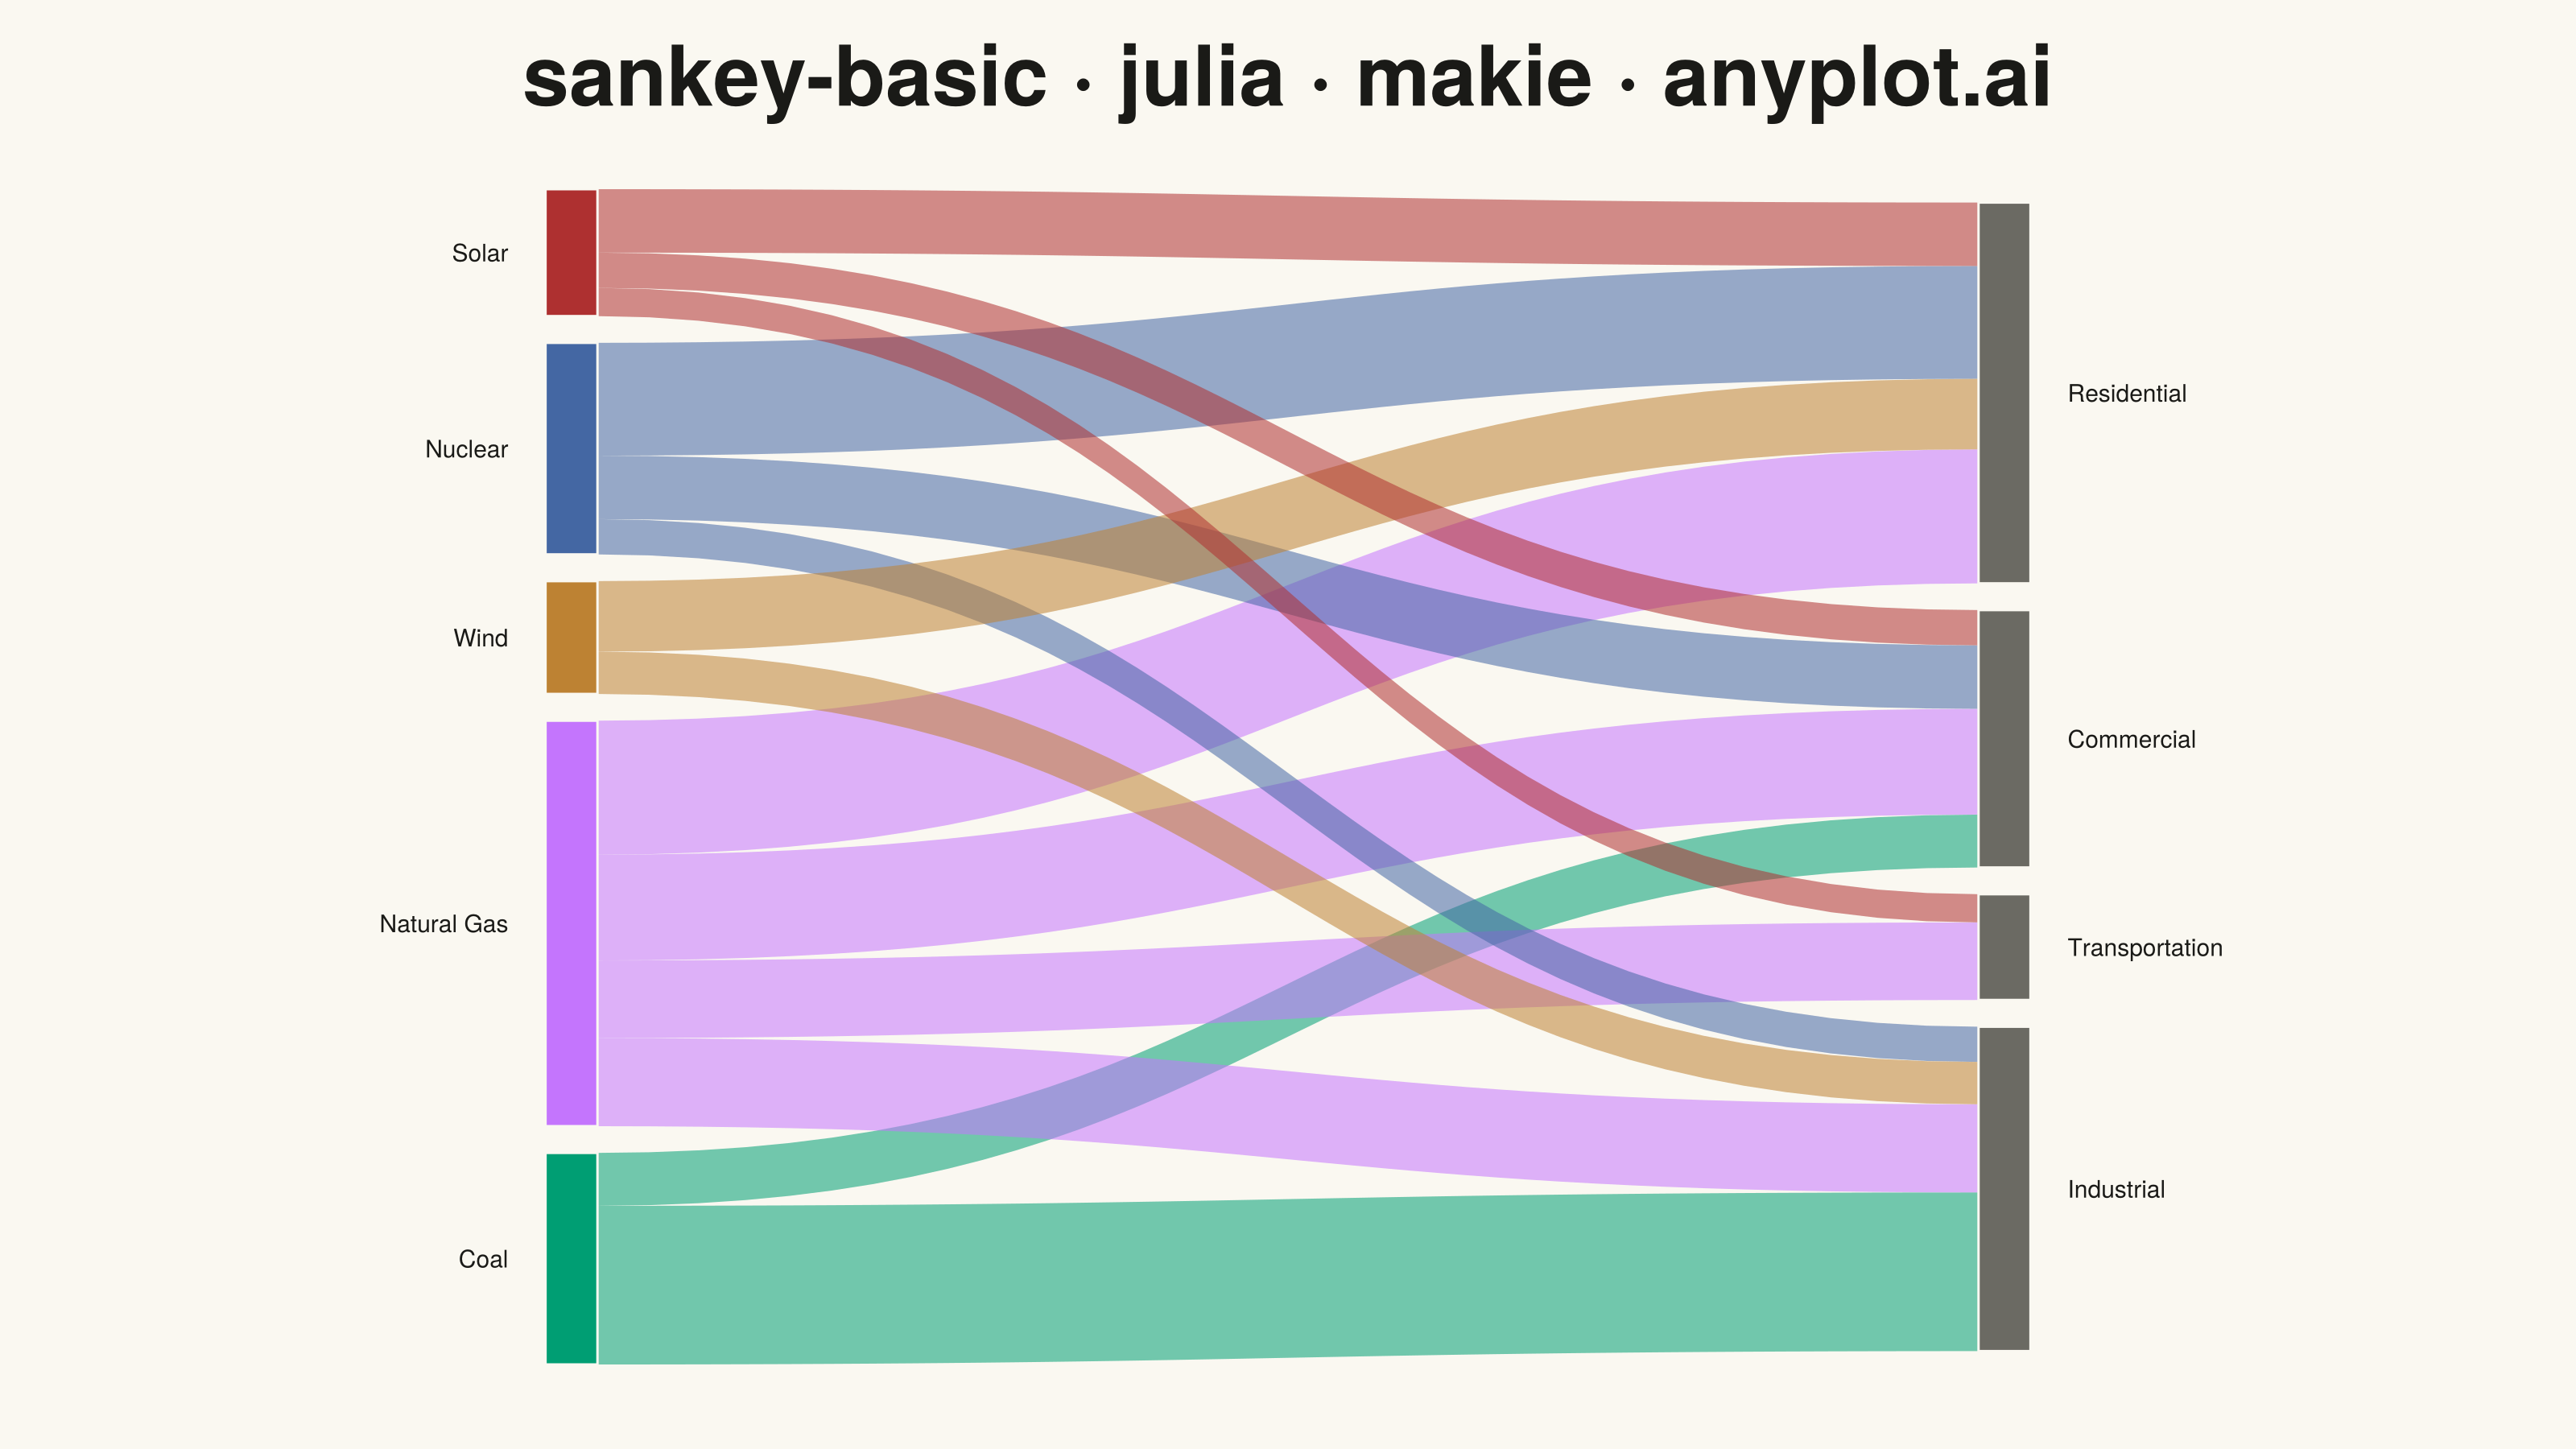
The same plot in 13 other libraries — Python: Altair, Bokeh, lets-plot, Matplotlib, Plotly, plotnine, Pygal, Seaborn; R: ggplot2; JavaScript: D3.js, Apache ECharts, Highcharts, MUI X Charts. Compare all 14 side by side: Basic Sankey Diagram in Python, R, Julia and JavaScript.
A Sankey diagram visualizes flow or transfer between nodes using links with widths proportional to flow values. It excels at showing how quantities distribute from sources to destinations, revealing patterns in resource allocation, process flows, and system transitions. The diagram makes it easy to identify major pathways and compare relative magnitudes of different flows.
# anyplot.ai
# sankey-basic: Basic Sankey Diagram
# Library: makie 0.21.9 | Julia 1.11.9
# Quality: 87/100 | Created: 2026-07-25

using CairoMakie
using Colors

# --- Theme tokens ------------------------------------------------------------
const THEME        = get(ENV, "ANYPLOT_THEME", "light")
const PAGE_BG       = THEME == "light" ? colorant"#FAF8F1" : colorant"#1A1A17"
const INK           = THEME == "light" ? colorant"#1A1A17" : colorant"#F0EFE8"
const ANYPLOT_MUTED = THEME == "light" ? colorant"#6B6A63" : colorant"#A8A79F"

const IMPRINT_PALETTE = [
    colorant"#009E73", colorant"#C475FD", colorant"#4467A3", colorant"#BD8233",
    colorant"#AE3030", colorant"#2ABCCD", colorant"#954477", colorant"#99B314",
]

# --- Data: national electricity supply routed to end-use sectors (GWh) ------
sources = ["Coal", "Natural Gas", "Nuclear", "Wind", "Solar"]
targets = ["Residential", "Commercial", "Industrial", "Transportation"]

flows = [
    ("Coal", "Industrial", 45.0), ("Coal", "Commercial", 15.0),
    ("Natural Gas", "Residential", 38.0), ("Natural Gas", "Commercial", 30.0),
    ("Natural Gas", "Industrial", 25.0), ("Natural Gas", "Transportation", 22.0),
    ("Nuclear", "Residential", 32.0), ("Nuclear", "Commercial", 18.0),
    ("Nuclear", "Industrial", 10.0),
    ("Wind", "Residential", 20.0), ("Wind", "Industrial", 12.0),
    ("Solar", "Residential", 18.0), ("Solar", "Commercial", 10.0),
    ("Solar", "Transportation", 8.0),
]

source_color = Dict(name => IMPRINT_PALETTE[i] for (i, name) in enumerate(sources))

# --- Barycenter node ordering: minimizes ribbon crossings independently of the
# palette-assignment order above (which stays fixed so Coal keeps the brand green).
function barycenter_order(names, other_order, edges; as_source::Bool)
    rank = Dict(n => i for (i, n) in enumerate(other_order))
    score(name) = begin
        pairs = as_source ? [(t, v) for (s, t, v) in edges if s == name] :
                             [(s, v) for (s, t, v) in edges if t == name]
        sum(rank[p] * v for (p, v) in pairs) / sum(v for (_, v) in pairs)
    end
    return sort(names; by = score)
end

source_order = barycenter_order(sources, targets, flows; as_source = true)
target_order = barycenter_order(targets, source_order, flows; as_source = false)
source_order = barycenter_order(sources, target_order, flows; as_source = true)

# --- Node column layout: stacked bars, gap proportional to total flow -------
gap = sum(v for (_, _, v) in flows) * 0.025

source_totals = [sum(v for (s, _, v) in flows if s == name) for name in source_order]
target_totals = [sum(v for (_, t, v) in flows if t == name) for name in target_order]

source_col_h = sum(source_totals) + gap * (length(source_order) - 1)
target_col_h = sum(target_totals) + gap * (length(target_order) - 1)
col_h = max(source_col_h, target_col_h)

source_offsets = cumsum(vcat(0.0, (source_totals .+ gap)[1:end-1]))
target_offsets = cumsum(vcat(0.0, (target_totals .+ gap)[1:end-1]))

source_top = (col_h - source_col_h) / 2 .+ (source_col_h .- source_offsets)
target_top = (col_h - target_col_h) / 2 .+ (target_col_h .- target_offsets)

source_pos = Dict(name => (top - h, top) for (name, top, h) in zip(source_order, source_top, source_totals))
target_pos = Dict(name => (top - h, top) for (name, top, h) in zip(target_order, target_top, target_totals))

# --- Per-node link segment allocation (stacked in the order of the other column)
source_seg = Dict{Tuple{String,String},Tuple{Float64,Float64}}()
for name in source_order
    outgoing = sort([(t, v) for (s, t, v) in flows if s == name],
                     by = pair -> findfirst(==(pair[1]), target_order))
    cur = source_pos[name][2]
    for (t, v) in outgoing
        source_seg[(name, t)] = (cur - v, cur)
        cur -= v
    end
end

target_seg = Dict{Tuple{String,String},Tuple{Float64,Float64}}()
for name in target_order
    incoming = sort([(s, v) for (s, t, v) in flows if t == name],
                     by = pair -> findfirst(==(pair[1]), source_order))
    cur = target_pos[name][2]
    for (s, v) in incoming
        target_seg[(s, name)] = (cur - v, cur)
        cur -= v
    end
end

# --- Figure -------------------------------------------------------------------
title_str = "sankey-basic · julia · makie · anyplot.ai"

fig = Figure(resolution = (1600, 900), fontsize = 14, backgroundcolor = PAGE_BG)

ax = Axis(
    fig[1, 1];
    title           = title_str,
    titlesize       = 52,
    titlecolor      = INK,
    backgroundcolor = PAGE_BG,
)

hidedecorations!(ax)
hidespines!(ax)

node_width = 0.35
x_right = 10.0
x0 = node_width
x1 = x_right - node_width
xm = (x0 + x1) / 2

xlims!(ax, -3.5, x_right + 3.5)
ylims!(ax, -col_h * 0.05, col_h * 1.05)

# --- Links: cubic-bezier ribbons, filled polygon between top/bottom curves --
tt = range(0.0, 1.0; length = 40)
for (s, t, v) in flows
    y0b, y0t = source_seg[(s, t)]
    y1b, y1t = target_seg[(s, t)]
    xc = @. (1 - tt)^3 * x0 + 3 * (1 - tt)^2 * tt * xm + 3 * (1 - tt) * tt^2 * xm + tt^3 * x1
    yc_top = @. (1 - tt)^3 * y0t + 3 * (1 - tt)^2 * tt * y0t + 3 * (1 - tt) * tt^2 * y1t + tt^3 * y1t
    yc_bot = @. (1 - tt)^3 * y0b + 3 * (1 - tt)^2 * tt * y0b + 3 * (1 - tt) * tt^2 * y1b + tt^3 * y1b
    ribbon = vcat(Point2f.(xc, yc_top), Point2f.(reverse(xc), reverse(yc_bot)))
    poly!(ax, ribbon; color = (source_color[s], 0.55), strokewidth = 0)
end

# --- Nodes: rectangles + direct labels ---------------------------------------
for name in source_order
    b, t = source_pos[name]
    rect = Point2f[(0.0, b), (node_width, b), (node_width, t), (0.0, t)]
    poly!(ax, rect; color = source_color[name], strokewidth = 1.5, strokecolor = PAGE_BG)
    text!(ax, -0.25, (b + t) / 2; text = name, align = (:right, :center),
          color = INK, fontsize = 15)
end

for name in target_order
    b, t = target_pos[name]
    rect = Point2f[(x_right - node_width, b), (x_right, b), (x_right, t), (x_right - node_width, t)]
    poly!(ax, rect; color = ANYPLOT_MUTED, strokewidth = 1.5, strokecolor = PAGE_BG)
    text!(ax, x_right + 0.25, (b + t) / 2; text = name, align = (:left, :center),
          color = INK, fontsize = 15)
end

# --- Save ---------------------------------------------------------------------
save("plot-$(THEME).png", fig; px_per_unit = 2)
Runnable source as JSON, for any HTTP client: https://api.anyplot.ai/specs/sankey-basic/makie/code. Any spec id and library id listed in llms-full.txt fit the same URL shape; every URL below is complete and callable.
{
  "spec_id": "sankey-basic",
  "language": "julia",
  "library": "makie",
  "page": "https://anyplot.ai/sankey-basic/julia/makie",
  "hub": "https://anyplot.ai/sankey-basic",
  "code_json": "https://api.anyplot.ai/specs/sankey-basic/makie/code",
  "spec_json": "https://api.anyplot.ai/specs/sankey-basic",
  "render_light_png": "https://storage.googleapis.com/anyplot-images/plots/sankey-basic/julia/makie/plot-light.png",
  "render_dark_png": "https://storage.googleapis.com/anyplot-images/plots/sankey-basic/julia/makie/plot-dark.png",
  "quality_score": 87.0,
  "license": "MIT",
  "guide": "https://anyplot.ai/llms.txt"
}
Part of Basic Sankey Diagram on anyplot.ai.