The same plot in 14 other libraries — JavaScript: D3.js, Apache ECharts, Highcharts, MUI X Charts; Python: Altair, Bokeh, lets-plot, Matplotlib, Plotly, plotnine, Pygal, Seaborn; R: ggplot2; Julia: Makie.jl. Compare all 15 side by side: Ashby Material Selection Chart in Python, R, Julia and JavaScript.
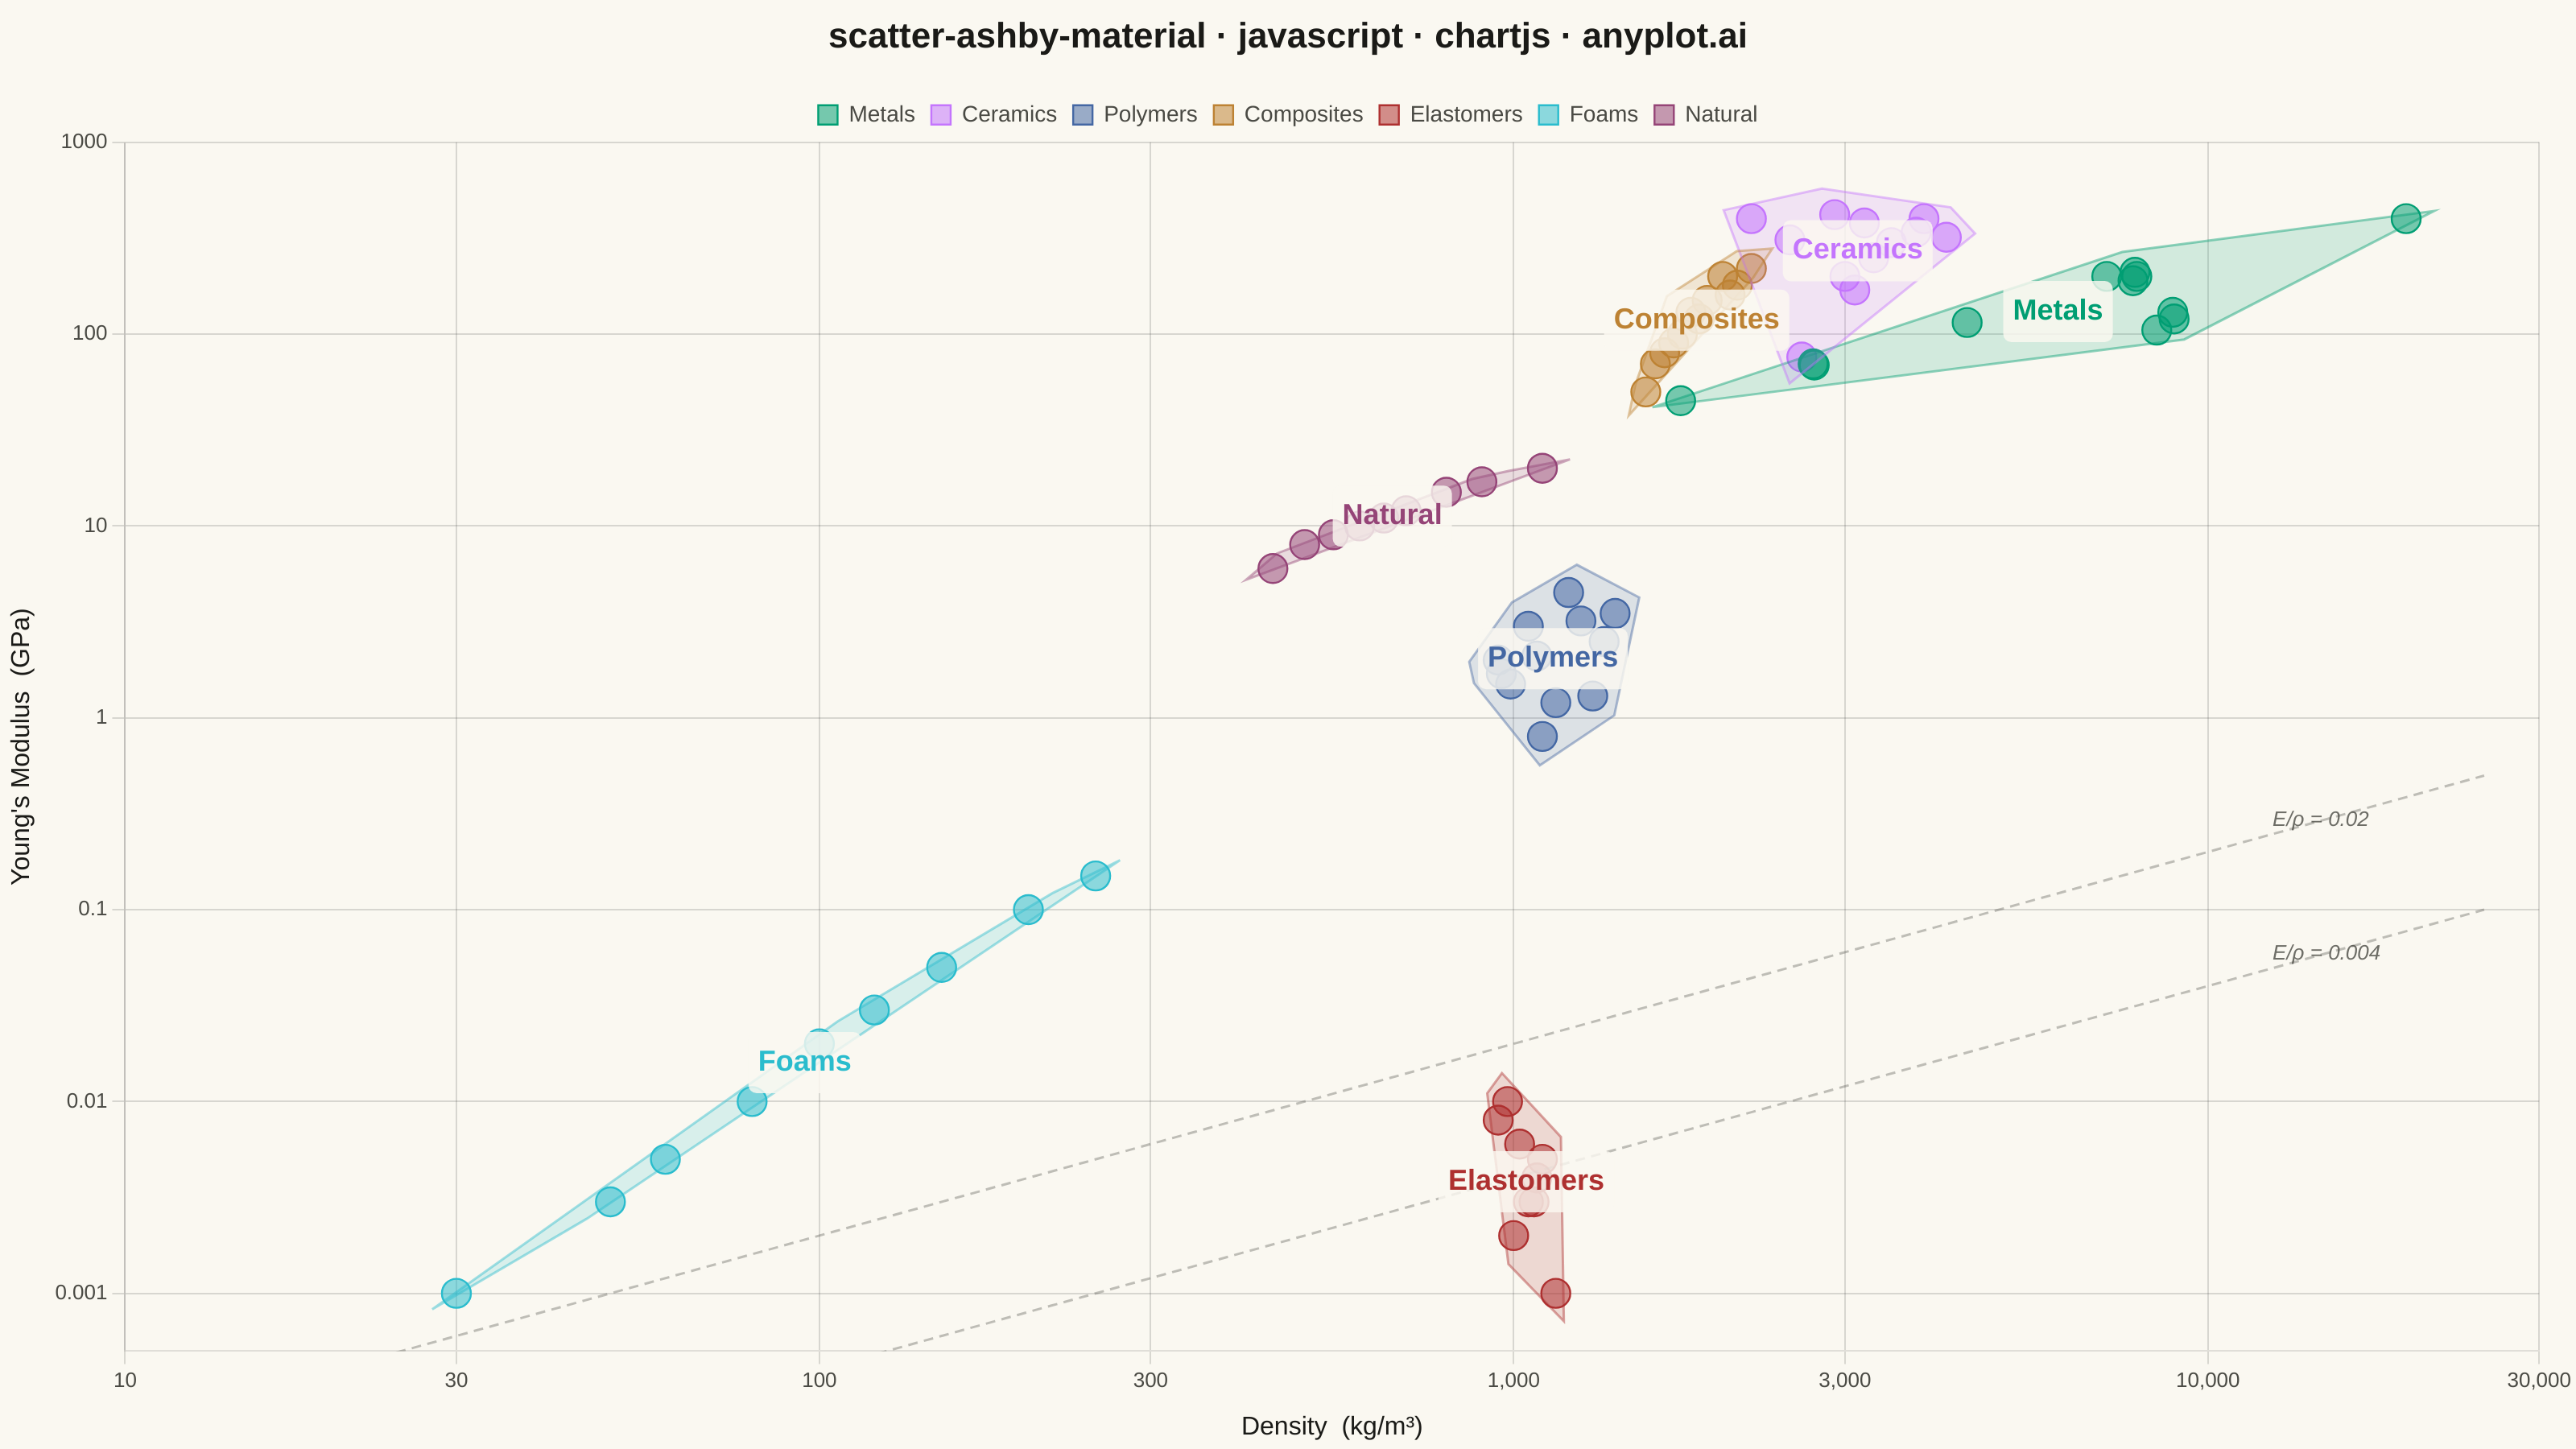
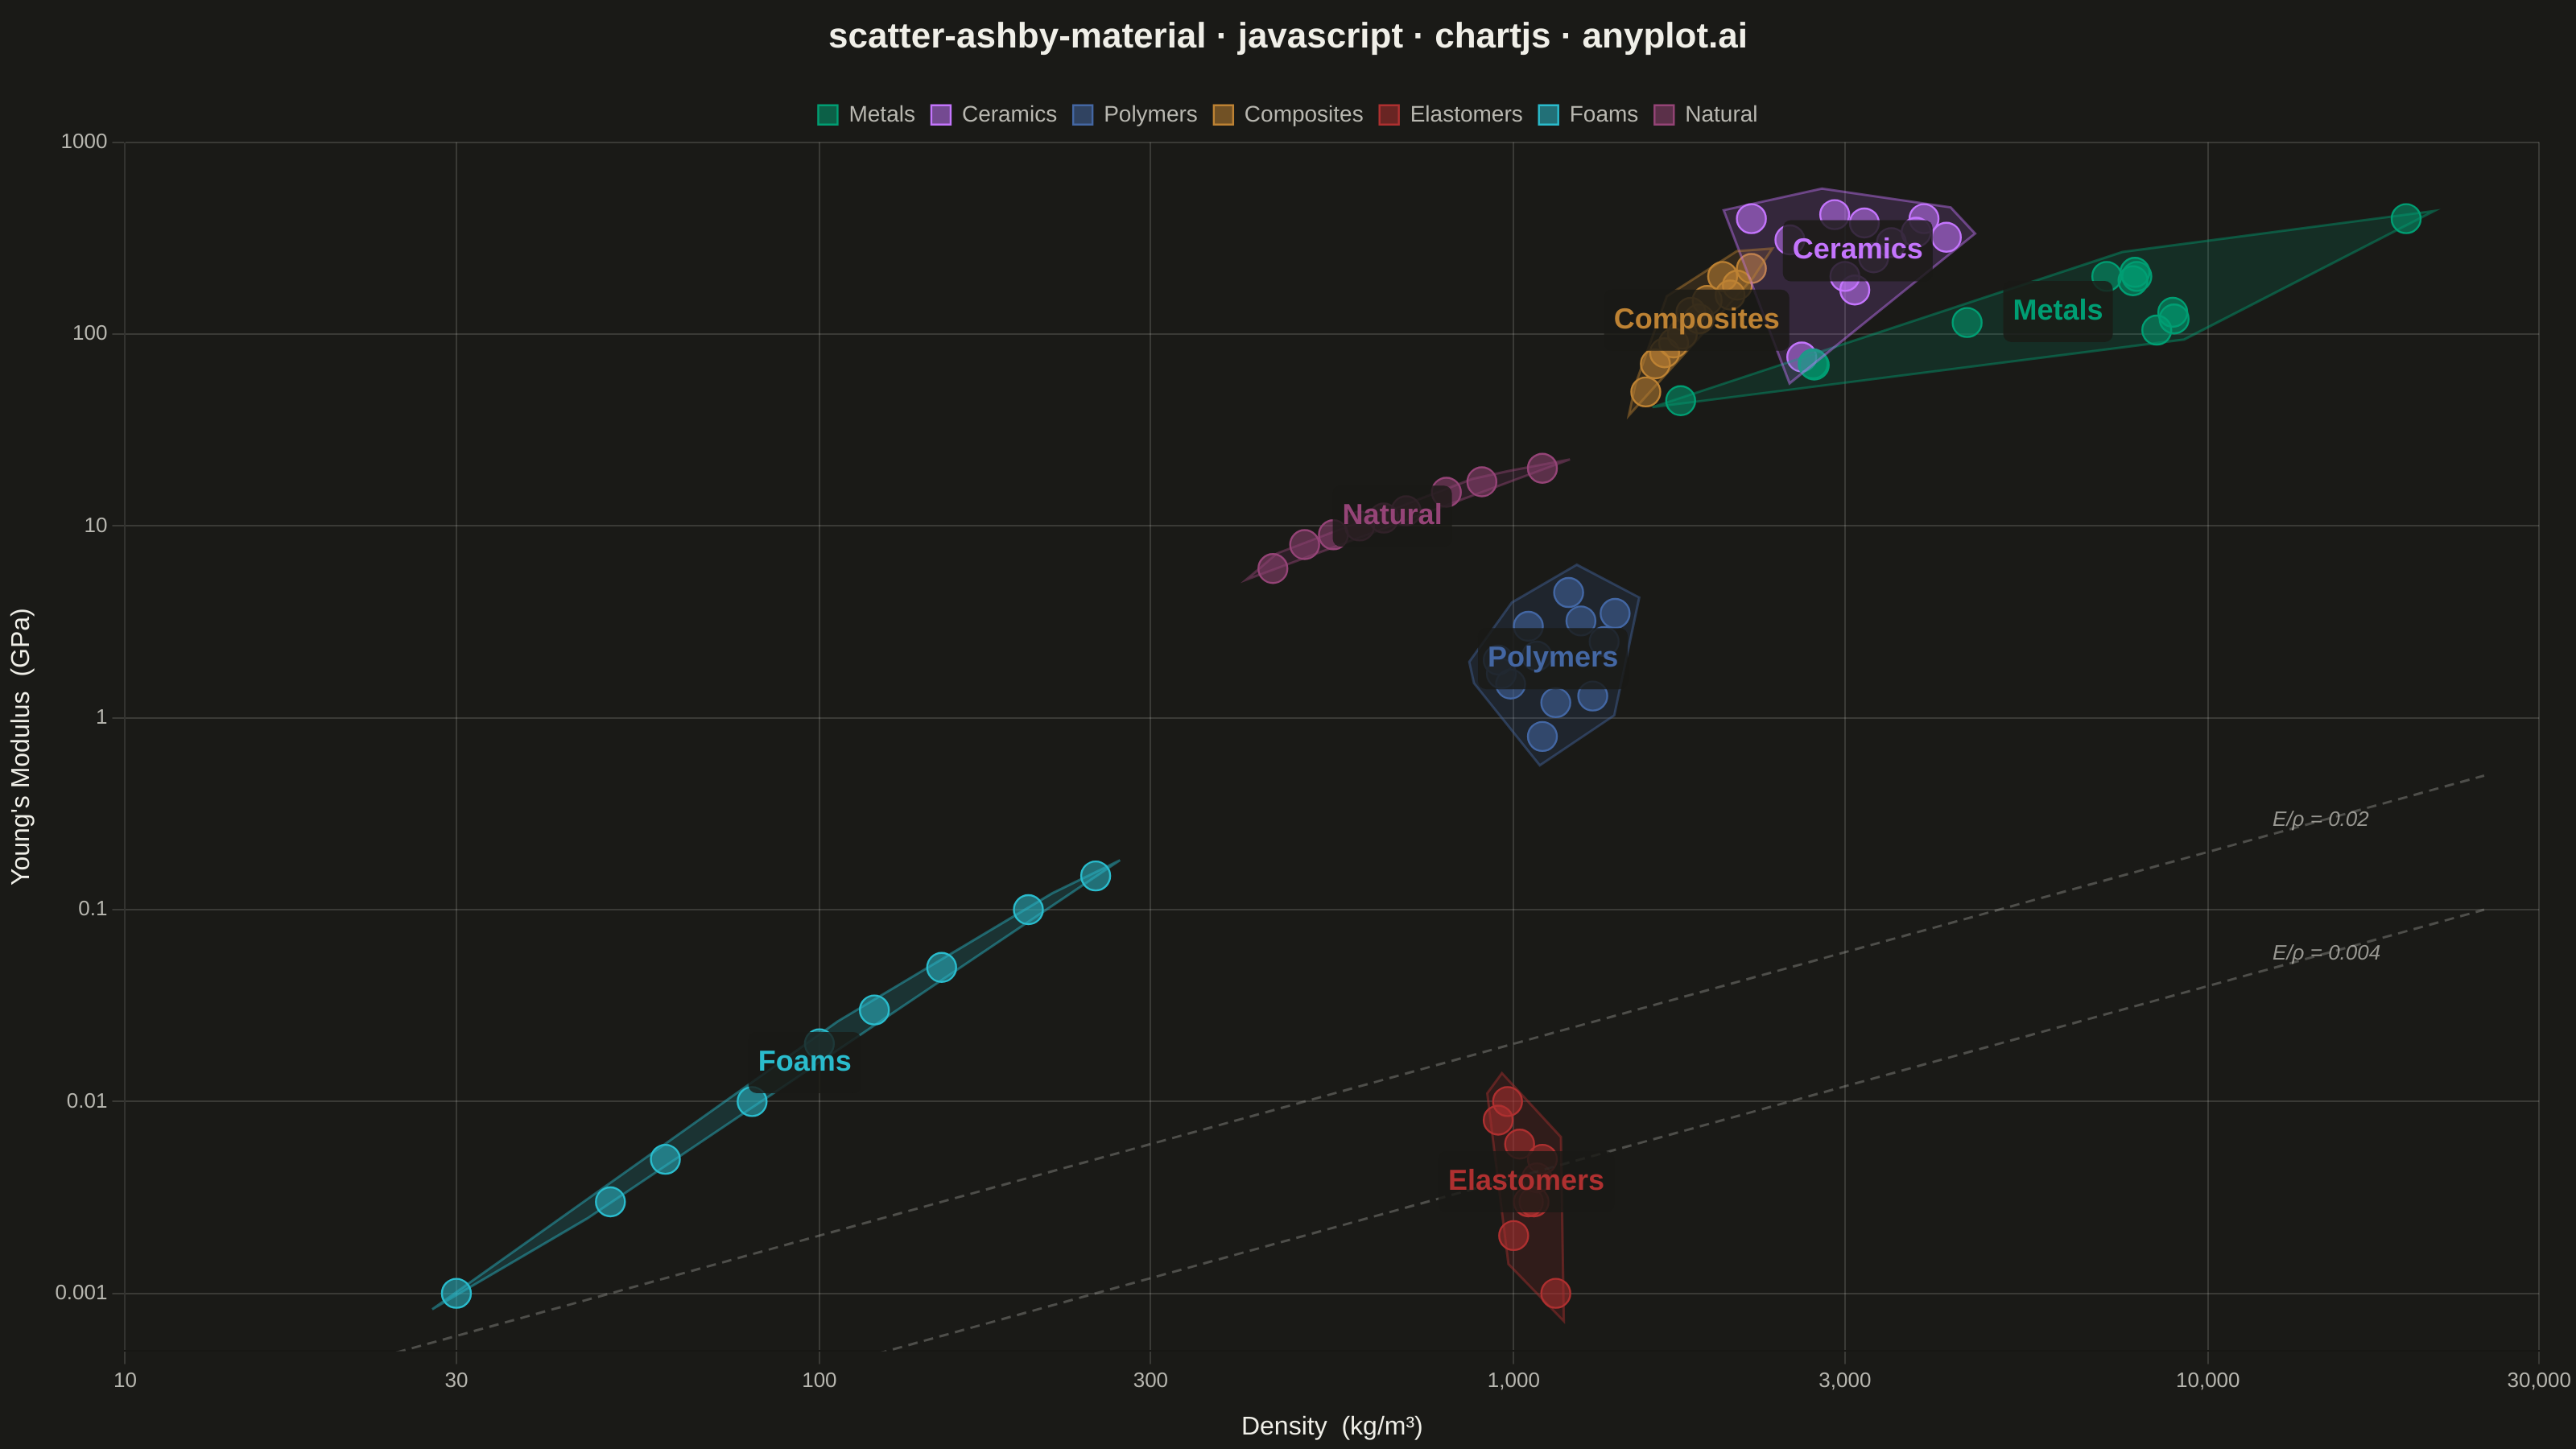
A log-log scatter plot comparing two material properties (e.g., Young's modulus vs. density) with material families displayed as labeled bubble regions. Developed by Michael Ashby for systematic material selection in engineering design, this chart enables rapid visual comparison of material classes across multiple property dimensions. It is a standard tool in materials science and mechanical engineering education.
// anyplot.ai
// scatter-ashby-material: Ashby Material Selection Chart
// Library: chartjs 4.4.7 | JavaScript 22.22.3
// Quality: 89/100 | Created: 2026-06-03

const t = window.ANYPLOT_TOKENS;

// Material data: x = density (kg/m³), y = Young's modulus (GPa)
const families = [
  {
    name: "Metals",
    color: t.palette[0],
    data: [
      { x: 7900, y: 200 }, { x: 7850, y: 210 }, { x: 7800, y: 190 },
      { x: 2700, y: 70 },  { x: 2710, y: 69 },  { x: 4500, y: 115 },
      { x: 8900, y: 130 }, { x: 8940, y: 120 }, { x: 1740, y: 45 },
      { x: 8440, y: 105 }, { x: 7150, y: 200 }, { x: 19300, y: 400 },
    ],
  },
  {
    name: "Ceramics",
    color: t.palette[1],
    data: [
      { x: 3200, y: 380 }, { x: 3500, y: 300 }, { x: 2600, y: 76 },
      { x: 3900, y: 400 }, { x: 2200, y: 400 }, { x: 3000, y: 200 },
      { x: 2500, y: 310 }, { x: 3800, y: 340 }, { x: 4200, y: 320 },
      { x: 3100, y: 170 }, { x: 2900, y: 420 }, { x: 3300, y: 250 },
    ],
  },
  {
    name: "Polymers",
    color: t.palette[2],
    data: [
      { x: 950,  y: 2.0 }, { x: 1050, y: 3.0 }, { x: 1300, y: 1.3 },
      { x: 1400, y: 3.5 }, { x: 1100, y: 0.8 }, { x: 960,  y: 1.7 },
      { x: 1200, y: 4.5 }, { x: 1350, y: 2.5 }, { x: 1150, y: 1.2 },
      { x: 1250, y: 3.2 }, { x: 1080, y: 2.1 }, { x: 990,  y: 1.5 },
    ],
  },
  {
    name: "Composites",
    color: t.palette[3],
    data: [
      { x: 1600, y: 70 },  { x: 1800, y: 130 }, { x: 2000, y: 200 },
      { x: 1750, y: 100 }, { x: 1900, y: 150 }, { x: 2100, y: 180 },
      { x: 1650, y: 80 },  { x: 1550, y: 50 },  { x: 2200, y: 220 },
      { x: 1700, y: 90 },  { x: 1850, y: 120 }, { x: 2050, y: 160 },
    ],
  },
  {
    name: "Elastomers",
    color: t.palette[4],
    data: [
      { x: 1000, y: 0.002 }, { x: 1100, y: 0.005 }, { x: 1050, y: 0.003 },
      { x: 950,  y: 0.008 }, { x: 1150, y: 0.001 }, { x: 1080, y: 0.004 },
      { x: 1020, y: 0.006 }, { x: 980,  y: 0.01  }, { x: 1070, y: 0.003 },
    ],
  },
  {
    name: "Foams",
    color: t.palette[5],
    data: [
      { x: 30,  y: 0.001 }, { x: 80,  y: 0.01  }, { x: 150, y: 0.05 },
      { x: 200, y: 0.1   }, { x: 60,  y: 0.005 }, { x: 120, y: 0.03 },
      { x: 50,  y: 0.003 }, { x: 250, y: 0.15  }, { x: 100, y: 0.02 },
    ],
  },
  {
    name: "Natural",
    color: t.palette[6],
    data: [
      { x: 600, y: 10 }, { x: 800, y: 15 }, { x: 500, y: 8 },
      { x: 700, y: 12 }, { x: 450, y: 6  }, { x: 1100, y: 20 },
      { x: 650, y: 11 }, { x: 900, y: 17 }, { x: 550, y: 9  },
    ],
  },
];

// Log-centroid for label placement
function logCentroid(pts) {
  const lx = pts.map(p => Math.log10(p.x));
  const ly = pts.map(p => Math.log10(p.y));
  return {
    x: Math.pow(10, lx.reduce((a, b) => a + b, 0) / lx.length),
    y: Math.pow(10, ly.reduce((a, b) => a + b, 0) / ly.length),
  };
}

// Guide line: E/ρ = k → E = k·ρ (lightweight stiffness index, slope=1 on log-log)
function guideLineData(k, xMin, xMax, steps) {
  const result = [];
  const logMin = Math.log10(xMin);
  const logMax = Math.log10(xMax);
  for (let i = 0; i <= steps; i++) {
    const logX = logMin + (i / steps) * (logMax - logMin);
    const x = Math.pow(10, logX);
    result.push({ x, y: k * x / 1000 }); // k in GPa·m³/kg, x in kg/m³ → y in GPa
  }
  return result;
}

// Andrew's monotone chain — convex hull of pixel-space points
function convexHull(pts) {
  if (pts.length < 3) return pts.slice();
  function cross(o, a, b) {
    return (a.x - o.x) * (b.y - o.y) - (a.y - o.y) * (b.x - o.x);
  }
  const sorted = pts.slice().sort((a, b) => a.x - b.x || a.y - b.y);
  const lower = [];
  for (const p of sorted) {
    while (lower.length >= 2 && cross(lower[lower.length - 2], lower[lower.length - 1], p) <= 0) lower.pop();
    lower.push(p);
  }
  const upper = [];
  for (let i = sorted.length - 1; i >= 0; i--) {
    const p = sorted[i];
    while (upper.length >= 2 && cross(upper[upper.length - 2], upper[upper.length - 1], p) <= 0) upper.pop();
    upper.push(p);
  }
  lower.pop();
  upper.pop();
  return lower.concat(upper);
}

// Expand hull outward from centroid by `margin` pixels for visual padding
function expandHull(hull, cx, cy, margin) {
  return hull.map(p => {
    const dx = p.x - cx;
    const dy = p.y - cy;
    const dist = Math.sqrt(dx * dx + dy * dy) || 1;
    return { x: p.x + (dx / dist) * margin, y: p.y + (dy / dist) * margin };
  });
}

// Plugin: convex-hull envelopes + family labels + guide-line annotations
const familyLabelPlugin = {
  id: "familyLabels",
  afterDatasetsDraw(chart) {
    const ctx = chart.ctx;
    const xScale = chart.scales.x;
    const yScale = chart.scales.y;

    // 1. Draw convex-hull filled regions behind labels
    families.forEach(family => {
      const pixelPts = family.data.map(p => ({
        x: xScale.getPixelForValue(p.x),
        y: yScale.getPixelForValue(p.y),
      }));
      const hull = convexHull(pixelPts);
      if (hull.length < 2) return;

      // Centroid of hull for expansion
      const cx = hull.reduce((s, p) => s + p.x, 0) / hull.length;
      const cy = hull.reduce((s, p) => s + p.y, 0) / hull.length;
      const expanded = expandHull(hull, cx, cy, 18);

      ctx.save();
      ctx.beginPath();
      ctx.moveTo(expanded[0].x, expanded[0].y);
      for (let i = 1; i < expanded.length; i++) ctx.lineTo(expanded[i].x, expanded[i].y);
      ctx.closePath();
      ctx.fillStyle = family.color + "28"; // ~16% opacity fill
      ctx.strokeStyle = family.color + "70"; // ~44% opacity border
      ctx.lineWidth = 1.5;
      ctx.fill();
      ctx.stroke();
      ctx.restore();
    });

    // 2. Draw family name pills at log-centroids
    families.forEach(family => {
      const c = logCentroid(family.data);
      const px = xScale.getPixelForValue(c.x);
      const py = yScale.getPixelForValue(c.y);

      ctx.save();
      ctx.font = "bold 18px sans-serif";
      const metrics = ctx.measureText(family.name);
      const pad = 6;
      const bw = metrics.width + pad * 2;
      const bh = 26 + pad * 2;

      ctx.fillStyle = t.pageBg + "D0";
      ctx.beginPath();
      ctx.roundRect(px - bw / 2, py - bh / 2, bw, bh, 5);
      ctx.fill();

      ctx.fillStyle = family.color;
      ctx.textAlign = "center";
      ctx.textBaseline = "middle";
      ctx.fillText(family.name, px, py);
      ctx.restore();
    });

    // 3. Label the E/ρ guide lines at a mid-right anchor
    const labelDataX = 12000;
    const glPx = xScale.getPixelForValue(labelDataX);
    const gl1Py = yScale.getPixelForValue(0.02 * labelDataX / 1000);
    const gl2Py = yScale.getPixelForValue(0.004 * labelDataX / 1000);

    ctx.save();
    ctx.font = "italic 13px sans-serif";
    ctx.fillStyle = t.inkSoft + "CC";
    ctx.textAlign = "left";
    ctx.textBaseline = "bottom";
    ctx.fillText("E/ρ = 0.02", glPx + 6, gl1Py - 4);
    ctx.fillText("E/ρ = 0.004", glPx + 6, gl2Py - 4);
    ctx.restore();
  },
};

// --- Mount ---
const canvas = document.createElement("canvas");
document.getElementById("container").appendChild(canvas);

// Performance guide lines (E/ρ = const, two levels)
const guideLine1 = guideLineData(0.02, 20, 25000, 60);
const guideLine2 = guideLineData(0.004, 20, 25000, 60);
const guideColor = t.inkSoft + "55";

// --- Chart ---
new Chart(canvas, {
  type: "scatter",
  plugins: [familyLabelPlugin],
  data: {
    datasets: [
      // Guide lines (drawn first, behind family data)
      {
        type: "line",
        label: "E/ρ guide",
        data: guideLine1,
        borderColor: guideColor,
        borderWidth: 1.5,
        borderDash: [6, 4],
        pointRadius: 0,
        fill: false,
        showLine: true,
        tension: 0,
        parsing: false,
      },
      {
        type: "line",
        label: "_guide2",
        data: guideLine2,
        borderColor: guideColor,
        borderWidth: 1.5,
        borderDash: [6, 4],
        pointRadius: 0,
        fill: false,
        showLine: true,
        tension: 0,
        parsing: false,
      },
      // Family scatter datasets
      ...families.map(fam => ({
        label: fam.name,
        data: fam.data,
        backgroundColor: fam.color + "88",
        borderColor: fam.color,
        borderWidth: 1.2,
        pointRadius: 9,
        pointHoverRadius: 11,
        parsing: false,
      })),
    ],
  },
  options: {
    responsive: true,
    maintainAspectRatio: false,
    animation: false,
    plugins: {
      title: {
        display: true,
        text: "scatter-ashby-material · javascript · chartjs · anyplot.ai",
        color: t.ink,
        font: { size: 22, weight: "bold" },
        padding: { top: 10, bottom: 18 },
      },
      legend: {
        display: true,
        labels: {
          color: t.inkSoft,
          font: { size: 14 },
          boxWidth: 12,
          boxHeight: 12,
          filter: item => !item.text.startsWith("_") && item.text !== "E/ρ guide",
        },
      },
      tooltip: {
        callbacks: {
          label: ctx => `${ctx.dataset.label}: ρ=${ctx.parsed.x.toLocaleString()} kg/m³, E=${ctx.parsed.y} GPa`,
        },
      },
    },
    scales: {
      x: {
        type: "logarithmic",
        min: 10,
        max: 30000,
        title: {
          display: true,
          text: "Density  (kg/m³)",
          color: t.ink,
          font: { size: 16, weight: "500" },
          padding: { top: 8 },
        },
        ticks: {
          color: t.inkSoft,
          font: { size: 13 },
          maxTicksLimit: 8,
          callback: v => {
            const nice = [10, 30, 100, 300, 1000, 3000, 10000, 30000];
            return nice.includes(v) ? v.toLocaleString() : null;
          },
        },
        grid: { color: t.grid },
      },
      y: {
        type: "logarithmic",
        min: 0.0005,
        max: 1000,
        title: {
          display: true,
          text: "Young's Modulus  (GPa)",
          color: t.ink,
          font: { size: 16, weight: "500" },
          padding: { bottom: 8 },
        },
        ticks: {
          color: t.inkSoft,
          font: { size: 13 },
          maxTicksLimit: 8,
          callback: v => {
            const nice = [0.001, 0.01, 0.1, 1, 10, 100, 1000];
            return nice.includes(v) ? v : null;
          },
        },
        grid: { color: t.grid },
      },
    },
  },
});
Runnable source as JSON, for any HTTP client: https://api.anyplot.ai/specs/scatter-ashby-material/chartjs/code. Any spec id and library id listed in llms-full.txt fit the same URL shape; every URL below is complete and callable.
{
  "spec_id": "scatter-ashby-material",
  "language": "javascript",
  "library": "chartjs",
  "page": "https://anyplot.ai/scatter-ashby-material/javascript/chartjs",
  "hub": "https://anyplot.ai/scatter-ashby-material",
  "code_json": "https://api.anyplot.ai/specs/scatter-ashby-material/chartjs/code",
  "spec_json": "https://api.anyplot.ai/specs/scatter-ashby-material",
  "render_light_png": "https://storage.googleapis.com/anyplot-images/plots/scatter-ashby-material/javascript/chartjs/plot-light.png",
  "render_dark_png": "https://storage.googleapis.com/anyplot-images/plots/scatter-ashby-material/javascript/chartjs/plot-dark.png",
  "interactive_light_html": "https://storage.googleapis.com/anyplot-images/plots/scatter-ashby-material/javascript/chartjs/plot-light.html",
  "interactive_dark_html": "https://storage.googleapis.com/anyplot-images/plots/scatter-ashby-material/javascript/chartjs/plot-dark.html",
  "quality_score": 89.0,
  "license": "MIT",
  "guide": "https://anyplot.ai/llms.txt"
}
Part of Ashby Material Selection Chart on anyplot.ai.