The same plot in 14 other libraries — JavaScript: Chart.js, D3.js, Highcharts, MUI X Charts; Python: Altair, Bokeh, lets-plot, Matplotlib, Plotly, plotnine, Pygal, Seaborn; R: ggplot2; Julia: Makie.jl. Compare all 15 side by side: Ashby Material Selection Chart in Python, R, Julia and JavaScript.
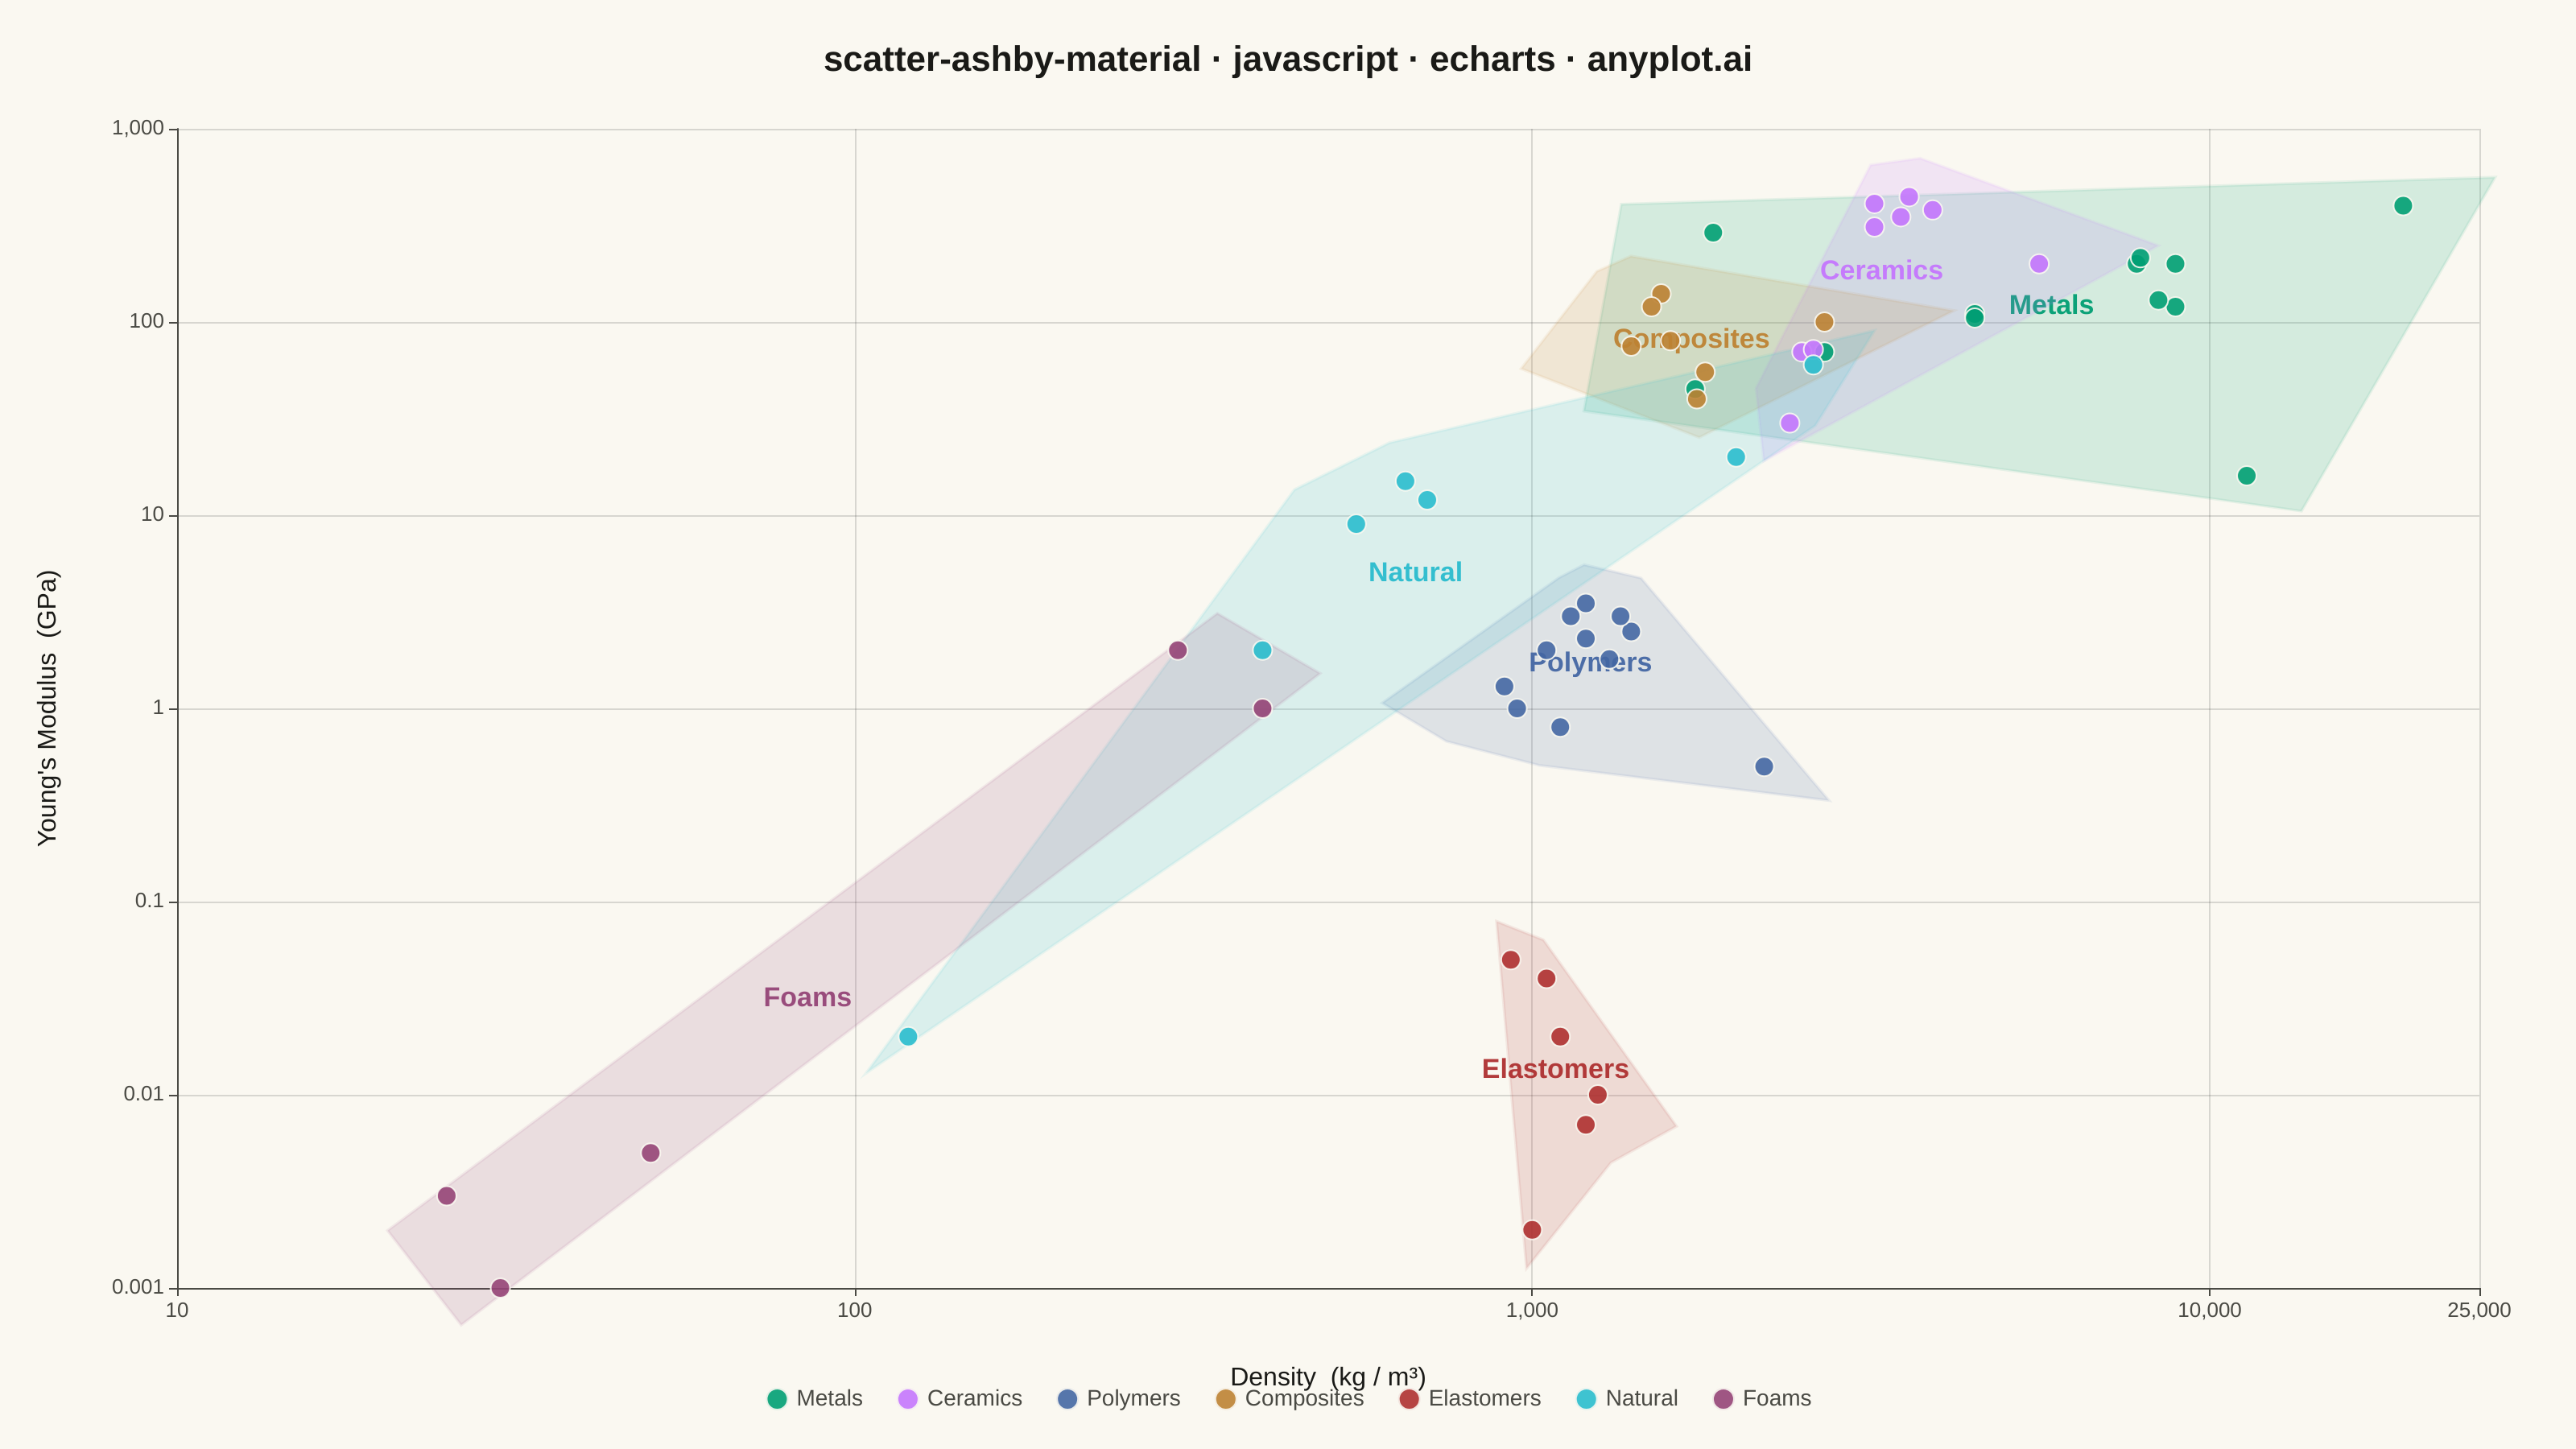
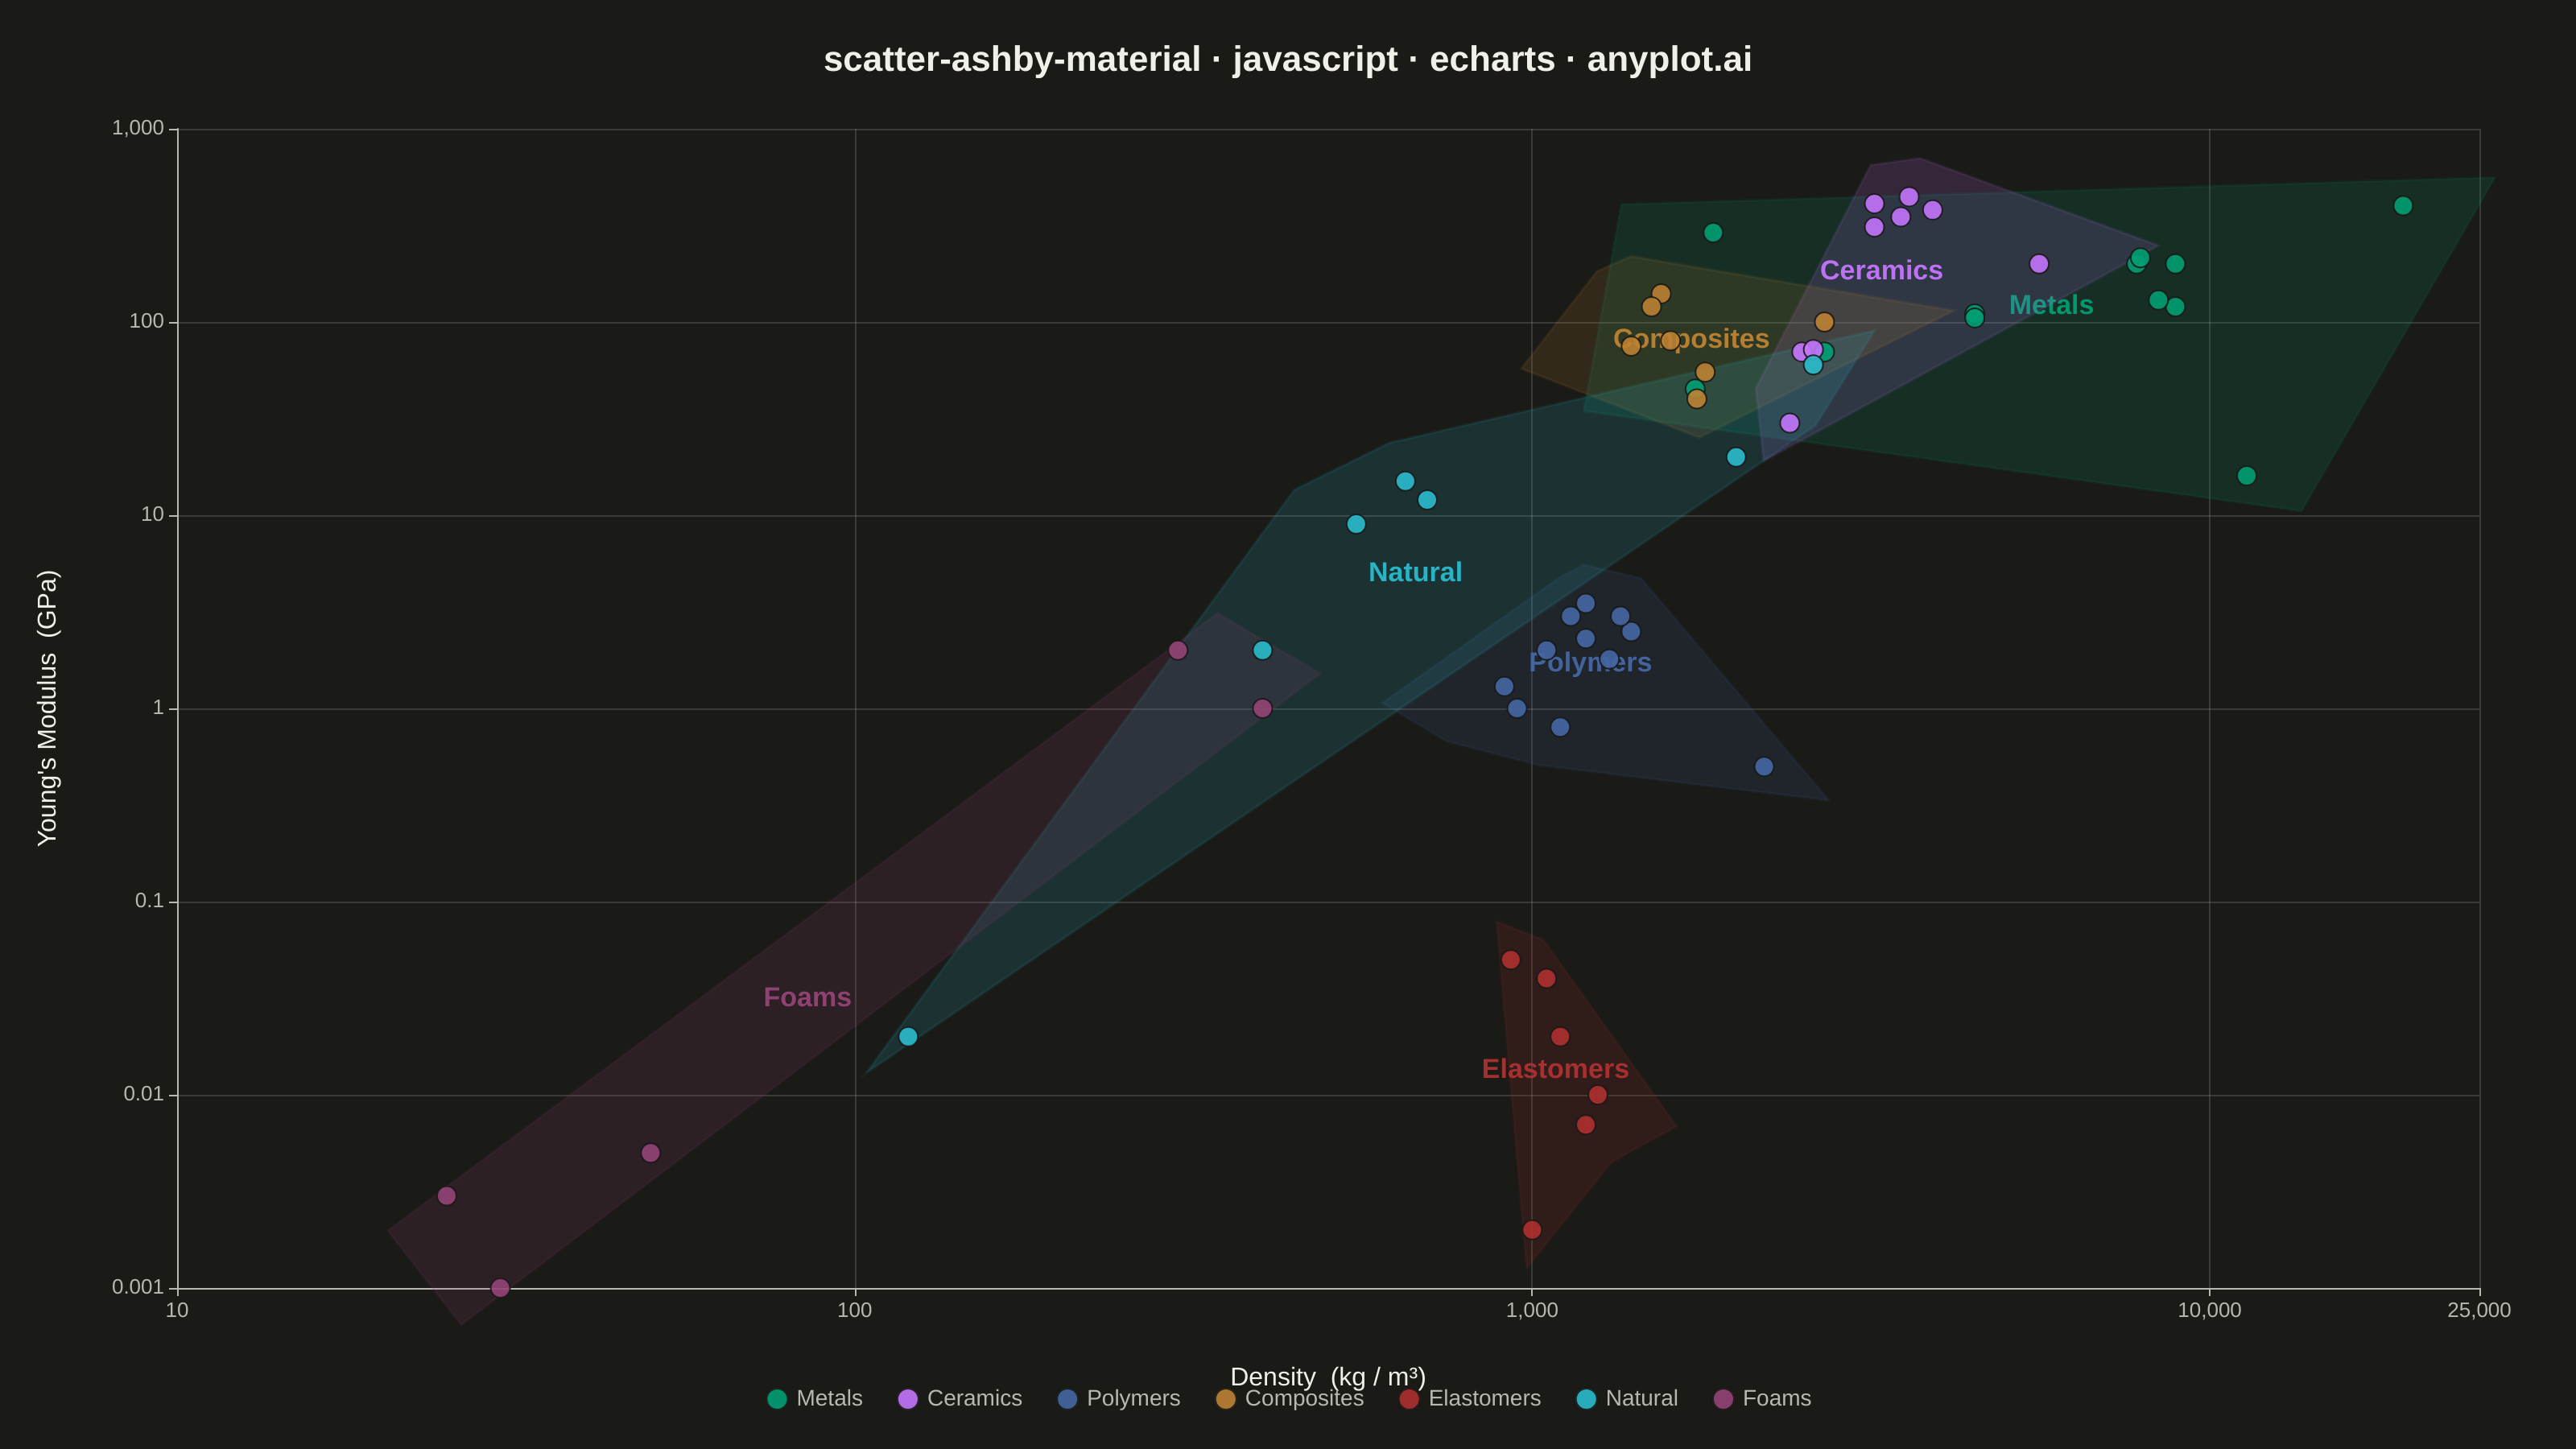
A log-log scatter plot comparing two material properties (e.g., Young's modulus vs. density) with material families displayed as labeled bubble regions. Developed by Michael Ashby for systematic material selection in engineering design, this chart enables rapid visual comparison of material classes across multiple property dimensions. It is a standard tool in materials science and mechanical engineering education.
// anyplot.ai
// scatter-ashby-material: Ashby Material Selection Chart
// Library: echarts 5.5.1 | JavaScript 22.22.3
// Quality: 90/100 | Created: 2026-06-03

//# anyplot-orientation: landscape

const t = window.ANYPLOT_TOKENS;

// Build a padded convex hull in log–log space; return linear-space coordinates
function buildPaddedHull(linPts, padLog) {
  const log = linPts.map(p => [Math.log10(p[0]), Math.log10(p[1])]);
  const s = log.slice().sort((a, b) => a[0] - b[0] || a[1] - b[1]);
  const cross = (O, A, B) => (A[0] - O[0]) * (B[1] - O[1]) - (A[1] - O[1]) * (B[0] - O[0]);
  const lower = [];
  for (const p of s) {
    while (lower.length >= 2 && cross(lower[lower.length - 2], lower[lower.length - 1], p) <= 0) lower.pop();
    lower.push(p);
  }
  const upper = [];
  for (let i = s.length - 1; i >= 0; i--) {
    const p = s[i];
    while (upper.length >= 2 && cross(upper[upper.length - 2], upper[upper.length - 1], p) <= 0) upper.pop();
    upper.push(p);
  }
  lower.pop(); upper.pop();
  let hull = lower.concat(upper);
  if (hull.length < 3) {
    const cx = log.reduce((s, p) => s + p[0], 0) / log.length;
    const cy = log.reduce((s, p) => s + p[1], 0) / log.length;
    hull = [
      [cx - padLog, cy - padLog], [cx + padLog, cy - padLog],
      [cx + padLog, cy + padLog], [cx - padLog, cy + padLog],
    ];
  }
  const hcx = hull.reduce((s, p) => s + p[0], 0) / hull.length;
  const hcy = hull.reduce((s, p) => s + p[1], 0) / hull.length;
  return hull.map(p => {
    const dx = p[0] - hcx, dy = p[1] - hcy;
    const d = Math.hypot(dx, dy) || 0.001;
    return [Math.pow(10, p[0] + (dx / d) * padLog), Math.pow(10, p[1] + (dy / d) * padLog)];
  });
}

// --- Material data: [family_idx, density_kg_m3, youngs_modulus_GPa] ---------
const FAMILIES = [
  { name: "Metals",     color: t.palette[0] },
  { name: "Ceramics",   color: t.palette[1] },
  { name: "Polymers",   color: t.palette[2] },
  { name: "Composites", color: t.palette[3] },
  { name: "Elastomers", color: t.palette[4] },
  { name: "Natural",    color: t.palette[5] },
  { name: "Foams",      color: t.palette[6] },
];

const POINTS = [
  // Metals
  [0,  2700,  70],  // Aluminium alloys
  [0,  7800, 200],  // Steels
  [0,  4500, 110],  // Titanium alloys
  [0,  8900, 120],  // Copper alloys
  [0,  8900, 200],  // Nickel alloys
  [0,  1740,  45],  // Magnesium alloys
  [0, 11340,  16],  // Lead alloys
  [0,  1850, 290],  // Beryllium
  [0,  7900, 215],  // Cast iron
  [0, 19300, 400],  // Tungsten alloys
  [0,  8400, 130],  // Brass
  [0,  4500, 105],  // Titanium (cp)
  // Ceramics
  [1, 3900, 380],  // Alumina (Al₂O₃)
  [1, 3200, 410],  // Silicon carbide
  [1, 3200, 310],  // Silicon nitride
  [1, 2500,  70],  // Borosilicate glass
  [1, 2400,  30],  // Concrete
  [1, 5600, 200],  // Zirconia
  [1, 3600, 445],  // Boron carbide
  [1, 2600,  72],  // Soda-lime glass
  [1, 3500, 350],  // Aluminium nitride
  // Polymers
  [2,  950,   1.0],
  [2, 1400,   2.5],
  [2, 1140,   3.0],
  [2, 2200,   0.5],  // PTFE
  [2, 1200,   2.3],  // Polycarbonate
  [2, 1200,   3.5],  // Epoxy
  [2,  910,   1.3],  // Polypropylene
  [2, 1050,   2.0],  // ABS
  [2, 1300,   1.8],  // PMMA
  [2, 1350,   3.0],  // PET
  [2, 1100,   0.8],  // LDPE
  // Composites
  [3, 1550, 140],
  [3, 1750,  40],  // GFRP
  [3, 1400,  75],  // Kevlar / epoxy
  [3, 2700, 100],  // Al / SiC MMC
  [3, 1600,  80],  // CFRP quasi-iso
  [3, 1800,  55],  // GFRP woven
  [3, 1500, 120],  // CFRP random
  // Elastomers
  [4,  930, 0.050],  // Natural rubber
  [4, 1250, 0.010],  // Neoprene
  [4, 1200, 0.007],  // Silicone rubber
  [4, 1050, 0.040],  // Polyurethane elastomer
  [4, 1000, 0.002],  // Soft rubber
  [4, 1100, 0.020],  // EPDM
  // Natural materials
  [5,  700,  12],   // Oak
  [5,  550,   9],   // Pine
  [5,  650,  15],   // Bamboo
  [5,  120,  0.02], // Cork
  [5, 2000,  20],   // Cortical bone
  [5, 2600,  60],   // Nacre / shell
  [5,  400,   2],   // Balsa
  // Foams
  [6,   25,  0.003],  // Polystyrene foam
  [6,   30,  0.001],  // Polyurethane foam
  [6,  300,   2.0],   // Aluminium foam
  [6,  400,   1.0],   // Ceramic foam
  [6,   50,  0.005],  // Cork foam
];

// Group data points by family index
const familyPts = FAMILIES.map((_, fi) =>
  POINTS.filter(p => p[0] === fi).map(p => [p[1], p[2]])
);

// Precompute padded hulls (0.20 log₁₀ units padding)
const hullData = familyPts.map(pts => buildPaddedHull(pts, 0.20));

// Log-centroid per family for label placement
const logCentroids = familyPts.map(pts => {
  const lx = pts.reduce((s, p) => s + Math.log10(p[0]), 0) / pts.length;
  const ly = pts.reduce((s, p) => s + Math.log10(p[1]), 0) / pts.length;
  return [Math.pow(10, lx), Math.pow(10, ly)];
});

// --- Guide lines: constant E^(1/2)/ρ (lightweight stiffness index) ----------
const DENSITY_RANGE = [10, 25000];
const M_VALUES = [3e-5, 3e-4];
const guideLineSeries = M_VALUES.map((M, i) => ({
  type: "line",
  name: i === 0 ? "E^½/ρ = const" : "__guide2",
  data: DENSITY_RANGE.map(rho => [rho, Math.pow(M * rho, 2)]).filter(p => p[1] >= 0.001 && p[1] <= 1000),
  symbol: "none",
  silent: true,
  legendHoverLink: false,
  lineStyle: { color: t.inkSoft, type: "dashed", width: 1.5, opacity: 0.45 },
  z: 0,
}));

// --- Chart ------------------------------------------------------------------
const chart = echarts.init(document.getElementById("container"));

chart.setOption({
  animation: false,
  color: t.palette,
  backgroundColor: "transparent",

  title: {
    text: "scatter-ashby-material · javascript · echarts · anyplot.ai",
    left: "center",
    top: 22,
    textStyle: { color: t.ink, fontSize: 22, fontWeight: "bold" },
  },

  legend: {
    data: FAMILIES.map(f => f.name),
    bottom: 18,
    textStyle: { color: t.inkSoft, fontSize: 14 },
    itemWidth: 14,
    itemHeight: 14,
    itemGap: 20,
  },

  grid: {
    left: 110,
    right: 60,
    top: 80,
    bottom: 100,
  },

  xAxis: {
    type: "log",
    name: "Density  (kg / m³)",
    nameLocation: "middle",
    nameGap: 48,
    min: 10,
    max: 25000,
    nameTextStyle: { color: t.ink, fontSize: 16 },
    axisLabel: { color: t.inkSoft, fontSize: 13 },
    axisLine: { lineStyle: { color: t.inkSoft } },
    axisTick: { lineStyle: { color: t.inkSoft } },
    splitLine: { lineStyle: { color: t.grid } },
  },

  yAxis: {
    type: "log",
    name: "Young's Modulus  (GPa)",
    nameLocation: "middle",
    nameGap: 72,
    min: 0.001,
    max: 1000,
    nameTextStyle: { color: t.ink, fontSize: 16 },
    axisLabel: { color: t.inkSoft, fontSize: 13 },
    axisLine: { lineStyle: { color: t.inkSoft } },
    axisTick: { lineStyle: { color: t.inkSoft } },
    splitLine: { lineStyle: { color: t.grid } },
  },

  series: [
    // Hull regions + family labels (custom series, one render per family)
    {
      type: "custom",
      silent: true,
      legendHoverLink: false,
      renderItem(params, api) {
        const fi = params.dataIndex;
        const hull = hullData[fi];
        const col = FAMILIES[fi].color;
        const name = FAMILIES[fi].name;
        const pixPoly = hull.map(p => api.coord([p[0], p[1]]));
        const [cx, cy] = api.coord(logCentroids[fi]);
        return {
          type: "group",
          children: [
            {
              type: "polygon",
              transition: [],
              shape: { points: pixPoly },
              style: { fill: col, opacity: 0.15, stroke: col, lineWidth: 1.8, strokeOpacity: 0.55 },
            },
            {
              type: "text",
              style: {
                text: name,
                x: cx,
                y: cy,
                textAlign: "center",
                textVerticalAlign: "middle",
                font: "bold 17px sans-serif",
                fill: col,
                opacity: 0.95,
              },
            },
          ],
        };
      },
      data: logCentroids,
      z: 1,
    },

    // Scatter series per family
    ...FAMILIES.map((f, fi) => ({
      type: "scatter",
      name: f.name,
      data: familyPts[fi],
      symbolSize: 12,
      itemStyle: { color: f.color, opacity: 0.9, borderColor: t.pageBg, borderWidth: 1 },
      z: 3,
    })),

    // Guide lines for constant E^(1/2)/ρ performance index
    ...guideLineSeries,
  ],
});
Runnable source as JSON, for any HTTP client: https://api.anyplot.ai/specs/scatter-ashby-material/echarts/code. Any spec id and library id listed in llms-full.txt fit the same URL shape; every URL below is complete and callable.
{
  "spec_id": "scatter-ashby-material",
  "language": "javascript",
  "library": "echarts",
  "page": "https://anyplot.ai/scatter-ashby-material/javascript/echarts",
  "hub": "https://anyplot.ai/scatter-ashby-material",
  "code_json": "https://api.anyplot.ai/specs/scatter-ashby-material/echarts/code",
  "spec_json": "https://api.anyplot.ai/specs/scatter-ashby-material",
  "render_light_png": "https://storage.googleapis.com/anyplot-images/plots/scatter-ashby-material/javascript/echarts/plot-light.png",
  "render_dark_png": "https://storage.googleapis.com/anyplot-images/plots/scatter-ashby-material/javascript/echarts/plot-dark.png",
  "interactive_light_html": "https://storage.googleapis.com/anyplot-images/plots/scatter-ashby-material/javascript/echarts/plot-light.html",
  "interactive_dark_html": "https://storage.googleapis.com/anyplot-images/plots/scatter-ashby-material/javascript/echarts/plot-dark.html",
  "quality_score": 90.0,
  "license": "MIT",
  "guide": "https://anyplot.ai/llms.txt"
}
Part of Ashby Material Selection Chart on anyplot.ai.