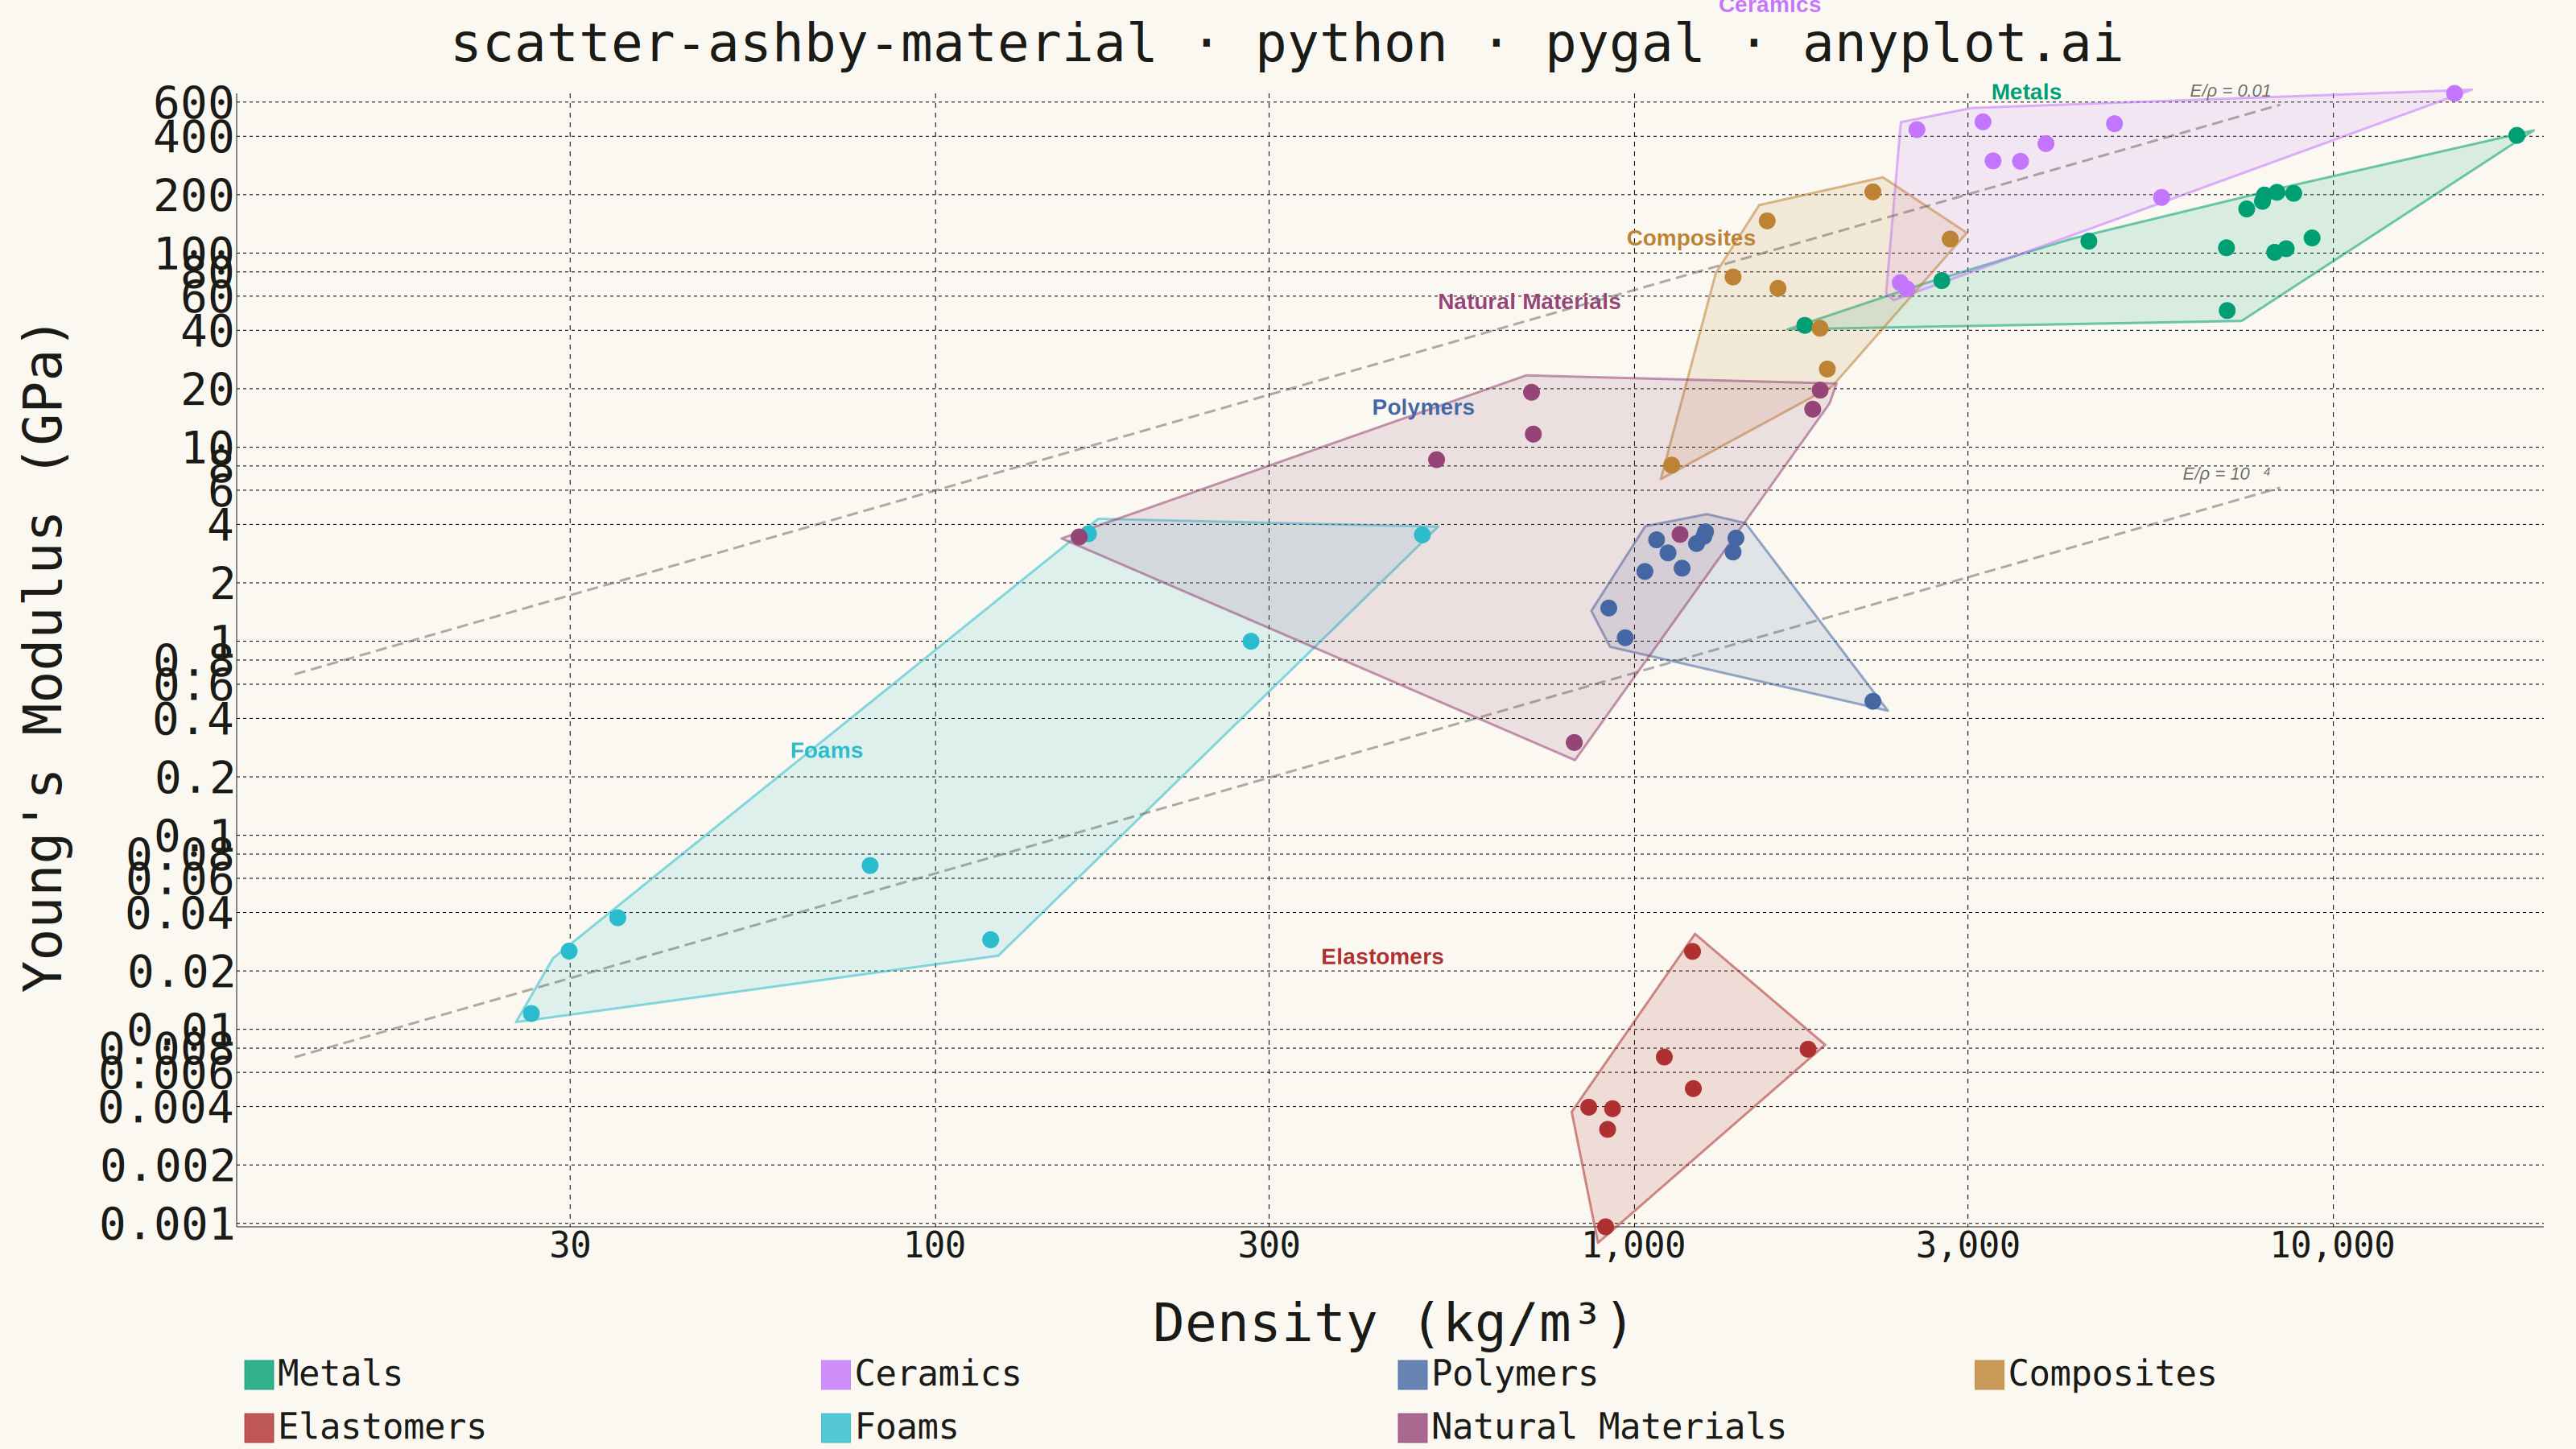
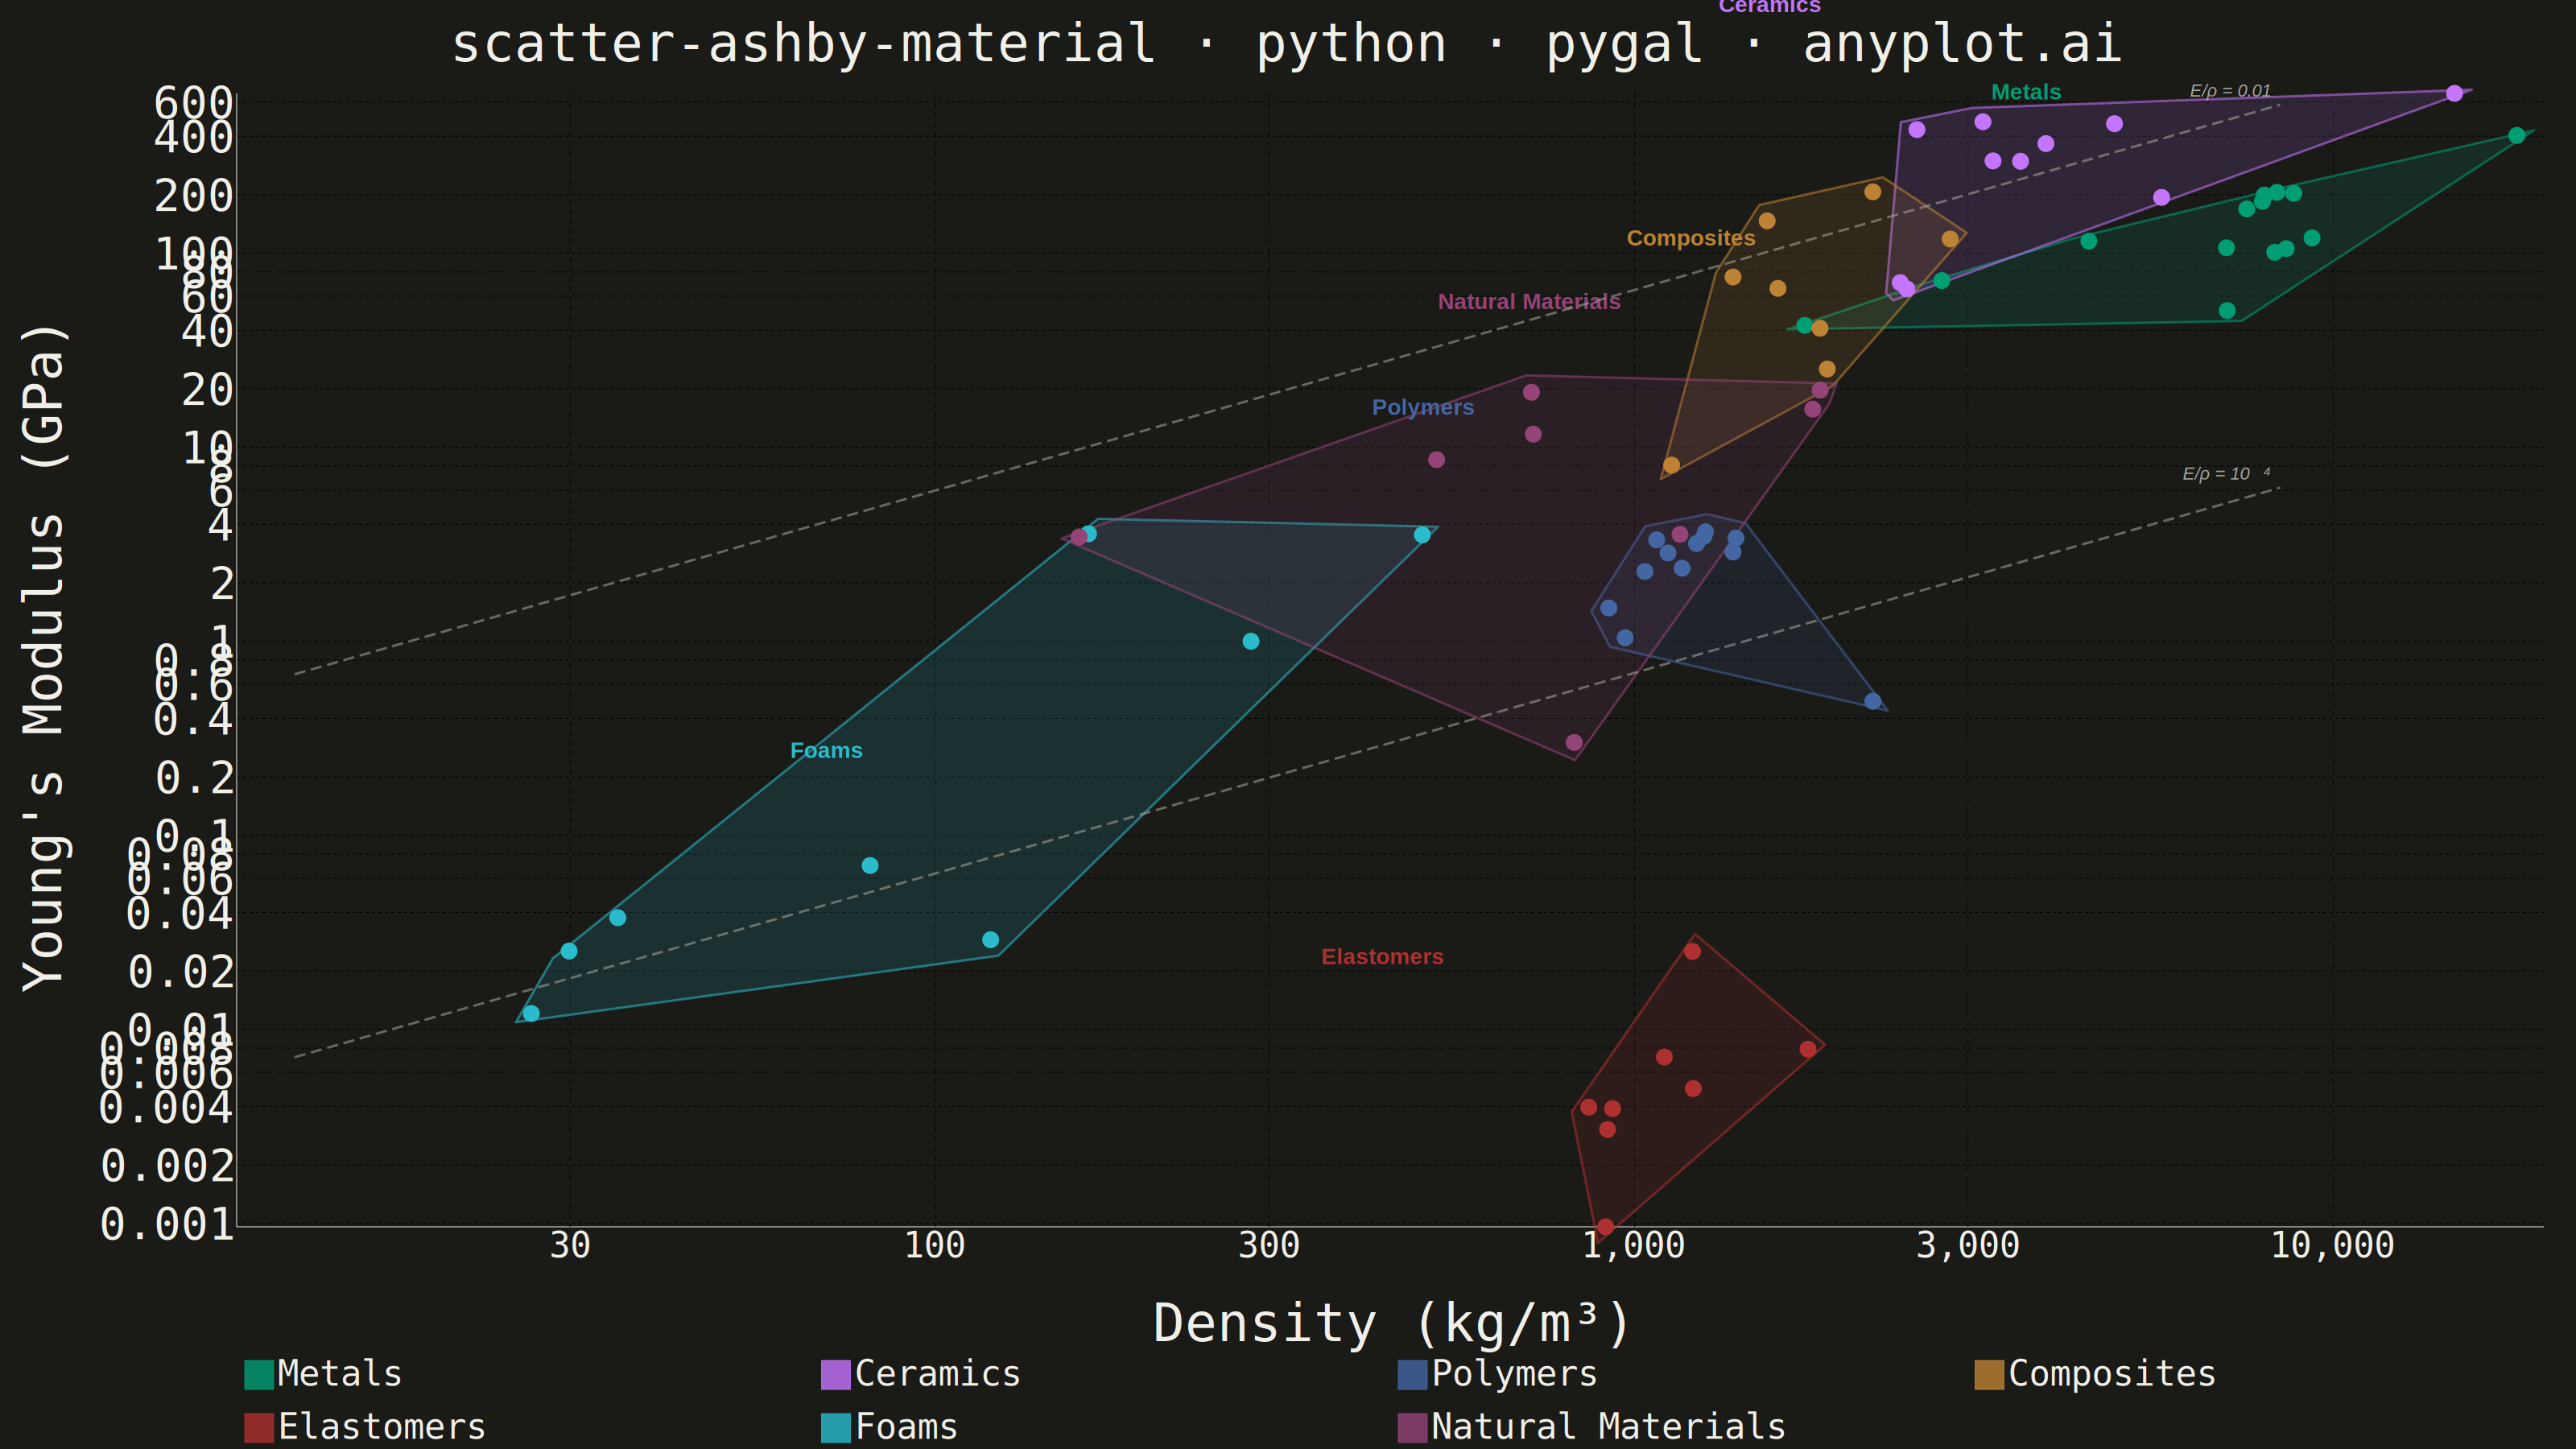
A log-log scatter plot comparing two material properties (e.g., Young's modulus vs. density) with material families displayed as labeled bubble regions. Developed by Michael Ashby for systematic material selection in engineering design, this chart enables rapid visual comparison of material classes across multiple property dimensions. It is a standard tool in materials science and mechanical engineering education.
""" anyplot.ai
scatter-ashby-material: Ashby Material Selection Chart
Library: pygal 3.1.0 | Python 3.13.13
Quality: 84/100 | Updated: 2026-06-03
"""

import os
import sys


# Remove the script's own directory from sys.path so 'import pygal' finds the
# installed package, not this file (which is also named pygal.py).
_script_dir = os.path.dirname(os.path.abspath(__file__))
sys.path = [p for p in sys.path if os.path.abspath(p) != _script_dir and p != ""]

import math
import xml.etree.ElementTree as ET

import cairosvg
import numpy as np
import pygal
from pygal.style import Style
from scipy.spatial import ConvexHull


# Theme tokens
THEME = os.getenv("ANYPLOT_THEME", "light")
PAGE_BG = "#FAF8F1" if THEME == "light" else "#1A1A17"
INK = "#1A1A17" if THEME == "light" else "#F0EFE8"
INK_MUTED = "#6B6A63" if THEME == "light" else "#A8A79F"

# Imprint palette — canonical order, first 7 slots for 7 material families
IMPRINT_PALETTE = (
    "#009E73",  # Metals — brand green
    "#C475FD",  # Ceramics — lavender
    "#4467A3",  # Polymers — blue
    "#BD8233",  # Composites — ochre
    "#AE3030",  # Elastomers — matte red
    "#2ABCCD",  # Foams — cyan
    "#954477",  # Natural Materials — rose
    "#99B314",  # (palette slot 8, unused)
)

# Data — Density (kg/m³) vs Young's Modulus (GPa) for common engineering materials
np.random.seed(42)

families = {
    "Metals": {
        "density": [7850, 2700, 4500, 8900, 8900, 7130, 1740, 19300, 8500, 8800, 7200, 7900, 8440, 7300],
        "modulus": [200, 69, 116, 117, 200, 108, 45, 411, 100, 110, 170, 193, 205, 50],
    },
    "Ceramics": {
        "density": [3950, 3210, 5680, 3180, 2520, 2500, 2400, 3580, 15600, 4930],
        "modulus": [370, 450, 200, 310, 460, 70, 65, 300, 680, 450],
    },
    "Polymers": {
        "density": [960, 910, 1140, 1190, 1200, 1370, 1050, 1300, 1050, 1400, 2170, 1250],
        "modulus": [1.1, 1.5, 2.8, 3.1, 2.4, 2.8, 2.3, 3.6, 3.2, 3.3, 0.5, 3.5],
    },
    "Composites": {
        "density": [1550, 2000, 1380, 1600, 1900, 2100, 2900, 1100],
        "modulus": [140, 40, 76, 70, 25, 210, 120, 8],
    },
    "Elastomers": {
        "density": [930, 1100, 1240, 920, 1200, 860, 1850, 940],
        "modulus": [0.003, 0.007, 0.005, 0.001, 0.025, 0.004, 0.008, 0.004],
    },
    "Foams": {
        "density": [30, 25, 80, 300, 35, 500, 120, 160],
        "modulus": [0.025, 0.012, 0.07, 1.0, 0.035, 3.5, 0.03, 3.5],
    },
    "Natural Materials": {
        "density": [700, 500, 700, 1900, 160, 860, 1200, 1850],
        "modulus": [12, 9, 18, 20, 3.5, 0.3, 3.5, 15],
    },
}

family_names = list(families.keys())
FAMILY_COLORS = IMPRINT_PALETTE[: len(family_names)]

# Style — Imprint palette + theme-adaptive chrome
custom_style = Style(
    background=PAGE_BG,
    plot_background=PAGE_BG,
    foreground=INK,
    foreground_strong=INK,
    foreground_subtle=INK_MUTED,
    colors=FAMILY_COLORS,
    opacity=0.80,
    opacity_hover=0.95,
    title_font_size=66,
    label_font_size=56,
    major_label_font_size=44,
    legend_font_size=44,
    value_font_size=36,
    tooltip_font_size=36,
)

# Chart — 3200×1800 landscape canvas (hard rule)
TITLE = "scatter-ashby-material · python · pygal · anyplot.ai"
chart = pygal.XY(
    width=3200,
    height=1800,
    style=custom_style,
    title=TITLE,
    x_title="Density (kg/m³)",
    y_title="Young's Modulus (GPa)",
    show_legend=True,
    legend_at_bottom=True,
    legend_at_bottom_columns=4,
    legend_box_size=36,
    stroke=False,
    dots_size=10,
    show_x_guides=True,
    show_y_guides=True,
    logarithmic=True,
    x_value_formatter=lambda x: f"{x:,.0f}",
    value_formatter=lambda x: f"{x:.3g}",
    margin_top=40,
    margin_bottom=80,
    margin_left=40,
    margin_right=40,
    print_values=False,
    truncate_legend=20,
    truncate_label=16,
    show_minor_x_labels=False,
)

# Restrict x-axis to decade tick marks only — set all sub-decade ticks explicitly
# so show_minor_x_labels=False can suppress non-major ones
chart.x_labels = [
    10,
    20,
    30,
    40,
    50,
    60,
    70,
    80,
    90,
    100,
    200,
    300,
    400,
    500,
    600,
    700,
    800,
    900,
    1000,
    2000,
    3000,
    4000,
    5000,
    6000,
    7000,
    8000,
    9000,
    10000,
    20000,
]
chart.x_labels_major = [30, 100, 300, 1000, 3000, 10000]

# Add data with slight jitter for visual separation within families
jitter = np.random.normal(1.0, 0.03, (250, 2))
idx = 0
for family_name, fdata in families.items():
    points = []
    for d, m in zip(fdata["density"], fdata["modulus"], strict=False):
        jd = d * jitter[idx % 250, 0]
        jm = m * jitter[idx % 250, 1]
        idx += 1
        points.append(
            {"value": (round(jd, 1), round(jm, 5)), "label": f"{family_name} — ρ={jd:,.0f} kg/m³, E={jm:.3g} GPa"}
        )
    chart.add(family_name, points)

# Save interactive HTML before post-processing — preserves pygal's JS tooltips
with open(f"plot-{THEME}.html", "wb") as f:
    f.write(chart.render())

# Render SVG for post-processing (PNG only)
svg_bytes = chart.render()
svg_string = svg_bytes.decode("utf-8")

ET.register_namespace("", "http://www.w3.org/2000/svg")
ET.register_namespace("xlink", "http://www.w3.org/1999/xlink")
root = ET.fromstring(svg_string)

# Extract circle positions per series
series_circles = {}
for g in root.iter("{http://www.w3.org/2000/svg}g"):
    cls = g.get("class", "")
    if cls.startswith("series serie-"):
        parts = cls.split()
        serie_idx = int(parts[1].replace("serie-", ""))
        circles = []
        for circle in g.iter("{http://www.w3.org/2000/svg}circle"):
            cx = circle.get("cx")
            cy = circle.get("cy")
            if cx and cy:
                circles.append((float(cx), float(cy)))
        if circles and serie_idx not in series_circles:
            series_circles[serie_idx] = circles

# Build convex hull regions group
hulls_group = ET.Element("{http://www.w3.org/2000/svg}g")
hulls_group.set("class", "hull-regions")

for serie_idx, circles in series_circles.items():
    if serie_idx >= len(family_names):
        continue
    color = FAMILY_COLORS[serie_idx]
    pts = np.array(circles)

    try:
        hull = ConvexHull(pts)
        verts = pts[hull.vertices]
        centroid = verts.mean(axis=0)
        dirs = verts - centroid
        norms = np.linalg.norm(dirs, axis=1, keepdims=True)
        norms = np.where(norms == 0, 1, norms)
        expanded = verts + (dirs / norms) * 22  # 22-px outward padding
        points_str = " ".join(f"{x:.1f},{y:.1f}" for x, y in expanded)
        poly = ET.SubElement(hulls_group, "{http://www.w3.org/2000/svg}polygon")
        poly.set("points", points_str)
        poly.set("fill", color)
        poly.set("fill-opacity", "0.14")
        poly.set("stroke", color)
        poly.set("stroke-opacity", "0.55")
        poly.set("stroke-width", "3")
        poly.set("stroke-linejoin", "round")
    except Exception:
        # Fallback: padded bounding box
        x0, x1 = pts[:, 0].min() - 18, pts[:, 0].max() + 18
        y0, y1 = pts[:, 1].min() - 18, pts[:, 1].max() + 18
        poly = ET.SubElement(hulls_group, "{http://www.w3.org/2000/svg}polygon")
        poly.set("points", f"{x0:.1f},{y0:.1f} {x1:.1f},{y0:.1f} {x1:.1f},{y1:.1f} {x0:.1f},{y1:.1f}")
        poly.set("fill", color)
        poly.set("fill-opacity", "0.14")
        poly.set("stroke", color)
        poly.set("stroke-opacity", "0.55")
        poly.set("stroke-width", "3")

# Insert hulls group behind the series dots — find parent of first series group
series_parent = None
for g in root.iter("{http://www.w3.org/2000/svg}g"):
    for child in list(g):
        if child.get("class", "").startswith("series serie-0"):
            series_parent = g
            break
    if series_parent is not None:
        break

if series_parent is not None:
    first_series_idx = 0
    for i, child in enumerate(list(series_parent)):
        if child.get("class", "").startswith("series"):
            first_series_idx = i
            break
    series_parent.insert(first_series_idx, hulls_group)
else:
    root.append(hulls_group)

# Family name labels at cluster centroids
labels_group = ET.SubElement(root, "{http://www.w3.org/2000/svg}g")
labels_group.set("class", "family-labels")

label_offsets = {
    "Metals": (0, -58),
    "Ceramics": (0, -58),
    "Polymers": (-100, -55),
    "Composites": (80, 70),
    "Elastomers": (-100, -50),
    "Foams": (120, -50),
    "Natural Materials": (150, -55),
}

for serie_idx, circles in series_circles.items():
    if serie_idx >= len(family_names):
        continue
    name = family_names[serie_idx]
    color = FAMILY_COLORS[serie_idx]
    pts = np.array(circles)
    cx_med = float(np.median(pts[:, 0]))
    cy_med = float(np.median(pts[:, 1]))
    ox, oy = label_offsets.get(name, (0, -42))

    text_el = ET.SubElement(labels_group, "{http://www.w3.org/2000/svg}text")
    text_el.set("x", f"{cx_med + ox:.1f}")
    text_el.set("y", f"{cy_med + oy:.1f}")
    text_el.set("font-family", "Helvetica, Arial, sans-serif")
    text_el.set("font-size", "28")
    text_el.set("font-weight", "bold")
    text_el.set("fill", color)
    text_el.set("text-anchor", "middle" if ox == 0 else "start")
    text_el.set("stroke", PAGE_BG)
    text_el.set("stroke-width", "6")
    text_el.set("paint-order", "stroke")
    text_el.text = name

# E/ρ performance index guide lines (log-log: slope=1 lines)
all_cx = [cx for circles in series_circles.values() for cx, cy in circles]
all_cy = [cy for circles in series_circles.values() for cx, cy in circles]

if all_cx and all_cy:
    svg_x_min, svg_x_max = min(all_cx), max(all_cx)
    svg_y_min, svg_y_max = min(all_cy), max(all_cy)

    log_x_min = math.log10(min(d for f in families.values() for d in f["density"]) * 0.9)
    log_x_max = math.log10(max(d for f in families.values() for d in f["density"]) * 1.1)
    log_y_min = math.log10(min(m for f in families.values() for m in f["modulus"]) * 0.9)
    log_y_max = math.log10(max(m for f in families.values() for m in f["modulus"]) * 1.1)

    guides_group = ET.SubElement(root, "{http://www.w3.org/2000/svg}g")
    guides_group.set("class", "guide-lines")

    for c_val, label_text in [(0.01, "E/ρ = 0.01"), (0.0001, "E/ρ = 10⁻⁴")]:
        log_c = math.log10(c_val)
        lx1, ly1 = log_x_min, log_x_min + log_c
        if ly1 < log_y_min:
            lx1, ly1 = log_y_min - log_c, log_y_min
        lx2, ly2 = log_x_max, log_x_max + log_c
        if ly2 > log_y_max:
            lx2, ly2 = log_y_max - log_c, log_y_max
        if ly1 > log_y_max or ly2 < log_y_min:
            continue

        sx1 = svg_x_min + (lx1 - log_x_min) / (log_x_max - log_x_min) * (svg_x_max - svg_x_min)
        sy1 = svg_y_max - (ly1 - log_y_min) / (log_y_max - log_y_min) * (svg_y_max - svg_y_min)
        sx2 = svg_x_min + (lx2 - log_x_min) / (log_x_max - log_x_min) * (svg_x_max - svg_x_min)
        sy2 = svg_y_max - (ly2 - log_y_min) / (log_y_max - log_y_min) * (svg_y_max - svg_y_min)

        line_el = ET.SubElement(guides_group, "{http://www.w3.org/2000/svg}line")
        line_el.set("x1", f"{sx1:.1f}")
        line_el.set("y1", f"{sy1:.1f}")
        line_el.set("x2", f"{sx2:.1f}")
        line_el.set("y2", f"{sy2:.1f}")
        line_el.set("stroke", INK_MUTED)
        line_el.set("stroke-width", "3")
        line_el.set("stroke-dasharray", "14,7")
        line_el.set("opacity", "0.55")

        text_el = ET.SubElement(guides_group, "{http://www.w3.org/2000/svg}text")
        text_el.set("x", f"{sx2 - 12:.1f}")
        text_el.set("y", f"{sy2 - 10:.1f}")
        text_el.set("font-family", "Helvetica, Arial, sans-serif")
        text_el.set("font-size", "22")
        text_el.set("fill", INK_MUTED)
        text_el.set("text-anchor", "end")
        text_el.set("font-style", "italic")
        text_el.text = label_text

# Serialize
final_svg = ET.tostring(root, encoding="unicode", xml_declaration=False)

# Save PNG
cairosvg.svg2png(bytestring=final_svg.encode("utf-8"), write_to=f"plot-{THEME}.png")
Runnable source as JSON, for any HTTP client: https://api.anyplot.ai/specs/scatter-ashby-material/pygal/code. Any spec id and library id listed in llms-full.txt fit the same URL shape; every URL below is complete and callable.
{
  "spec_id": "scatter-ashby-material",
  "language": "python",
  "library": "pygal",
  "page": "https://anyplot.ai/scatter-ashby-material/python/pygal",
  "hub": "https://anyplot.ai/scatter-ashby-material",
  "code_json": "https://api.anyplot.ai/specs/scatter-ashby-material/pygal/code",
  "spec_json": "https://api.anyplot.ai/specs/scatter-ashby-material",
  "render_light_png": "https://storage.googleapis.com/anyplot-images/plots/scatter-ashby-material/python/pygal/plot-light.png",
  "render_dark_png": "https://storage.googleapis.com/anyplot-images/plots/scatter-ashby-material/python/pygal/plot-dark.png",
  "interactive_light_html": "https://storage.googleapis.com/anyplot-images/plots/scatter-ashby-material/python/pygal/plot-light.html",
  "interactive_dark_html": "https://storage.googleapis.com/anyplot-images/plots/scatter-ashby-material/python/pygal/plot-dark.html",
  "quality_score": 84.0,
  "license": "MIT",
  "guide": "https://anyplot.ai/llms.txt"
}
Part of Ashby Material Selection Chart on anyplot.ai.