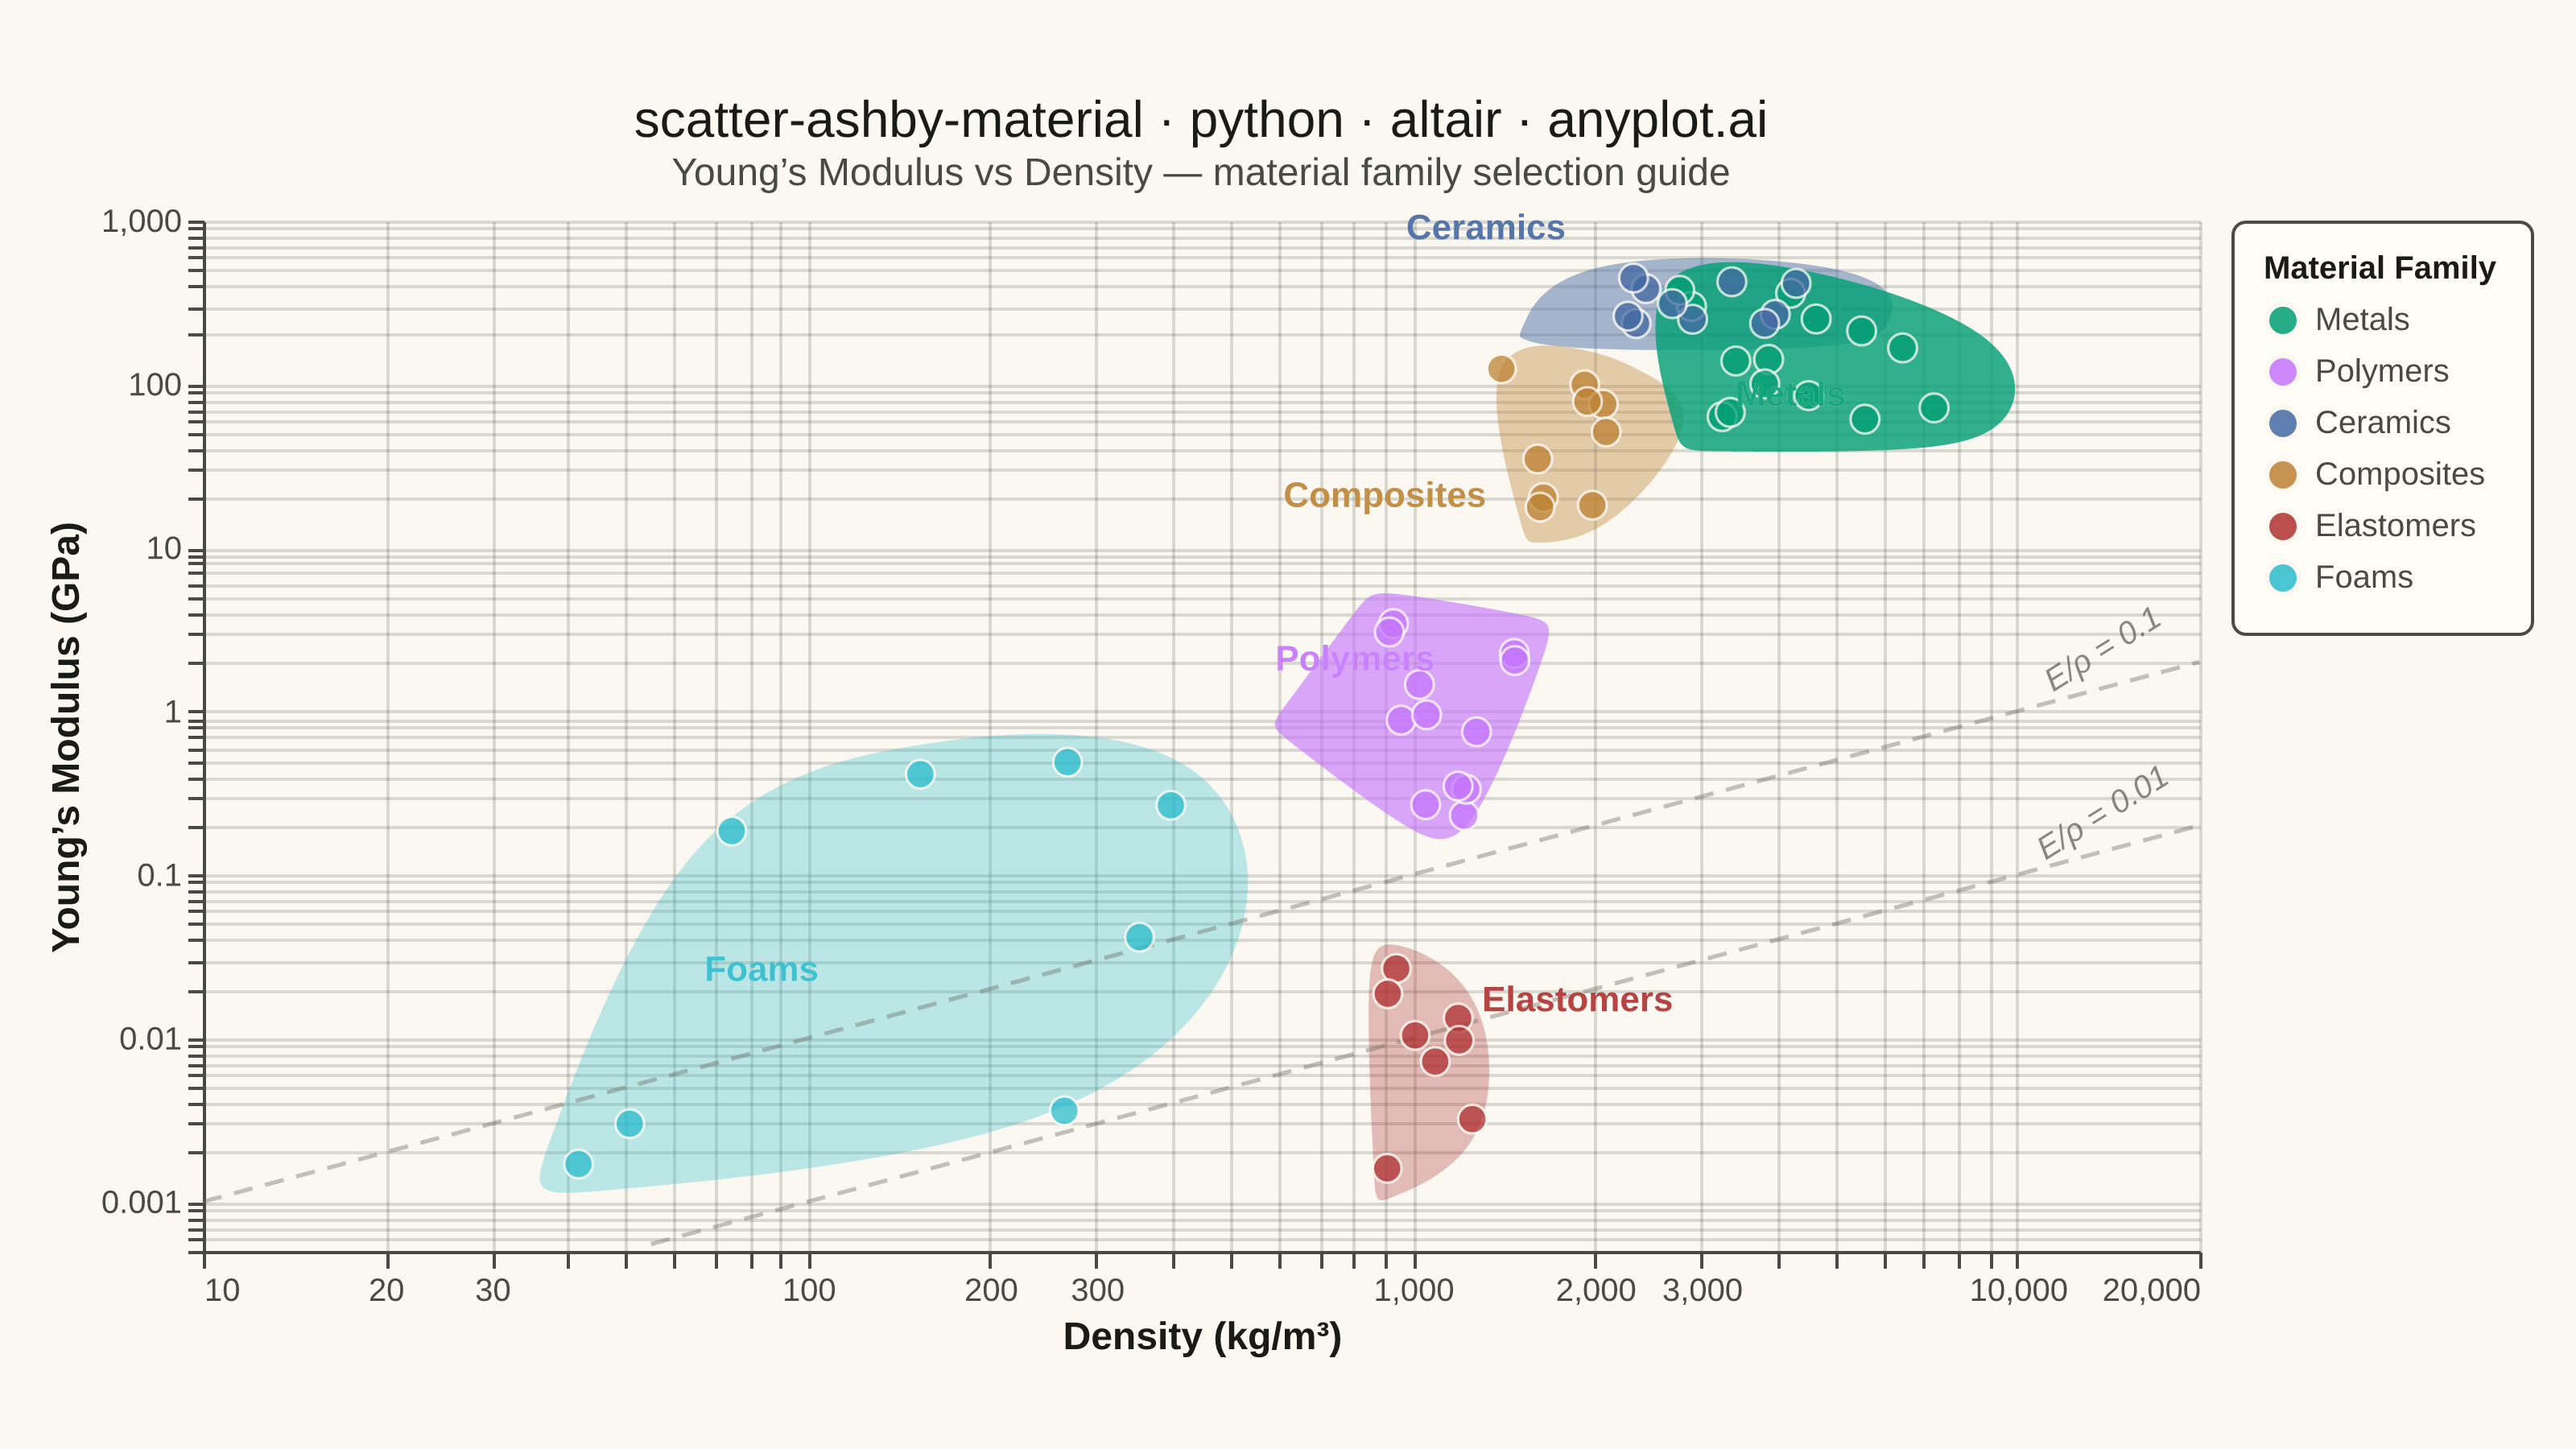
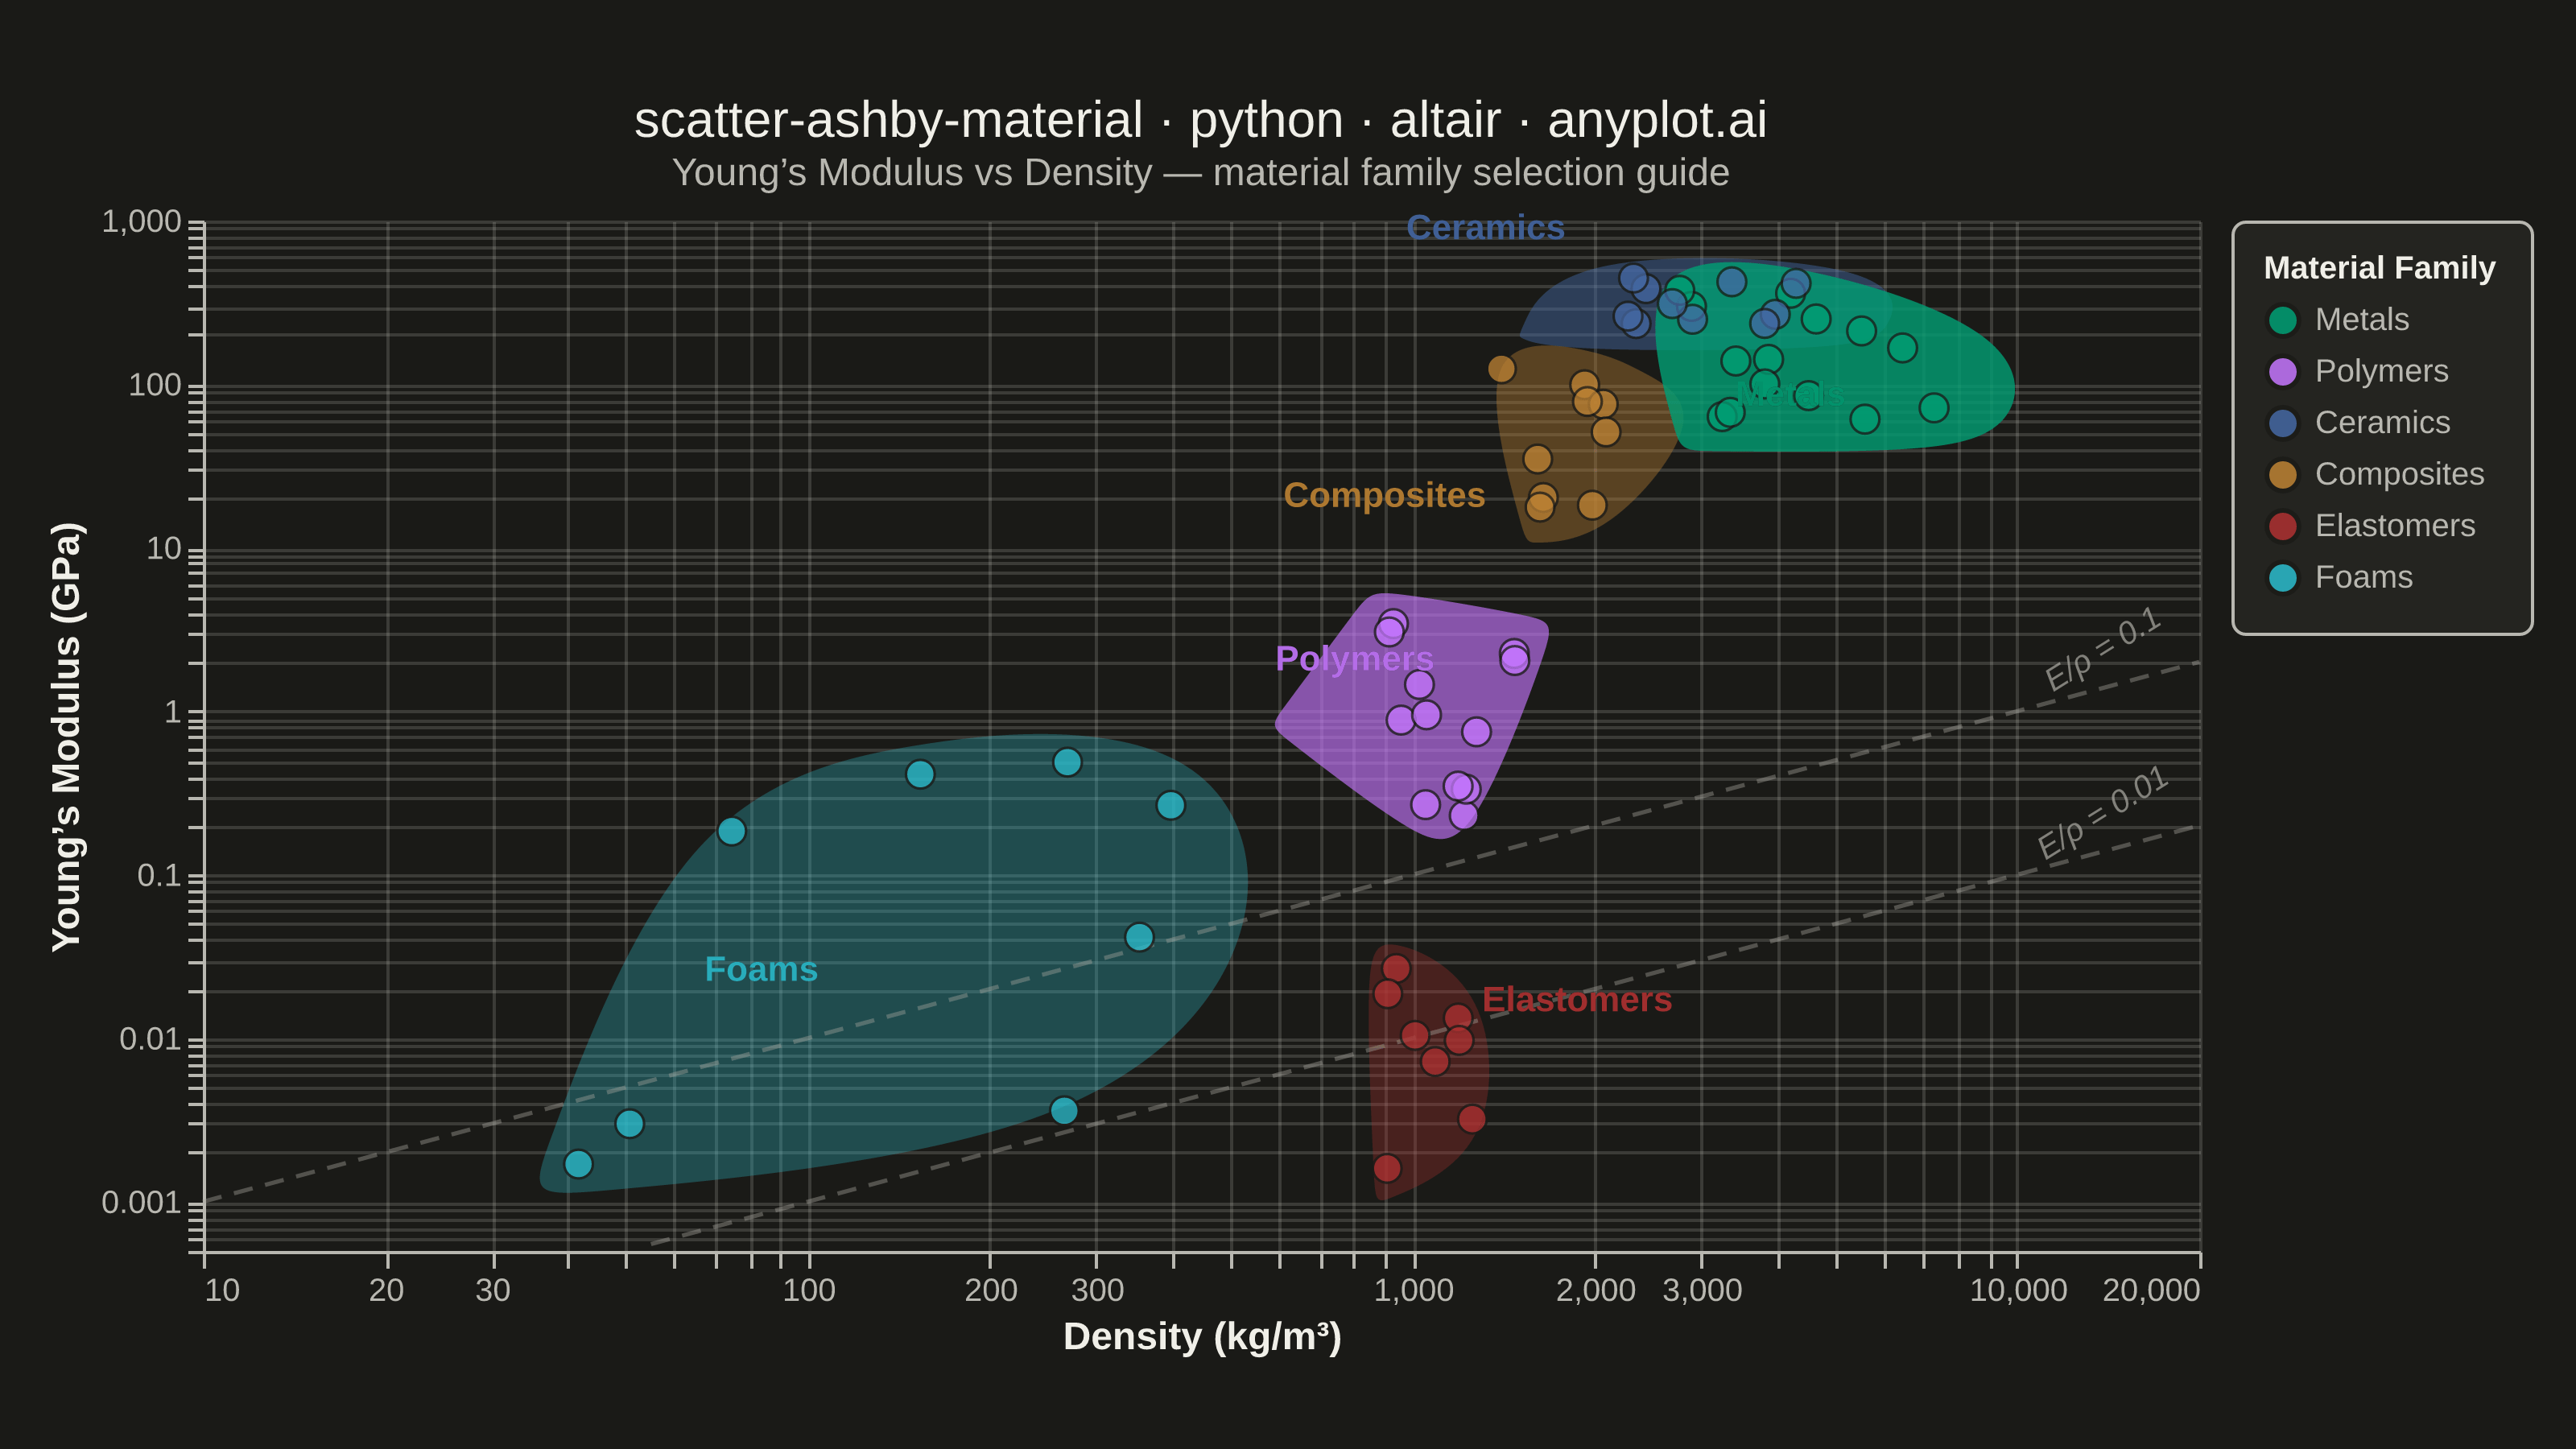
A log-log scatter plot comparing two material properties (e.g., Young's modulus vs. density) with material families displayed as labeled bubble regions. Developed by Michael Ashby for systematic material selection in engineering design, this chart enables rapid visual comparison of material classes across multiple property dimensions. It is a standard tool in materials science and mechanical engineering education.
""" anyplot.ai
scatter-ashby-material: Ashby Material Selection Chart
Library: altair 6.1.0 | Python 3.13.13
Quality: 91/100 | Updated: 2026-06-03
"""

import importlib
import os
import sys

from PIL import Image


# Drop script directory from sys.path so the `altair` package resolves, not this file
sys.path[:] = [p for p in sys.path if os.path.abspath(p or ".") != os.path.dirname(os.path.abspath(__file__))]
alt = importlib.import_module("altair")
np = importlib.import_module("numpy")
pd = importlib.import_module("pandas")
ConvexHull = importlib.import_module("scipy.spatial").ConvexHull

THEME = os.getenv("ANYPLOT_THEME", "light")
PAGE_BG = "#FAF8F1" if THEME == "light" else "#1A1A17"
ELEVATED_BG = "#FFFDF6" if THEME == "light" else "#242420"
INK = "#1A1A17" if THEME == "light" else "#F0EFE8"
INK_SOFT = "#4A4A44" if THEME == "light" else "#B8B7B0"
INK_MUTED = "#6B6A63" if THEME == "light" else "#A8A79F"

# Imprint palette — 6 positions for 6 material families, canonical order
IMPRINT_PALETTE = ["#009E73", "#C475FD", "#4467A3", "#BD8233", "#AE3030", "#2ABCCD"]
FONT = "Helvetica Neue, Helvetica, Arial, sans-serif"

np.random.seed(42)

# Material family data with realistic property ranges
families = {
    "Metals": {
        "density": (2700, 8900),
        "modulus": (45, 400),
        "materials": [
            "Aluminum",
            "Steel",
            "Titanium",
            "Copper",
            "Nickel",
            "Zinc",
            "Magnesium",
            "Brass",
            "Bronze",
            "Tungsten",
            "Cast Iron",
            "Stainless Steel",
            "Inconel",
            "Tin",
        ],
    },
    "Polymers": {
        "density": (900, 1500),
        "modulus": (0.2, 4.0),
        "materials": [
            "Polyethylene",
            "Polypropylene",
            "PVC",
            "Nylon",
            "Polycarbonate",
            "ABS",
            "PMMA",
            "PET",
            "Polystyrene",
            "PTFE",
            "Epoxy",
            "Polyurethane",
        ],
    },
    "Ceramics": {
        "density": (2200, 4500),
        "modulus": (200, 450),
        "materials": [
            "Alumina",
            "Silicon Carbide",
            "Zirconia",
            "Silicon Nitride",
            "Glass",
            "Porcelain",
            "Boron Carbide",
            "Tungsten Carbide",
            "Silica",
            "Magnesia",
        ],
    },
    "Composites": {
        "density": (1400, 2200),
        "modulus": (15, 200),
        "materials": [
            "CFRP",
            "GFRP",
            "Kevlar Composite",
            "Boron-Epoxy",
            "Wood-Polymer",
            "Metal Matrix",
            "Ceramic Matrix",
            "Carbon-Carbon",
            "Basalt Fiber",
        ],
    },
    "Elastomers": {
        "density": (900, 1300),
        "modulus": (0.001, 0.1),
        "materials": [
            "Natural Rubber",
            "Silicone",
            "Neoprene",
            "Butyl Rubber",
            "EPDM",
            "Nitrile Rubber",
            "Polyisoprene",
            "SBR",
        ],
    },
    "Foams": {
        "density": (20, 500),
        "modulus": (0.001, 1.0),
        "materials": [
            "Polyurethane Foam",
            "Polystyrene Foam",
            "PVC Foam",
            "Metal Foam",
            "Cork",
            "Ceramic Foam",
            "Phenolic Foam",
            "Melamine Foam",
        ],
    },
}

rows = []
for family, props in families.items():
    d_lo, d_hi = props["density"]
    m_lo, m_hi = props["modulus"]
    for mat in props["materials"]:
        density = 10 ** np.random.uniform(np.log10(d_lo), np.log10(d_hi))
        modulus = 10 ** np.random.uniform(np.log10(m_lo), np.log10(m_hi))
        rows.append({"material": mat, "family": family, "density": round(density, 1), "modulus": round(modulus, 4)})

df = pd.DataFrame(rows)

family_order = ["Metals", "Polymers", "Ceramics", "Composites", "Elastomers", "Foams"]
family_sizes = {f: len(families[f]["materials"]) for f in family_order}
max_size = max(family_sizes.values())

# Build padded convex-hull envelopes per family in log space (scipy replaces manual impl)
envelope_rows = []
for family, group in df.groupby("family"):
    log_x = np.log10(group["density"].values)
    log_y = np.log10(group["modulus"].values)
    cx, cy = log_x.mean(), log_y.mean()
    pts = np.column_stack([log_x, log_y])

    if len(pts) >= 3:
        hull = ConvexHull(pts)
        hull_pts = pts[hull.vertices]
    else:
        hull_pts = pts

    # Sort hull vertices by angle for a proper closed polygon
    angles = np.arctan2(hull_pts[:, 1] - cy, hull_pts[:, 0] - cx)
    hull_pts = hull_pts[np.argsort(angles)]

    # Pad outward from centroid for visual breathing room
    pad = 0.22
    padded = []
    for hx, hy in hull_pts:
        dx, dy = hx - cx, hy - cy
        dist = np.hypot(dx, dy) or 1e-6
        padded.append((hx + pad * dx / dist, hy + pad * dy / dist))
    padded.append(padded[0])  # close polygon

    fill_alpha = 0.10 + 0.10 * (family_sizes[family] / max_size)
    for i, (xi, yi) in enumerate(padded):
        envelope_rows.append(
            {"family": family, "density": 10**xi, "modulus": 10**yi, "pt_order": i, "fill_alpha": round(fill_alpha, 3)}
        )

df_envelope = pd.DataFrame(envelope_rows)

# Family label positions (geometric center in log space with nudge offsets)
label_nudge = {
    "Metals": (0.0, -0.22),  # centred horizontally to avoid envelope edge
    "Polymers": (-0.15, 0.35),
    "Ceramics": (-0.35, 0.45),
    "Composites": (-0.3, -0.35),
    "Elastomers": (0.25, 0.3),
    "Foams": (-0.25, -0.2),
}
family_centers = []
for family, group in df.groupby("family"):
    log_cx = np.mean(np.log10(group["density"].values))
    log_cy = np.mean(np.log10(group["modulus"].values))
    dx, dy = label_nudge.get(family, (0, 0))
    family_centers.append(
        {"family": family, "density_center": 10 ** (log_cx + dx), "modulus_center": 10 ** (log_cy + dy)}
    )
df_labels = pd.DataFrame(family_centers)

# Scales
color_scale = alt.Scale(domain=family_order, range=IMPRINT_PALETTE)
x_scale = alt.Scale(type="log", domain=[10, 20000])
y_scale = alt.Scale(type="log", domain=[0.0005, 1000])

highlight = alt.selection_point(fields=["family"], on="pointerover", empty=False)

# Envelope regions
envelopes = (
    alt.Chart(df_envelope)
    .mark_line(filled=True, strokeWidth=1.5, interpolate="basis-closed")
    .encode(
        x=alt.X("density:Q", scale=x_scale),
        y=alt.Y("modulus:Q", scale=y_scale),
        color=alt.Color("family:N", scale=color_scale, legend=None),
        fill=alt.Fill("family:N", scale=color_scale, legend=None),
        fillOpacity="fill_alpha:Q",
        strokeOpacity=alt.value(0.45),
        order="pt_order:O",
        detail="family:N",
    )
)

# Scatter points with interactive hover highlight
points = (
    alt.Chart(df)
    .mark_circle(stroke=PAGE_BG, strokeWidth=0.8)
    .encode(
        x=alt.X("density:Q", scale=x_scale, title="Density (kg/m³)"),
        y=alt.Y("modulus:Q", scale=y_scale, title="Young’s Modulus (GPa)"),
        color=alt.Color(
            "family:N",
            scale=color_scale,
            legend=alt.Legend(
                title="Material Family",
                titleFontSize=10,
                titleFont=FONT,
                labelFontSize=10,
                labelFont=FONT,
                symbolSize=100,
                orient="right",
                symbolOpacity=0.85,
            ),
        ),
        size=alt.condition(highlight, alt.value(120), alt.value(80)),
        opacity=alt.condition(highlight, alt.value(0.95), alt.value(0.75)),
        tooltip=[
            alt.Tooltip("material:N", title="Material"),
            alt.Tooltip("family:N", title="Family"),
            alt.Tooltip("density:Q", title="Density (kg/m³)", format=",.0f"),
            alt.Tooltip("modulus:Q", title="Modulus (GPa)", format=".3f"),
        ],
    )
    .add_params(highlight)
)

# Family labels with page-bg halo for readability
label_bg = (
    alt.Chart(df_labels)
    .mark_text(fontSize=11, fontWeight="bold", font=FONT, opacity=0.9)
    .encode(
        x=alt.X("density_center:Q", scale=x_scale),
        y=alt.Y("modulus_center:Q", scale=y_scale),
        text="family:N",
        color=alt.value(PAGE_BG),
    )
)

labels = (
    alt.Chart(df_labels)
    .mark_text(fontSize=11, fontWeight="bold", font=FONT, opacity=0.9)
    .encode(
        x=alt.X("density_center:Q", scale=x_scale),
        y=alt.Y("modulus_center:Q", scale=y_scale),
        text="family:N",
        color=alt.Color("family:N", scale=color_scale, legend=None),
    )
)

# Performance index guide lines: E/rho = constant
guide_densities = np.logspace(np.log10(10), np.log10(20000), 50)
guide_rows = []
for ratio, lbl in [(0.01, "E/ρ = 0.01"), (0.1, "E/ρ = 0.1")]:
    for d in guide_densities:
        m = ratio * d / 1000
        if 0.0005 <= m <= 1000:
            guide_rows.append({"density": d, "modulus": m, "guide": lbl})
df_guides = pd.DataFrame(guide_rows)

guides = (
    alt.Chart(df_guides)
    .mark_line(strokeDash=[6, 4], strokeWidth=1.3, opacity=0.4)
    .encode(
        x=alt.X("density:Q", scale=x_scale),
        y=alt.Y("modulus:Q", scale=y_scale),
        detail="guide:N",
        color=alt.value(INK_MUTED),
    )
)

guide_label_pts = []
for ratio, lbl in [(0.01, "E/ρ = 0.01"), (0.1, "E/ρ = 0.1")]:
    d_pos = 15000
    m_pos = ratio * d_pos / 1000
    if 0.0005 <= m_pos <= 1000:
        guide_label_pts.append({"density": d_pos, "modulus": m_pos, "guide": lbl})
df_guide_labels = pd.DataFrame(guide_label_pts)

guide_labels = (
    alt.Chart(df_guide_labels)
    .mark_text(fontSize=10, fontStyle="italic", font=FONT, opacity=0.65, angle=328, dy=-12)
    .encode(
        x=alt.X("density:Q", scale=x_scale),
        y=alt.Y("modulus:Q", scale=y_scale),
        text="guide:N",
        color=alt.value(INK_SOFT),
    )
)

title_str = "scatter-ashby-material · python · altair · anyplot.ai"

chart = (
    alt.layer(envelopes, guides, guide_labels, points, label_bg, labels)
    .properties(
        width=620,
        height=320,
        title=alt.Title(
            title_str,
            fontSize=16,
            fontWeight=500,
            font=FONT,
            color=INK,
            subtitle="Young’s Modulus vs Density — material family selection guide",
            subtitleFontSize=12,
            subtitleColor=INK_SOFT,
            subtitleFont=FONT,
        ),
        background=PAGE_BG,
        padding={"left": 10, "right": 10, "top": 10, "bottom": 10},
    )
    .resolve_scale(color="shared", fill="independent")
    .configure_axis(
        labelFontSize=10,
        titleFontSize=12,
        labelFont=FONT,
        titleFont=FONT,
        gridOpacity=0.15,
        grid=True,
        gridColor=INK,
        domainColor=INK_SOFT,
        tickColor=INK_SOFT,
        labelColor=INK_SOFT,
        titleColor=INK,
    )
    .configure_view(strokeWidth=0, fill=PAGE_BG)
    .configure_legend(
        titleFontSize=10,
        labelFontSize=10,
        symbolSize=100,
        padding=10,
        offset=8,
        cornerRadius=4,
        fillColor=ELEVATED_BG,
        strokeColor=INK_SOFT,
        titleColor=INK,
        labelColor=INK_SOFT,
    )
    .configure_title(color=INK, subtitleColor=INK_SOFT)
)

# Save PNG and pad to exact 3200×1800 target (vl-convert may land slightly short)
chart.save(f"plot-{THEME}.png", scale_factor=4.0)

TW, TH = 3200, 1800
_img = Image.open(f"plot-{THEME}.png").convert("RGB")
_w, _h = _img.size
if _w > TW or _h > TH:
    raise SystemExit(
        f"altair vl-convert produced {_w}×{_h}, exceeds target {TW}×{TH}. "
        f"Shrink chart .properties(width=, height=) values and re-render."
    )
if _w < TW or _h < TH:
    _canvas = Image.new("RGB", (TW, TH), PAGE_BG)
    _canvas.paste(_img, ((TW - _w) // 2, (TH - _h) // 2))
    _canvas.save(f"plot-{THEME}.png")

chart.save(f"plot-{THEME}.html")
Runnable source as JSON, for any HTTP client: https://api.anyplot.ai/specs/scatter-ashby-material/altair/code. Any spec id and library id listed in llms-full.txt fit the same URL shape; every URL below is complete and callable.
{
  "spec_id": "scatter-ashby-material",
  "language": "python",
  "library": "altair",
  "page": "https://anyplot.ai/scatter-ashby-material/python/altair",
  "hub": "https://anyplot.ai/scatter-ashby-material",
  "code_json": "https://api.anyplot.ai/specs/scatter-ashby-material/altair/code",
  "spec_json": "https://api.anyplot.ai/specs/scatter-ashby-material",
  "render_light_png": "https://storage.googleapis.com/anyplot-images/plots/scatter-ashby-material/python/altair/plot-light.png",
  "render_dark_png": "https://storage.googleapis.com/anyplot-images/plots/scatter-ashby-material/python/altair/plot-dark.png",
  "interactive_light_html": "https://storage.googleapis.com/anyplot-images/plots/scatter-ashby-material/python/altair/plot-light.html",
  "interactive_dark_html": "https://storage.googleapis.com/anyplot-images/plots/scatter-ashby-material/python/altair/plot-dark.html",
  "quality_score": 91.0,
  "license": "MIT",
  "guide": "https://anyplot.ai/llms.txt"
}
Part of Ashby Material Selection Chart on anyplot.ai.