The same plot in 14 other libraries — JavaScript: Chart.js, D3.js, Apache ECharts, Highcharts; Python: Altair, Bokeh, lets-plot, Matplotlib, Plotly, plotnine, Pygal, Seaborn; R: ggplot2; Julia: Makie.jl. Compare all 15 side by side: Ashby Material Selection Chart in Python, R, Julia and JavaScript.
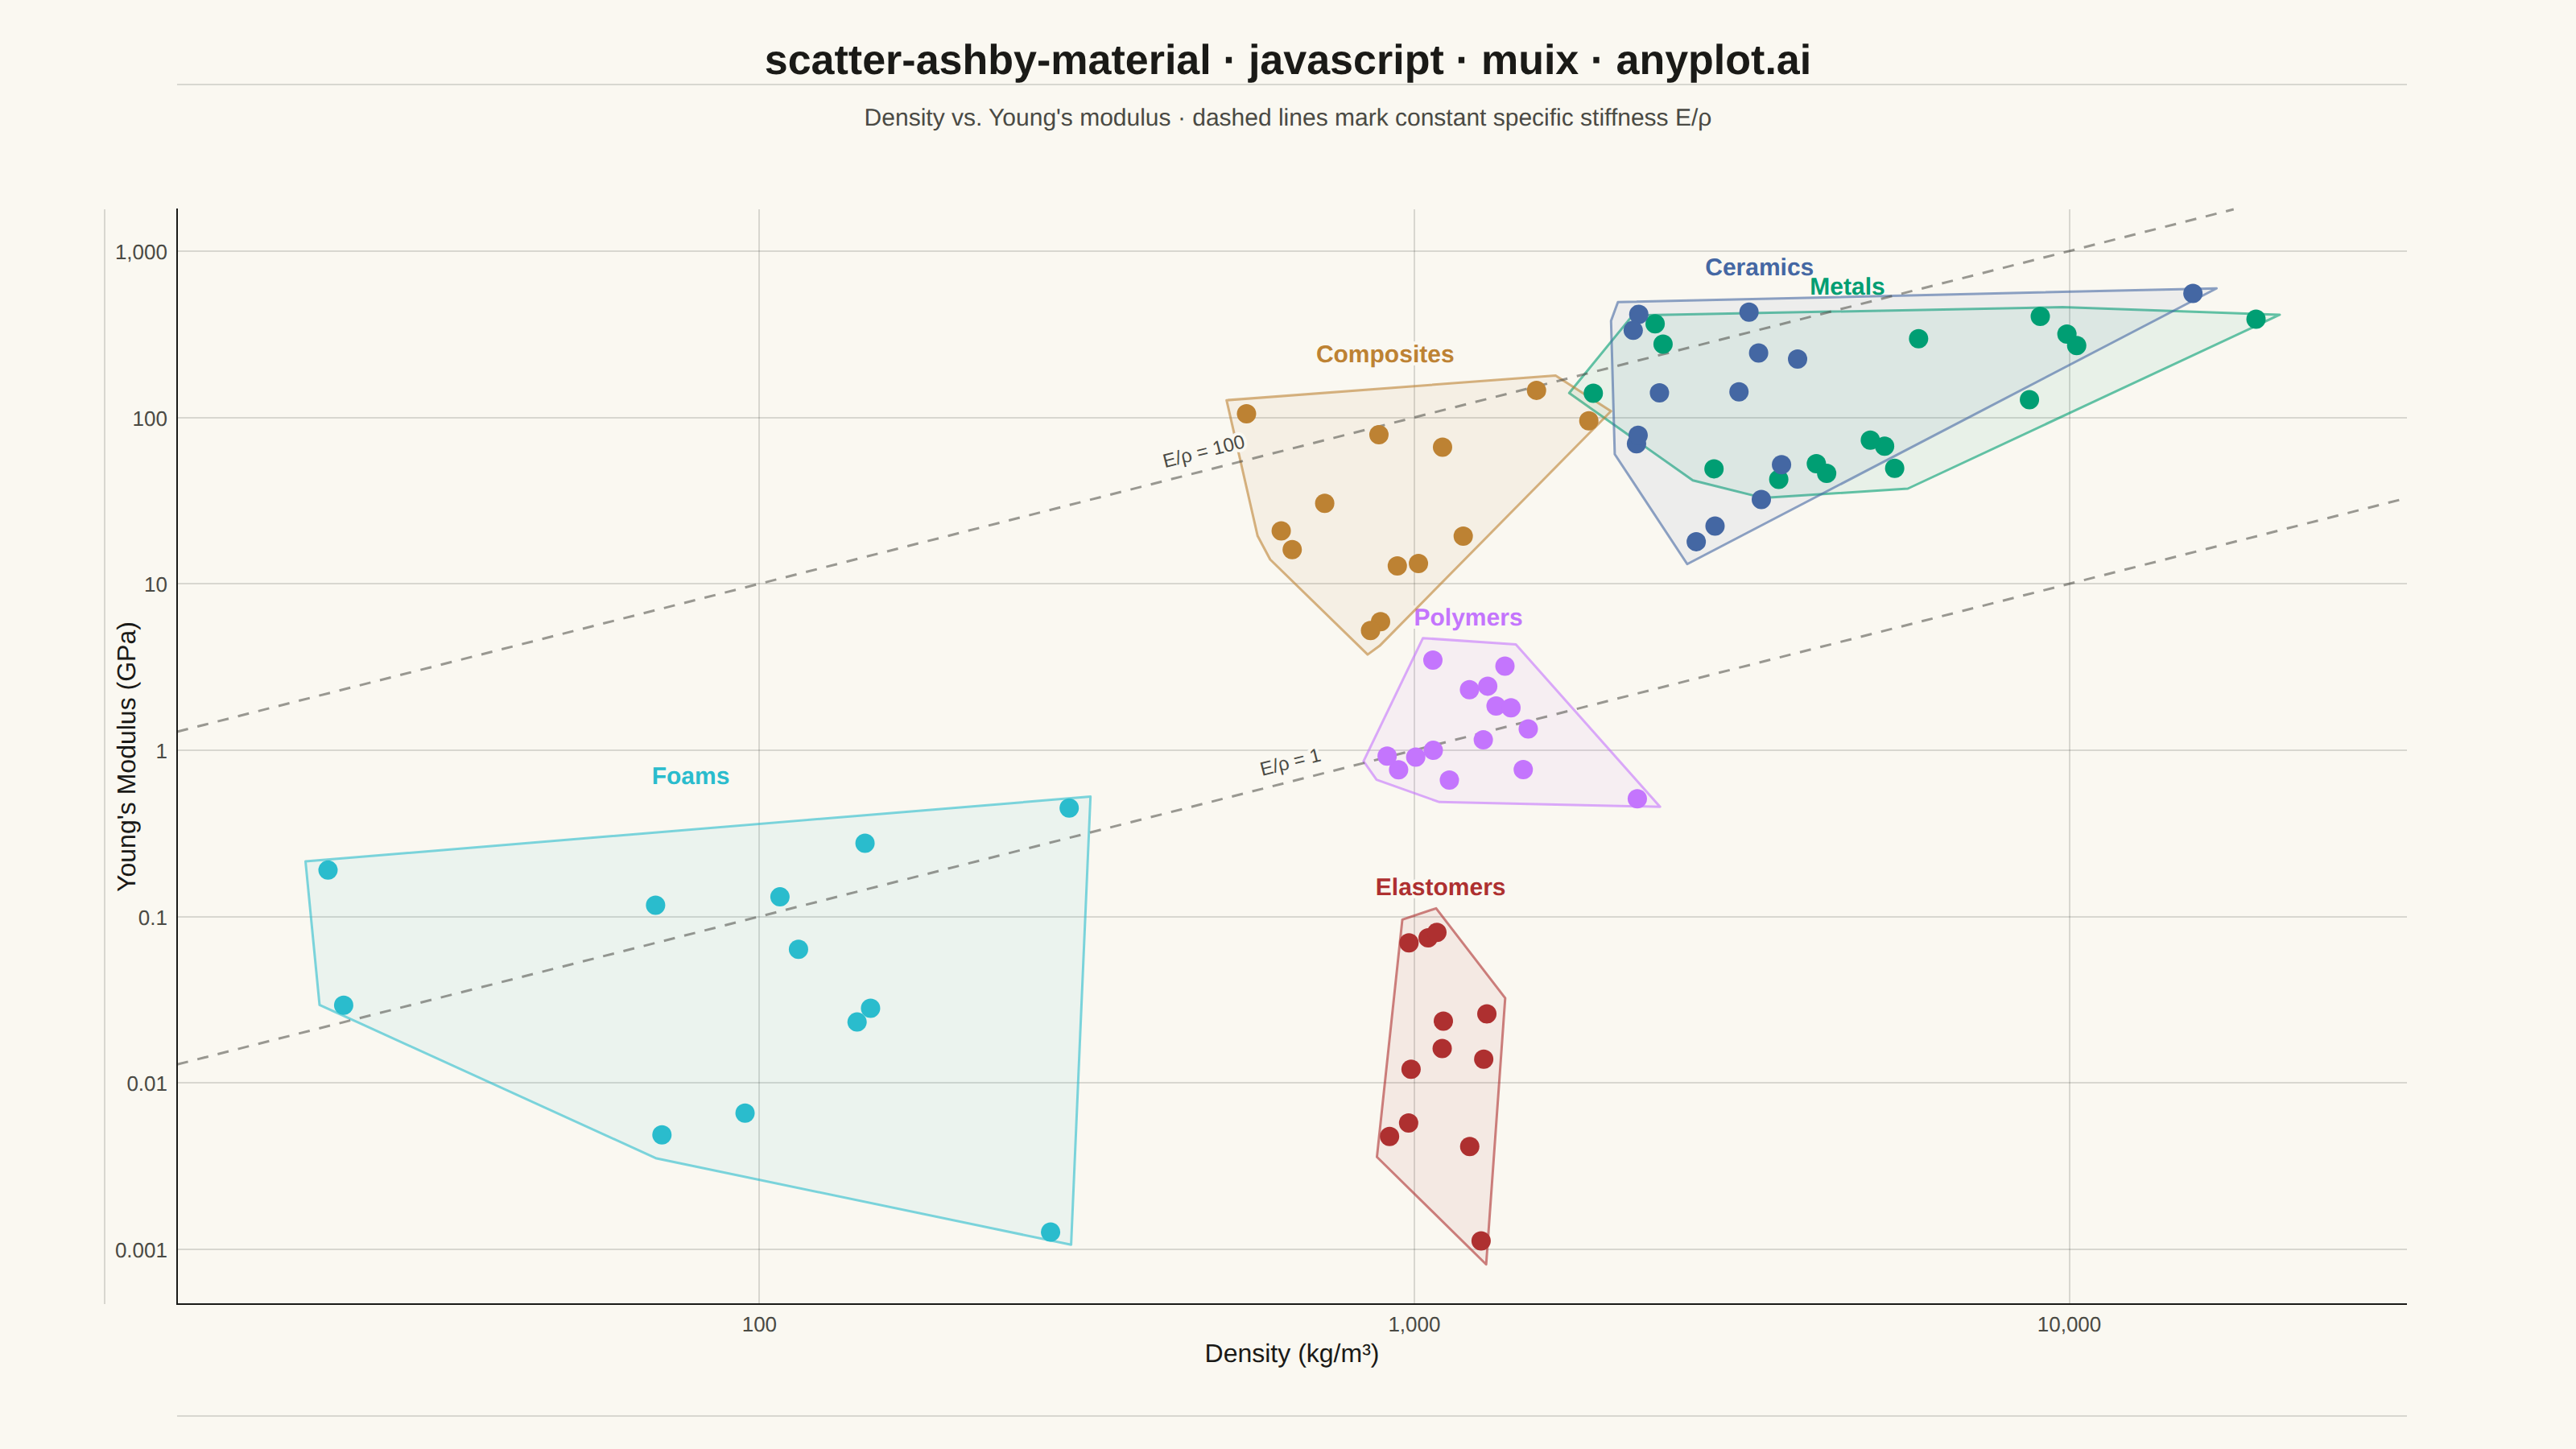
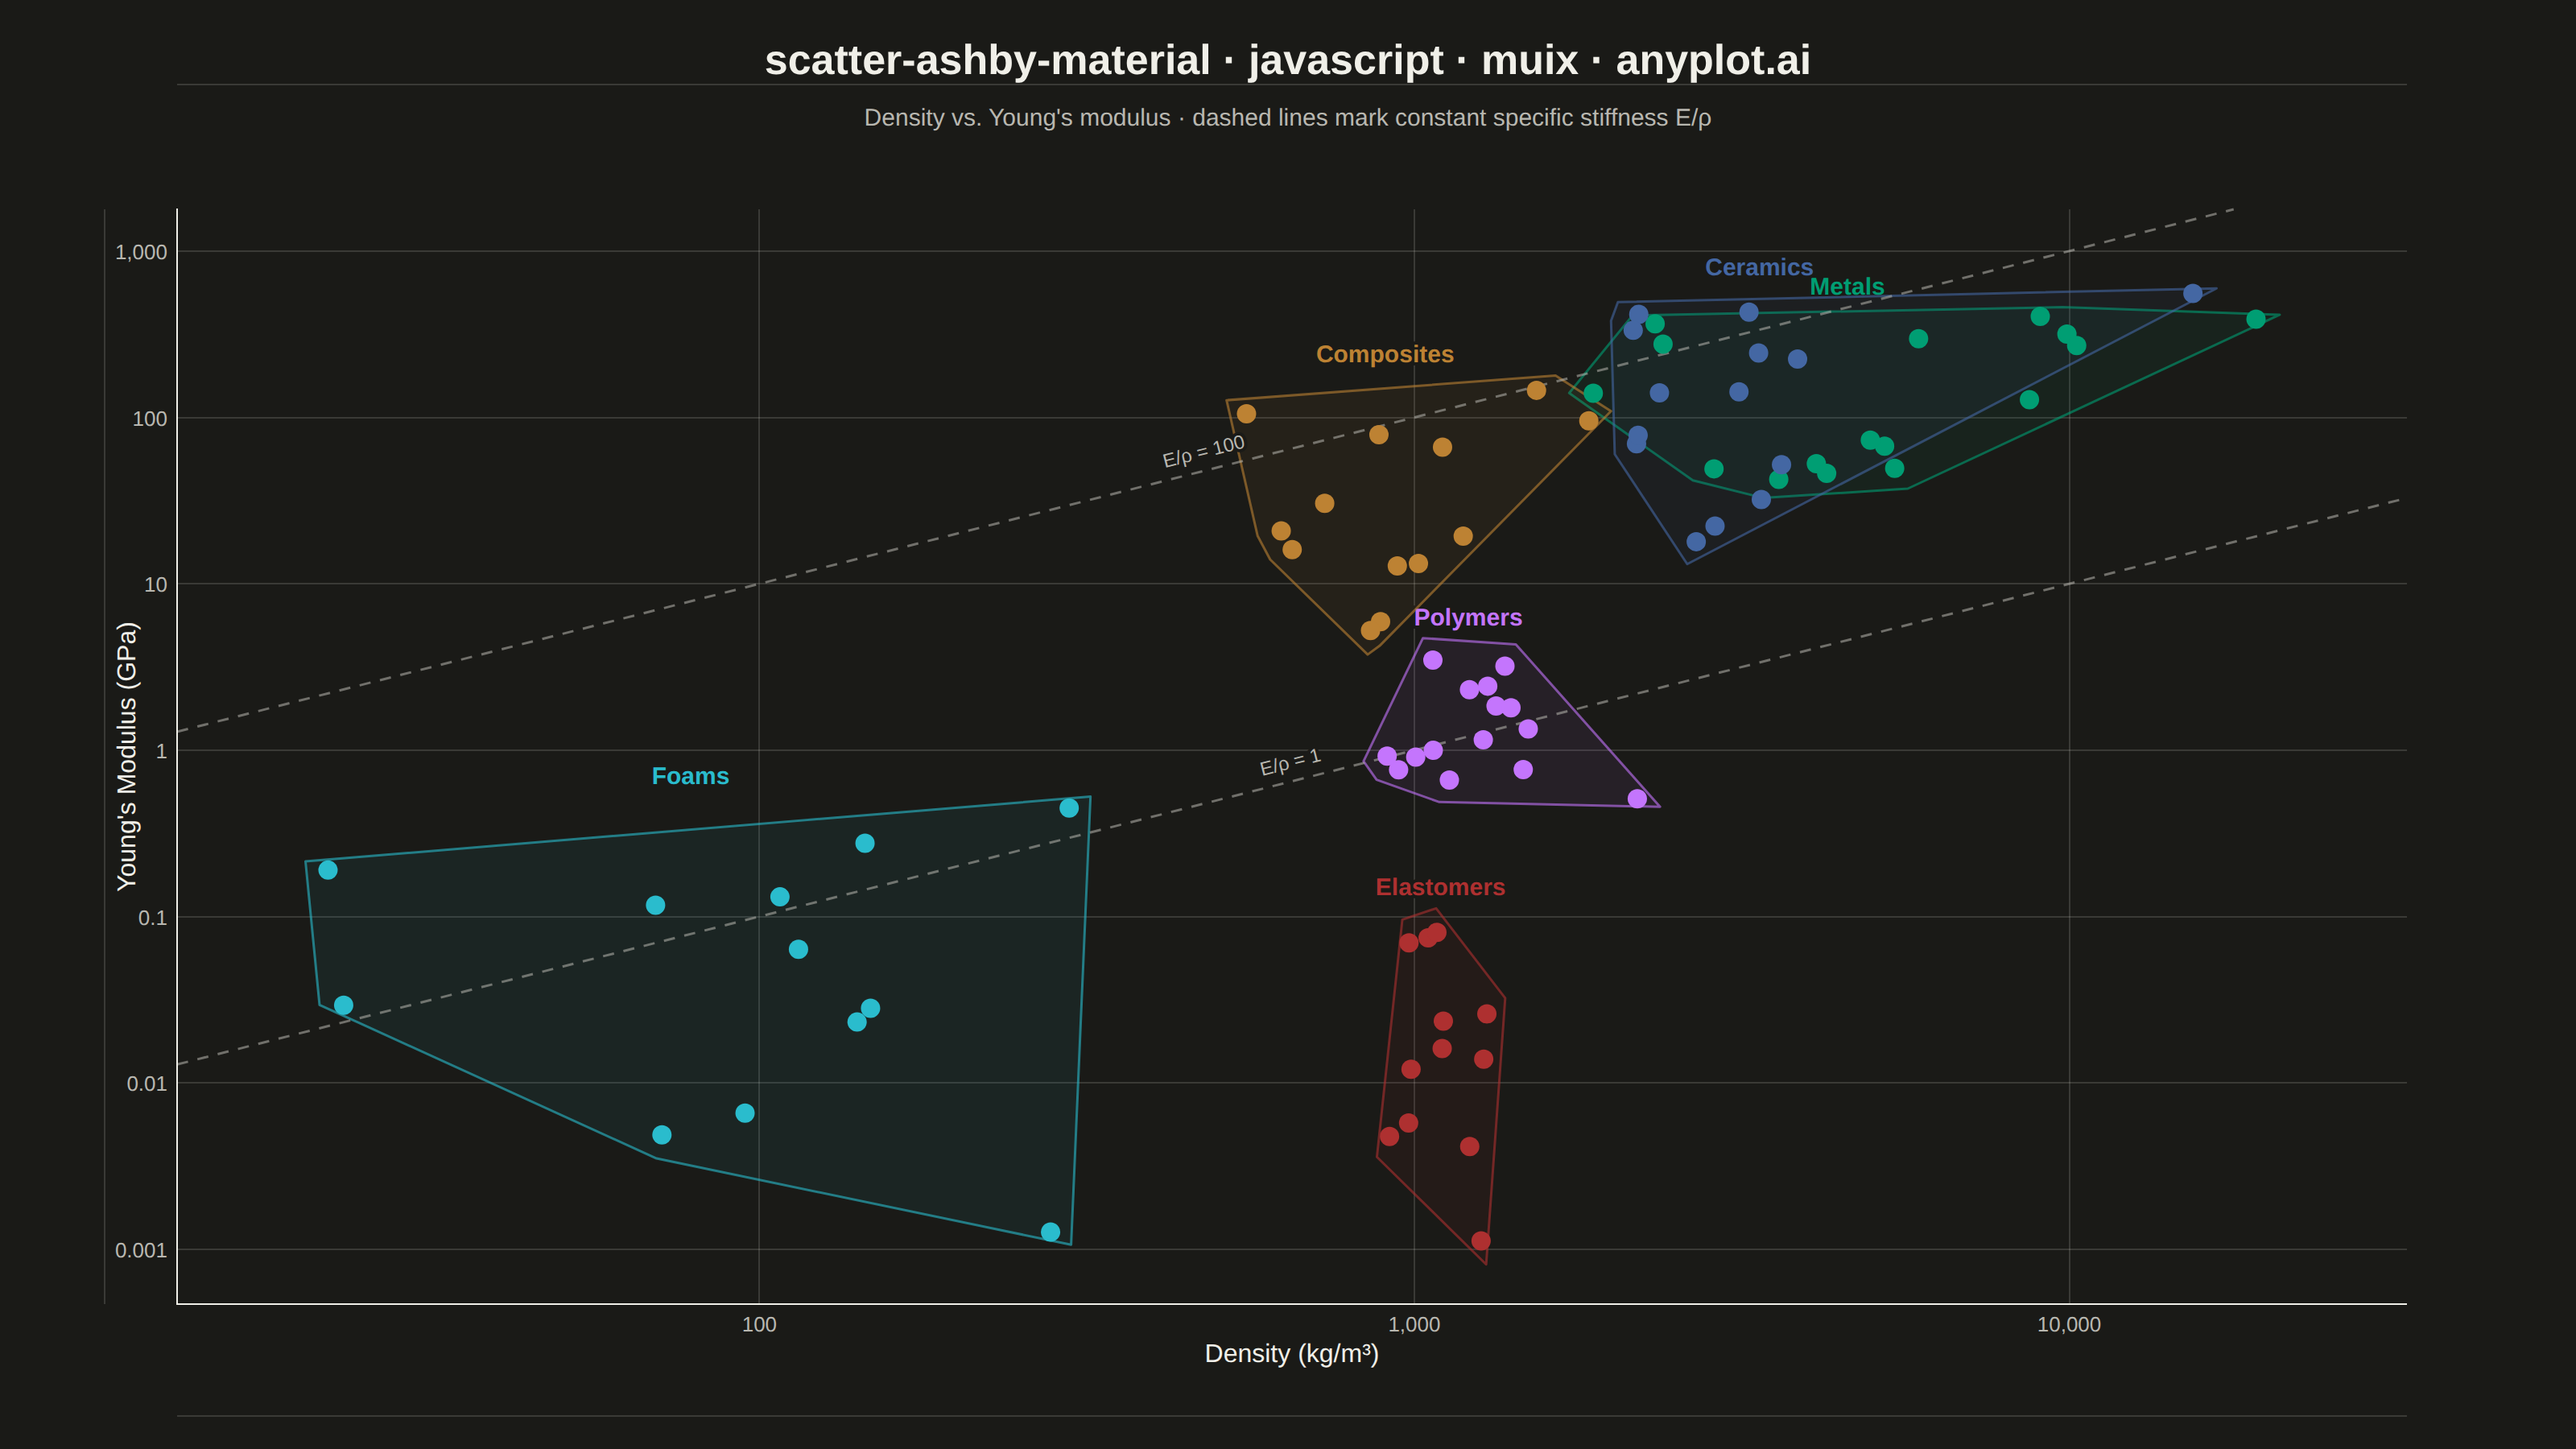
A log-log scatter plot comparing two material properties (e.g., Young's modulus vs. density) with material families displayed as labeled bubble regions. Developed by Michael Ashby for systematic material selection in engineering design, this chart enables rapid visual comparison of material classes across multiple property dimensions. It is a standard tool in materials science and mechanical engineering education.
// anyplot.ai
// scatter-ashby-material: Ashby Material Selection Chart
// Library: muix 7.29.1 | JavaScript 22.23.2
// Quality: 94/100 | Created: 2026-08-24
//# anyplot-orientation: landscape
// anyplot.ai
// scatter-ashby-material: Ashby Material Selection Chart
// Library: MUI X Charts | React | Node 22
// License: @mui/x-charts — MIT (community). Pro/Premium are out of scope.
// Quality: pending | Created: 2026-08-24

import { ChartContainer } from "@mui/x-charts/ChartContainer";
import { ScatterPlot } from "@mui/x-charts/ScatterChart";
import { ChartsXAxis } from "@mui/x-charts/ChartsXAxis";
import { ChartsYAxis } from "@mui/x-charts/ChartsYAxis";
import { ChartsGrid } from "@mui/x-charts/ChartsGrid";
import { ChartsTooltip } from "@mui/x-charts/ChartsTooltip";
import { useXScale, useYScale } from "@mui/x-charts/hooks";

const t = window.ANYPLOT_TOKENS;
const { width, height } = window.ANYPLOT_SIZE;

// Deterministic LCG (seed 42) — no Math.random() in the browser harness
let seed = 42;
function rng() {
  seed = (1664525 * seed + 1013904223) >>> 0;
  return seed / 4294967296;
}

// --- Data: classic density vs. Young's modulus Ashby chart -----------------
// Each family spans an archetypal (density, modulus) box; materials are
// sampled log-uniformly inside that box, which is how real material families
// cluster on a log-log Ashby chart — a compact, roughly rectangular smear
// rather than a tight point cloud.
const FAMILIES = [
  {
    name: "Metals",
    rho: [1800, 11400],
    e: [40, 410],
    materials: [
      "Mild Steel", "Stainless Steel", "Cast Iron", "Aluminum Alloys",
      "Titanium Alloys", "Copper Alloys", "Magnesium Alloys", "Nickel Superalloys",
      "Zinc Alloys", "Lead Alloys", "Tungsten", "Molybdenum",
      "Brass", "Bronze", "Chromium", "Tool Steel",
    ],
  },
  {
    name: "Polymers",
    rho: [900, 1500],
    e: [0.5, 4.5],
    materials: [
      "HDPE", "Polypropylene", "PVC", "Nylon 6,6",
      "Polycarbonate", "Acrylic (PMMA)", "ABS", "Polystyrene",
      "PTFE", "Epoxy Resin", "Polyester Resin", "Phenolic Resin",
      "Melamine", "Rigid Polyurethane", "PEEK",
    ],
  },
  {
    name: "Ceramics",
    rho: [2000, 4200],
    e: [10, 450],
    materials: [
      "Alumina", "Silicon Carbide", "Silicon Nitride", "Zirconia",
      "Boron Carbide", "Tungsten Carbide", "Magnesia", "Soda-Lime Glass",
      "Borosilicate Glass", "Concrete", "Fired Brick", "Natural Stone",
      "Fireclay", "Cement Paste",
    ],
  },
  {
    name: "Composites",
    rho: [500, 1900],
    e: [5, 200],
    materials: [
      "CFRP", "GFRP", "Kevlar Composite", "Boron Composite",
      "Carbon-Epoxy", "Glass-Epoxy", "Al-SiC MMC", "Cermet",
      "Plywood", "Wood (Along Grain)", "Wood (Across Grain)", "Bamboo",
      "Laminated Veneer",
    ],
  },
  {
    name: "Elastomers",
    rho: [900, 1300],
    e: [0.001, 0.1],
    materials: [
      "Natural Rubber", "Silicone Rubber", "Neoprene", "Butyl Rubber",
      "Nitrile Rubber", "EPDM", "Polyurethane Elastomer", "Latex Rubber",
      "Isoprene Rubber", "SBR", "Fluoroelastomer", "Polychloroprene",
    ],
  },
  {
    name: "Foams",
    rho: [20, 300],
    e: [0.001, 0.5],
    materials: [
      "Rigid Polyurethane Foam", "Polystyrene Foam", "Polyethylene Foam", "Cork",
      "Balsa Wood", "Aluminum Foam", "Flexible PU Foam", "Syntactic Foam",
      "Melamine Foam", "Foamed Glass", "Cellular Ceramic Foam", "Phenolic Foam",
    ],
  },
];

// A few named materials are common knowledge and would look wrong if sampled
// from their family's full range — dense refractory metals/ceramics and PTFE
// sit well outside the rest of their family, so they get a tight sub-range
// around their real published density/modulus instead.
const MATERIAL_OVERRIDES = {
  Tungsten: { rho: [18900, 19600], e: [385, 411] },
  "Tungsten Carbide": { rho: [15400, 15800], e: [530, 650] },
  PTFE: { rho: [2150, 2200], e: [0.4, 0.75] },
};

const familyPoints = FAMILIES.map((family) => ({
  ...family,
  points: family.materials.map((material) => {
    const range = MATERIAL_OVERRIDES[material] ?? { rho: family.rho, e: family.e };
    const logRho = Math.log10(range.rho[0]) + rng() * (Math.log10(range.rho[1]) - Math.log10(range.rho[0]));
    const logE = Math.log10(range.e[0]) + rng() * (Math.log10(range.e[1]) - Math.log10(range.e[0]));
    return { material, rho: 10 ** logRho, e: 10 ** logE };
  }),
}));

const allRho = familyPoints.flatMap((f) => f.points.map((p) => p.rho));
const allE = familyPoints.flatMap((f) => f.points.map((p) => p.e));
const X_MIN = Math.min(...allRho) / 1.7;
const X_MAX = Math.max(...allRho) * 1.7;
const Y_MIN = Math.min(...allE) / 2.4;
const Y_MAX = Math.max(...allE) * 3.2;

function formatAxisValue(v) {
  if (v >= 100) return Math.round(v).toLocaleString();
  if (v >= 1) return Number(v.toPrecision(2)).toString();
  return Number(v.toPrecision(1)).toString();
}

// d3's log-scale ticks include the 2..9 minor steps within every decade,
// which collide at this plot's span. `tickInterval` as a filter function is
// only honored for point scales, so force the tick set itself down to just
// the decade values (…, 0.1, 1, 10, 100, …) via an explicit array.
function decadeTicks(min, max) {
  const start = Math.floor(Math.log10(min));
  const end = Math.ceil(Math.log10(max));
  const ticks = [];
  for (let p = start; p <= end; p += 1) ticks.push(10 ** p);
  return ticks;
}

// Convex hull via the monotone-chain algorithm — the "convex-hull envelope"
// the spec calls out for showing each material family as a region.
function convexHull(points) {
  const sorted = [...points].sort((a, b) => a[0] - b[0] || a[1] - b[1]);
  const cross = (o, a, b) => (a[0] - o[0]) * (b[1] - o[1]) - (a[1] - o[1]) * (b[0] - o[0]);
  const lower = [];
  for (const p of sorted) {
    while (lower.length >= 2 && cross(lower[lower.length - 2], lower[lower.length - 1], p) <= 0) lower.pop();
    lower.push(p);
  }
  const upper = [];
  for (let i = sorted.length - 1; i >= 0; i -= 1) {
    const p = sorted[i];
    while (upper.length >= 2 && cross(upper[upper.length - 2], upper[upper.length - 1], p) <= 0) upper.pop();
    upper.push(p);
  }
  upper.pop();
  lower.pop();
  return lower.concat(upper);
}

const HULL_MARGIN = 15;

// Renders each family as an inflated convex-hull region behind the points,
// with a direct color-matched label — the standard Ashby-chart convention
// (no legend needed once every region carries its own name).
function FamilyRegions() {
  const xScale = useXScale();
  const yScale = useYScale();
  if (!xScale || !yScale) return null;

  return (
    <g>
      {familyPoints.map((family, i) => {
        const pixels = family.points.map((p) => [xScale(p.rho), yScale(p.e)]);
        const hull = convexHull(pixels);
        const cx = hull.reduce((s, p) => s + p[0], 0) / hull.length;
        const cy = hull.reduce((s, p) => s + p[1], 0) / hull.length;
        const inflated = hull.map(([x, y]) => {
          const dx = x - cx;
          const dy = y - cy;
          const len = Math.hypot(dx, dy) || 1;
          return [x + (dx / len) * HULL_MARGIN, y + (dy / len) * HULL_MARGIN];
        });
        const d = `M ${inflated.map((p) => p.join(",")).join(" L ")} Z`;
        const labelY = Math.min(...inflated.map((p) => p[1])) - 8;
        return (
          <g key={family.name}>
            <path
              d={d}
              fill={t.palette[i]}
              fillOpacity={0.07}
              stroke={t.palette[i]}
              strokeOpacity={0.6}
              strokeWidth={1.5}
              strokeLinejoin="round"
            />
            <text
              x={cx}
              y={labelY}
              textAnchor="middle"
              fontSize={15}
              fontWeight={600}
              fill={t.palette[i]}
              stroke={t.pageBg}
              strokeWidth={4}
              paintOrder="stroke"
            >
              {family.name}
            </text>
          </g>
        );
      })}
    </g>
  );
}

// Constant specific-stiffness (E / rho) guide lines — a classic Ashby-chart
// selection aid for lightweight-and-stiff design. Straight in log-log space,
// so a clip against the padded axis box needs only the two endpoints.
const GUIDE_INDICES = [1, 100];

function clipIsoline(index, xDomain, yDomain) {
  const k = index / 1000; // E (GPa) = k * rho (kg/m^3)
  let x0 = xDomain[0];
  let x1 = xDomain[1];
  let y0 = k * x0;
  let y1 = k * x1;
  if (y0 < yDomain[0]) { x0 = yDomain[0] / k; y0 = yDomain[0]; }
  if (y0 > yDomain[1]) { x0 = yDomain[1] / k; y0 = yDomain[1]; }
  if (y1 < yDomain[0]) { x1 = yDomain[0] / k; y1 = yDomain[0]; }
  if (y1 > yDomain[1]) { x1 = yDomain[1] / k; y1 = yDomain[1]; }
  if (x0 >= x1) return null;
  return { x0, y0, x1, y1 };
}

function PerformanceGuideLines() {
  const xScale = useXScale();
  const yScale = useYScale();
  if (!xScale || !yScale) return null;
  const xDomain = xScale.domain();
  const yDomain = yScale.domain();

  return (
    <g>
      {GUIDE_INDICES.map((index) => {
        const seg = clipIsoline(index, xDomain, yDomain);
        if (!seg) return null;
        const x0 = xScale(seg.x0);
        const y0 = yScale(seg.y0);
        const x1 = xScale(seg.x1);
        const y1 = yScale(seg.y1);
        const angle = (Math.atan2(y1 - y0, x1 - x0) * 180) / Math.PI;
        const midX = (x0 + x1) / 2;
        const midY = (y0 + y1) / 2;
        return (
          <g key={index}>
            <line x1={x0} y1={y0} x2={x1} y2={y1} stroke={t.inkSoft} strokeWidth={1.5} strokeDasharray="7 6" opacity={0.55} />
            <text
              x={midX}
              y={midY - 8}
              textAnchor="middle"
              transform={`rotate(${angle}, ${midX}, ${midY - 8})`}
              fontSize={12}
              fill={t.inkSoft}
              stroke={t.pageBg}
              strokeWidth={4}
              paintOrder="stroke"
            >
              {`E/ρ = ${index}`}
            </text>
          </g>
        );
      })}
    </g>
  );
}

const TITLE = "scatter-ashby-material · javascript · muix · anyplot.ai";
const SUBTITLE = "Density vs. Young's modulus · dashed lines mark constant specific stiffness E/ρ";

const MARGIN = { top: 130, right: 105, bottom: 90, left: 110 };

export default function Chart() {
  return (
    <ChartContainer
      width={width}
      height={height}
      margin={MARGIN}
      skipAnimation
      sx={{ "& .MuiChartsGrid-line": { stroke: t.grid, strokeWidth: 1 } }}
      series={familyPoints.map((family, i) => ({
        type: "scatter",
        id: family.name,
        label: family.name,
        color: t.palette[i],
        markerSize: 6,
        data: family.points.map((p, j) => ({ x: p.rho, y: p.e, id: `${family.name}-${j}` })),
      }))}
      xAxis={[
        {
          id: "density",
          scaleType: "log",
          min: X_MIN,
          max: X_MAX,
          disableTicks: true,
          tickInterval: decadeTicks(X_MIN, X_MAX),
          label: "Density (kg/m³)",
          labelStyle: { fontSize: 16, fill: t.ink },
          tickLabelStyle: { fontSize: 13, fill: t.inkSoft },
          valueFormatter: formatAxisValue,
        },
      ]}
      yAxis={[
        {
          id: "modulus",
          scaleType: "log",
          min: Y_MIN,
          max: Y_MAX,
          disableTicks: true,
          tickInterval: decadeTicks(Y_MIN, Y_MAX),
          label: "Young's Modulus (GPa)",
          labelStyle: { fontSize: 16, fill: t.ink },
          tickLabelStyle: { fontSize: 13, fill: t.inkSoft },
          valueFormatter: formatAxisValue,
        },
      ]}
    >
      <ChartsGrid vertical horizontal />
      <FamilyRegions />
      <PerformanceGuideLines />
      <ScatterPlot />
      <ChartsXAxis axisId="density" />
      <ChartsYAxis axisId="modulus" />
      <ChartsTooltip trigger="item" />
      <text x={width / 2} y={46} textAnchor="middle" fontSize={26} fontWeight={600} fill={t.ink}>
        {TITLE}
      </text>
      <text x={width / 2} y={78} textAnchor="middle" fontSize={15} fill={t.inkSoft}>
        {SUBTITLE}
      </text>
    </ChartContainer>
  );
}
Runnable source as JSON, for any HTTP client: https://api.anyplot.ai/specs/scatter-ashby-material/muix/code. Any spec id and library id listed in llms-full.txt fit the same URL shape; every URL below is complete and callable.
{
  "spec_id": "scatter-ashby-material",
  "language": "javascript",
  "library": "muix",
  "page": "https://anyplot.ai/scatter-ashby-material/javascript/muix",
  "hub": "https://anyplot.ai/scatter-ashby-material",
  "code_json": "https://api.anyplot.ai/specs/scatter-ashby-material/muix/code",
  "spec_json": "https://api.anyplot.ai/specs/scatter-ashby-material",
  "render_light_png": "https://storage.googleapis.com/anyplot-images/plots/scatter-ashby-material/javascript/muix/plot-light.png",
  "render_dark_png": "https://storage.googleapis.com/anyplot-images/plots/scatter-ashby-material/javascript/muix/plot-dark.png",
  "interactive_light_html": "https://storage.googleapis.com/anyplot-images/plots/scatter-ashby-material/javascript/muix/plot-light.html",
  "interactive_dark_html": "https://storage.googleapis.com/anyplot-images/plots/scatter-ashby-material/javascript/muix/plot-dark.html",
  "quality_score": 94.0,
  "license": "MIT",
  "guide": "https://anyplot.ai/llms.txt"
}
Part of Ashby Material Selection Chart on anyplot.ai.