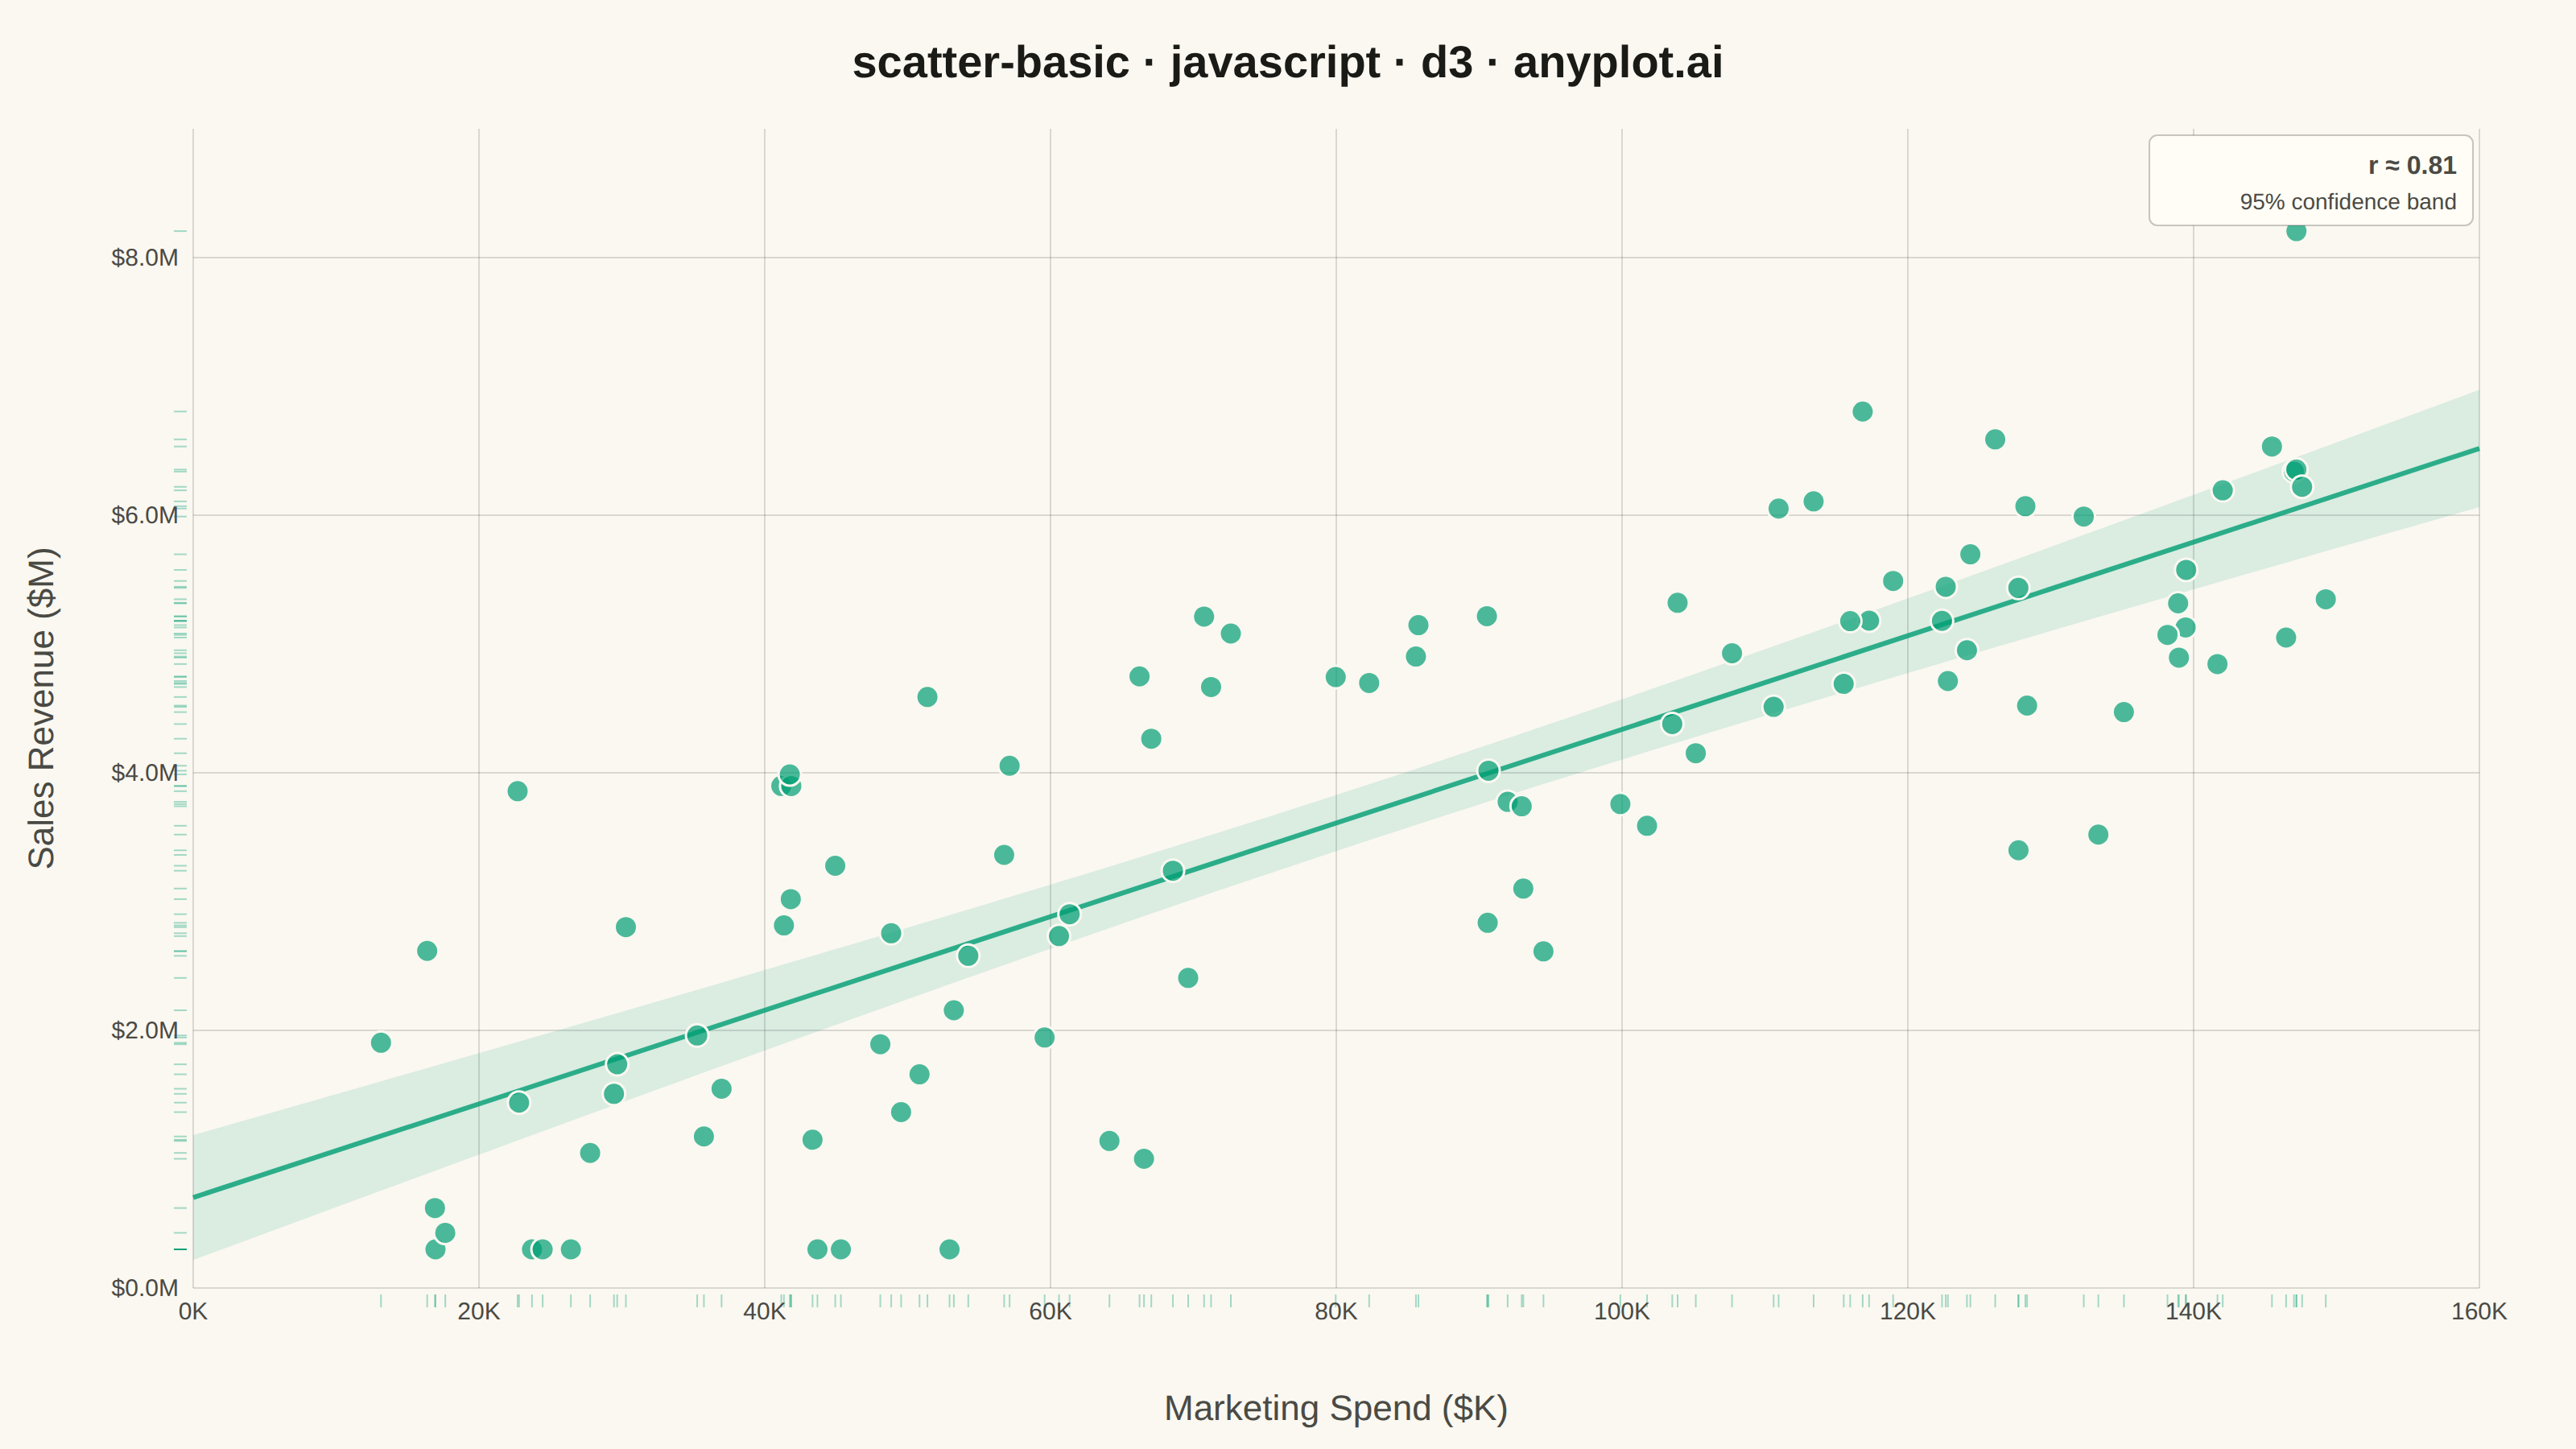
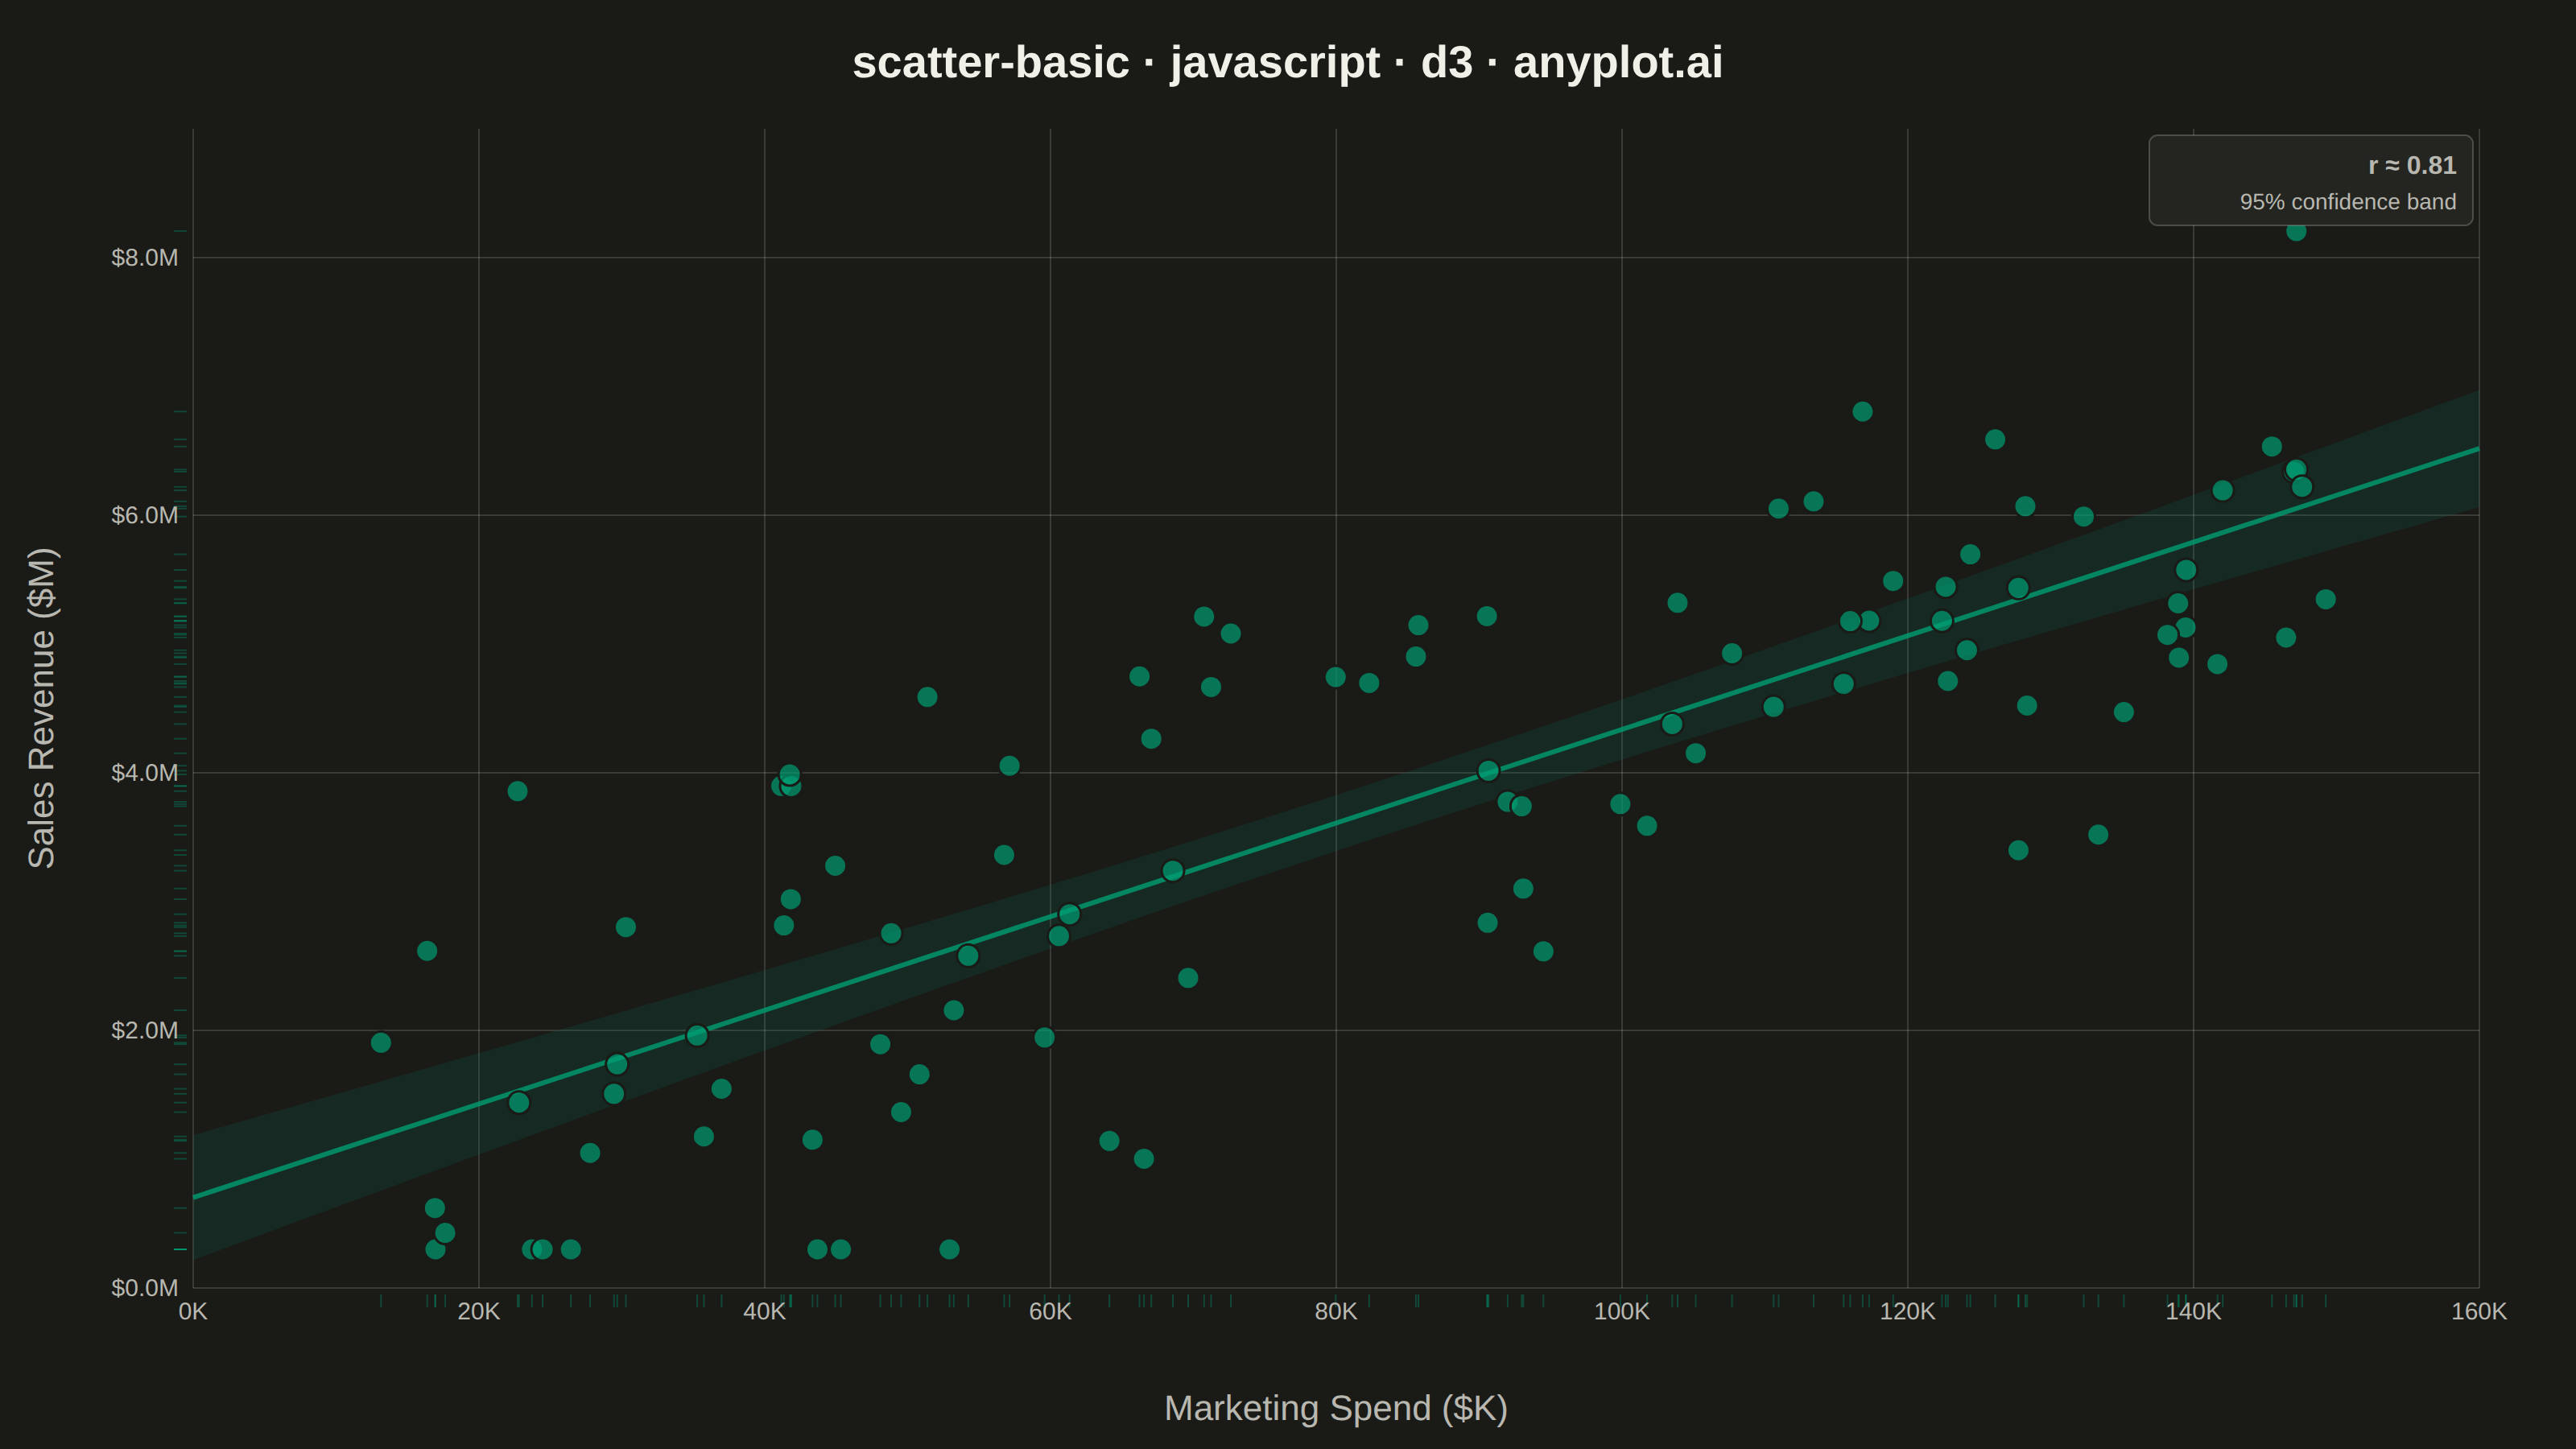
A fundamental 2D scatter plot that displays the relationship between two numeric variables by plotting points on a Cartesian coordinate system. This visualization is essential for exploring correlations, identifying patterns, detecting outliers, and understanding the distribution of paired data points.
Preview render from the D3.js implementation.