The same plot in 14 other libraries — JavaScript: D3.js, Apache ECharts, Highcharts, MUI X Charts; Python: Altair, Bokeh, lets-plot, Matplotlib, Plotly, plotnine, Pygal, Seaborn; R: ggplot2; Julia: Makie.jl. Compare all 15 side by side: Basic Scatter Plot in Python, R, Julia and JavaScript.
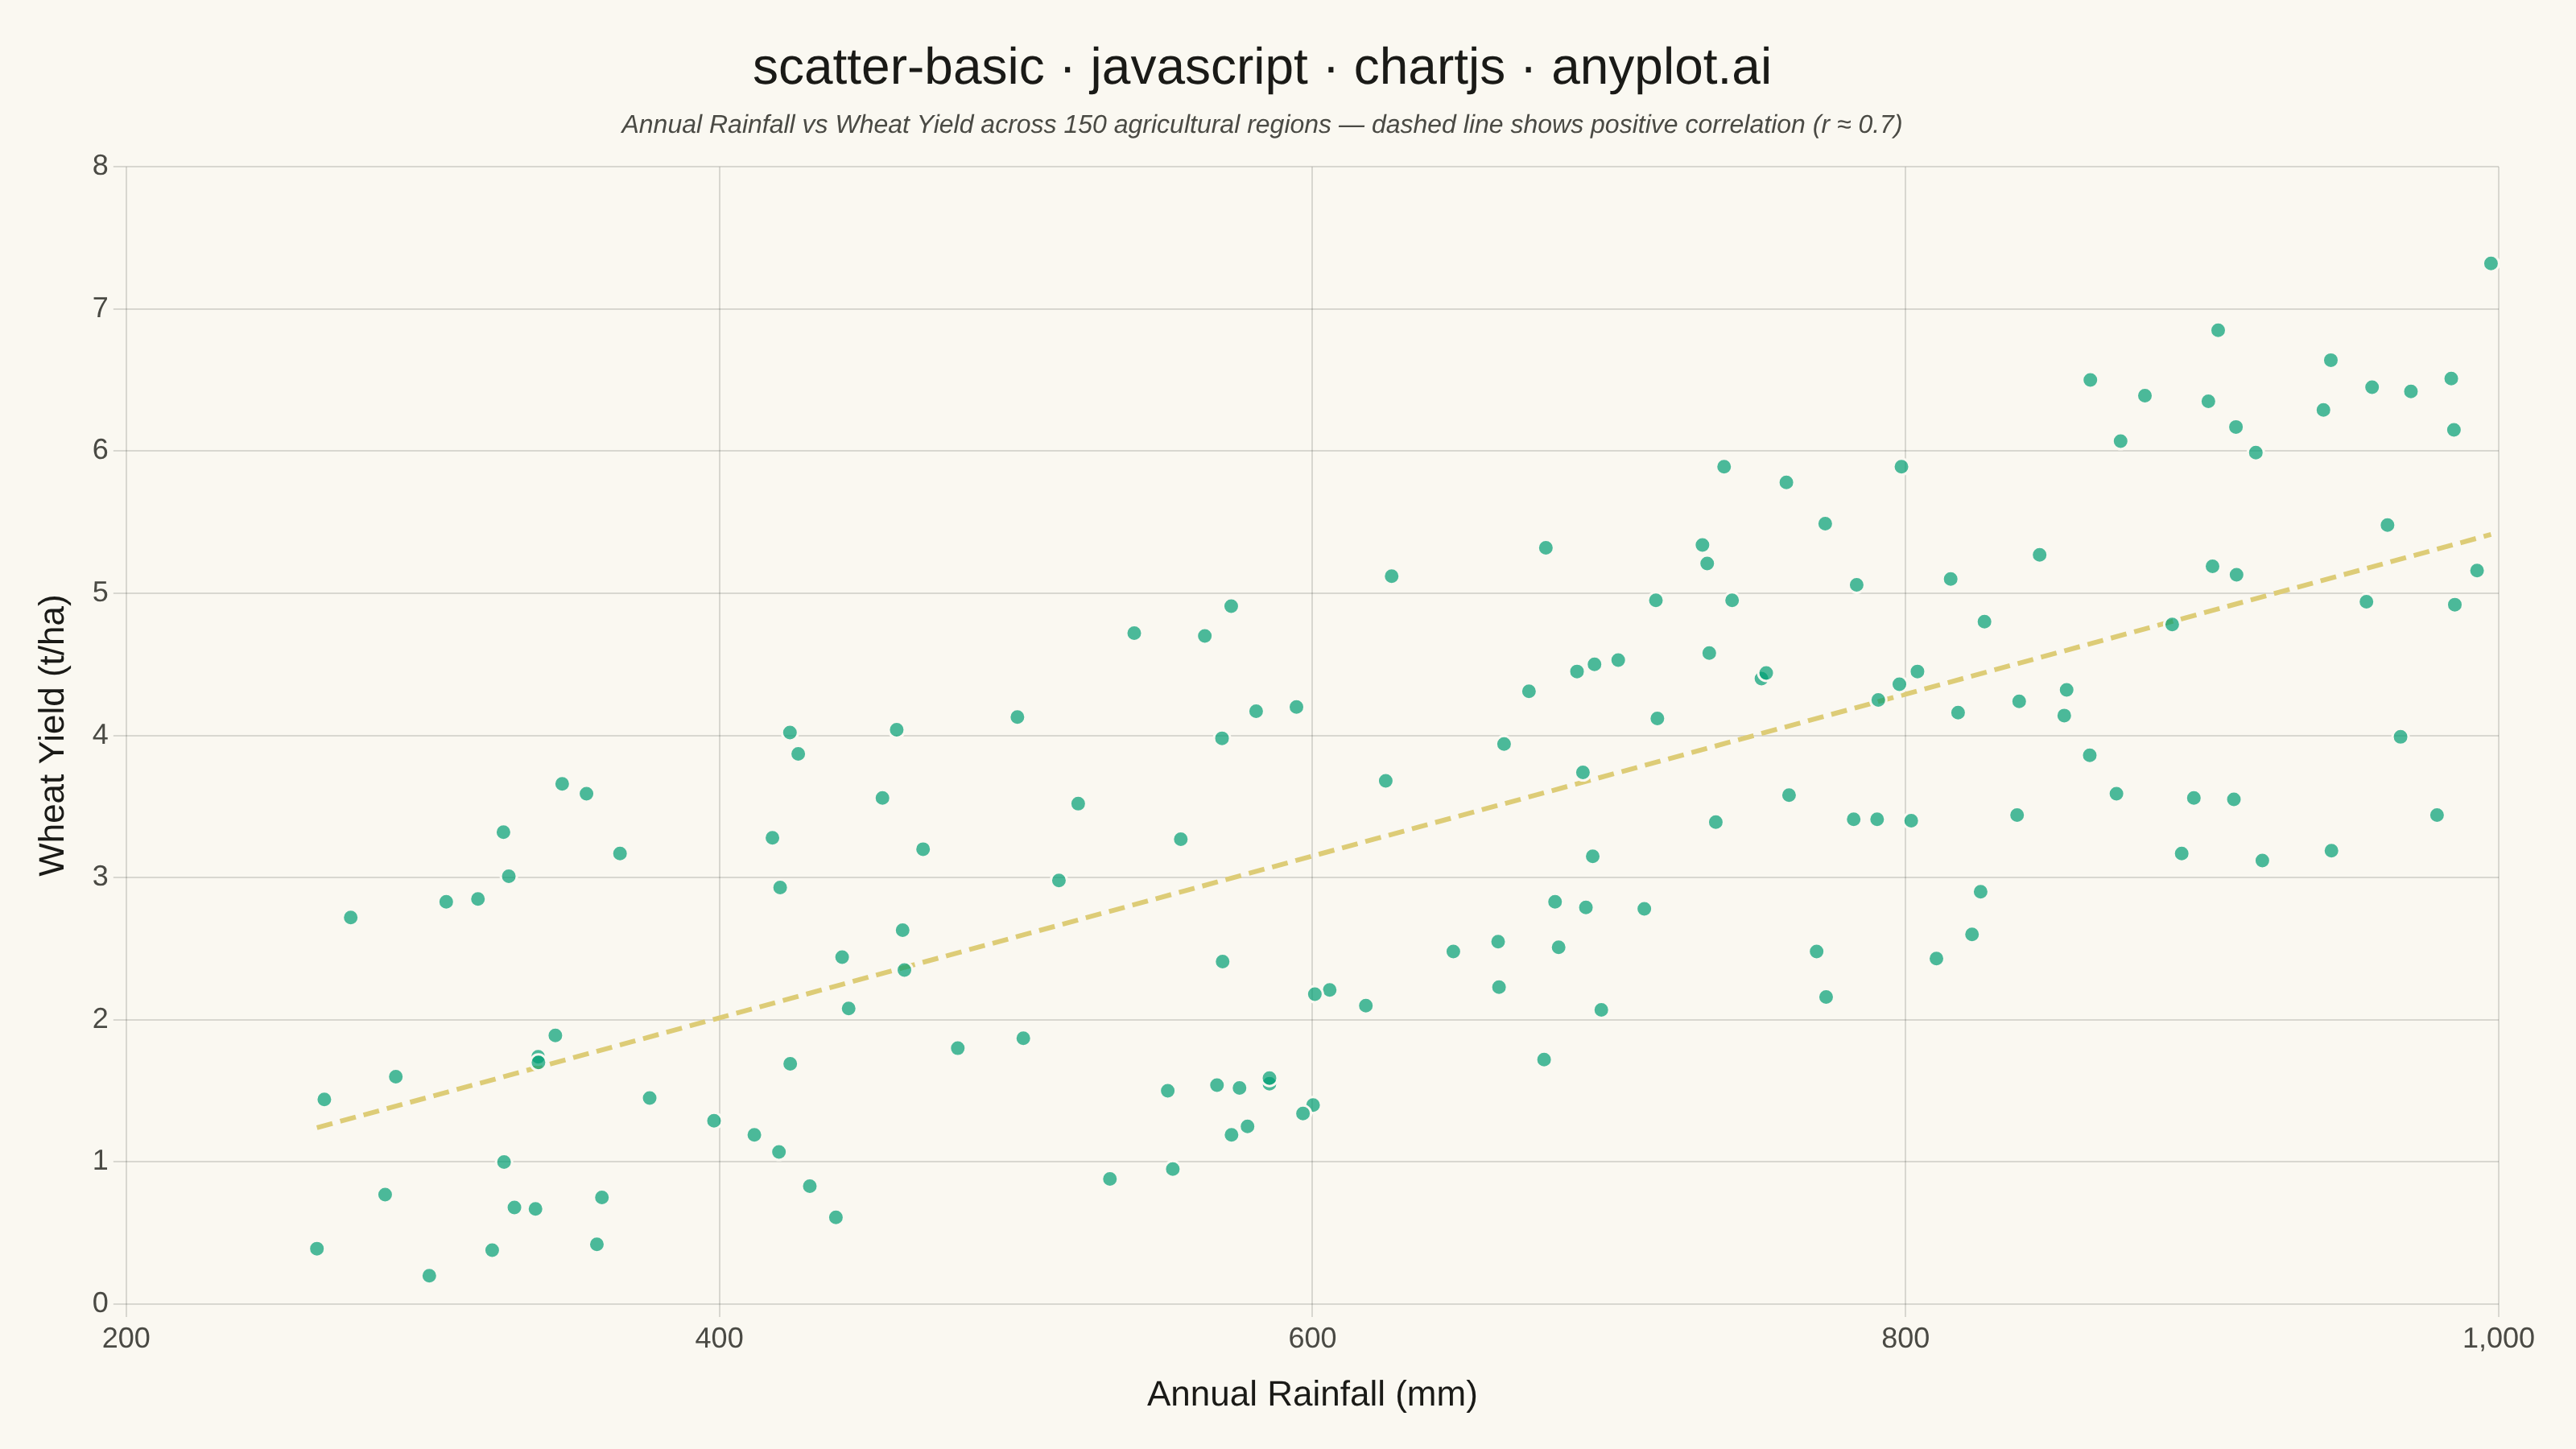
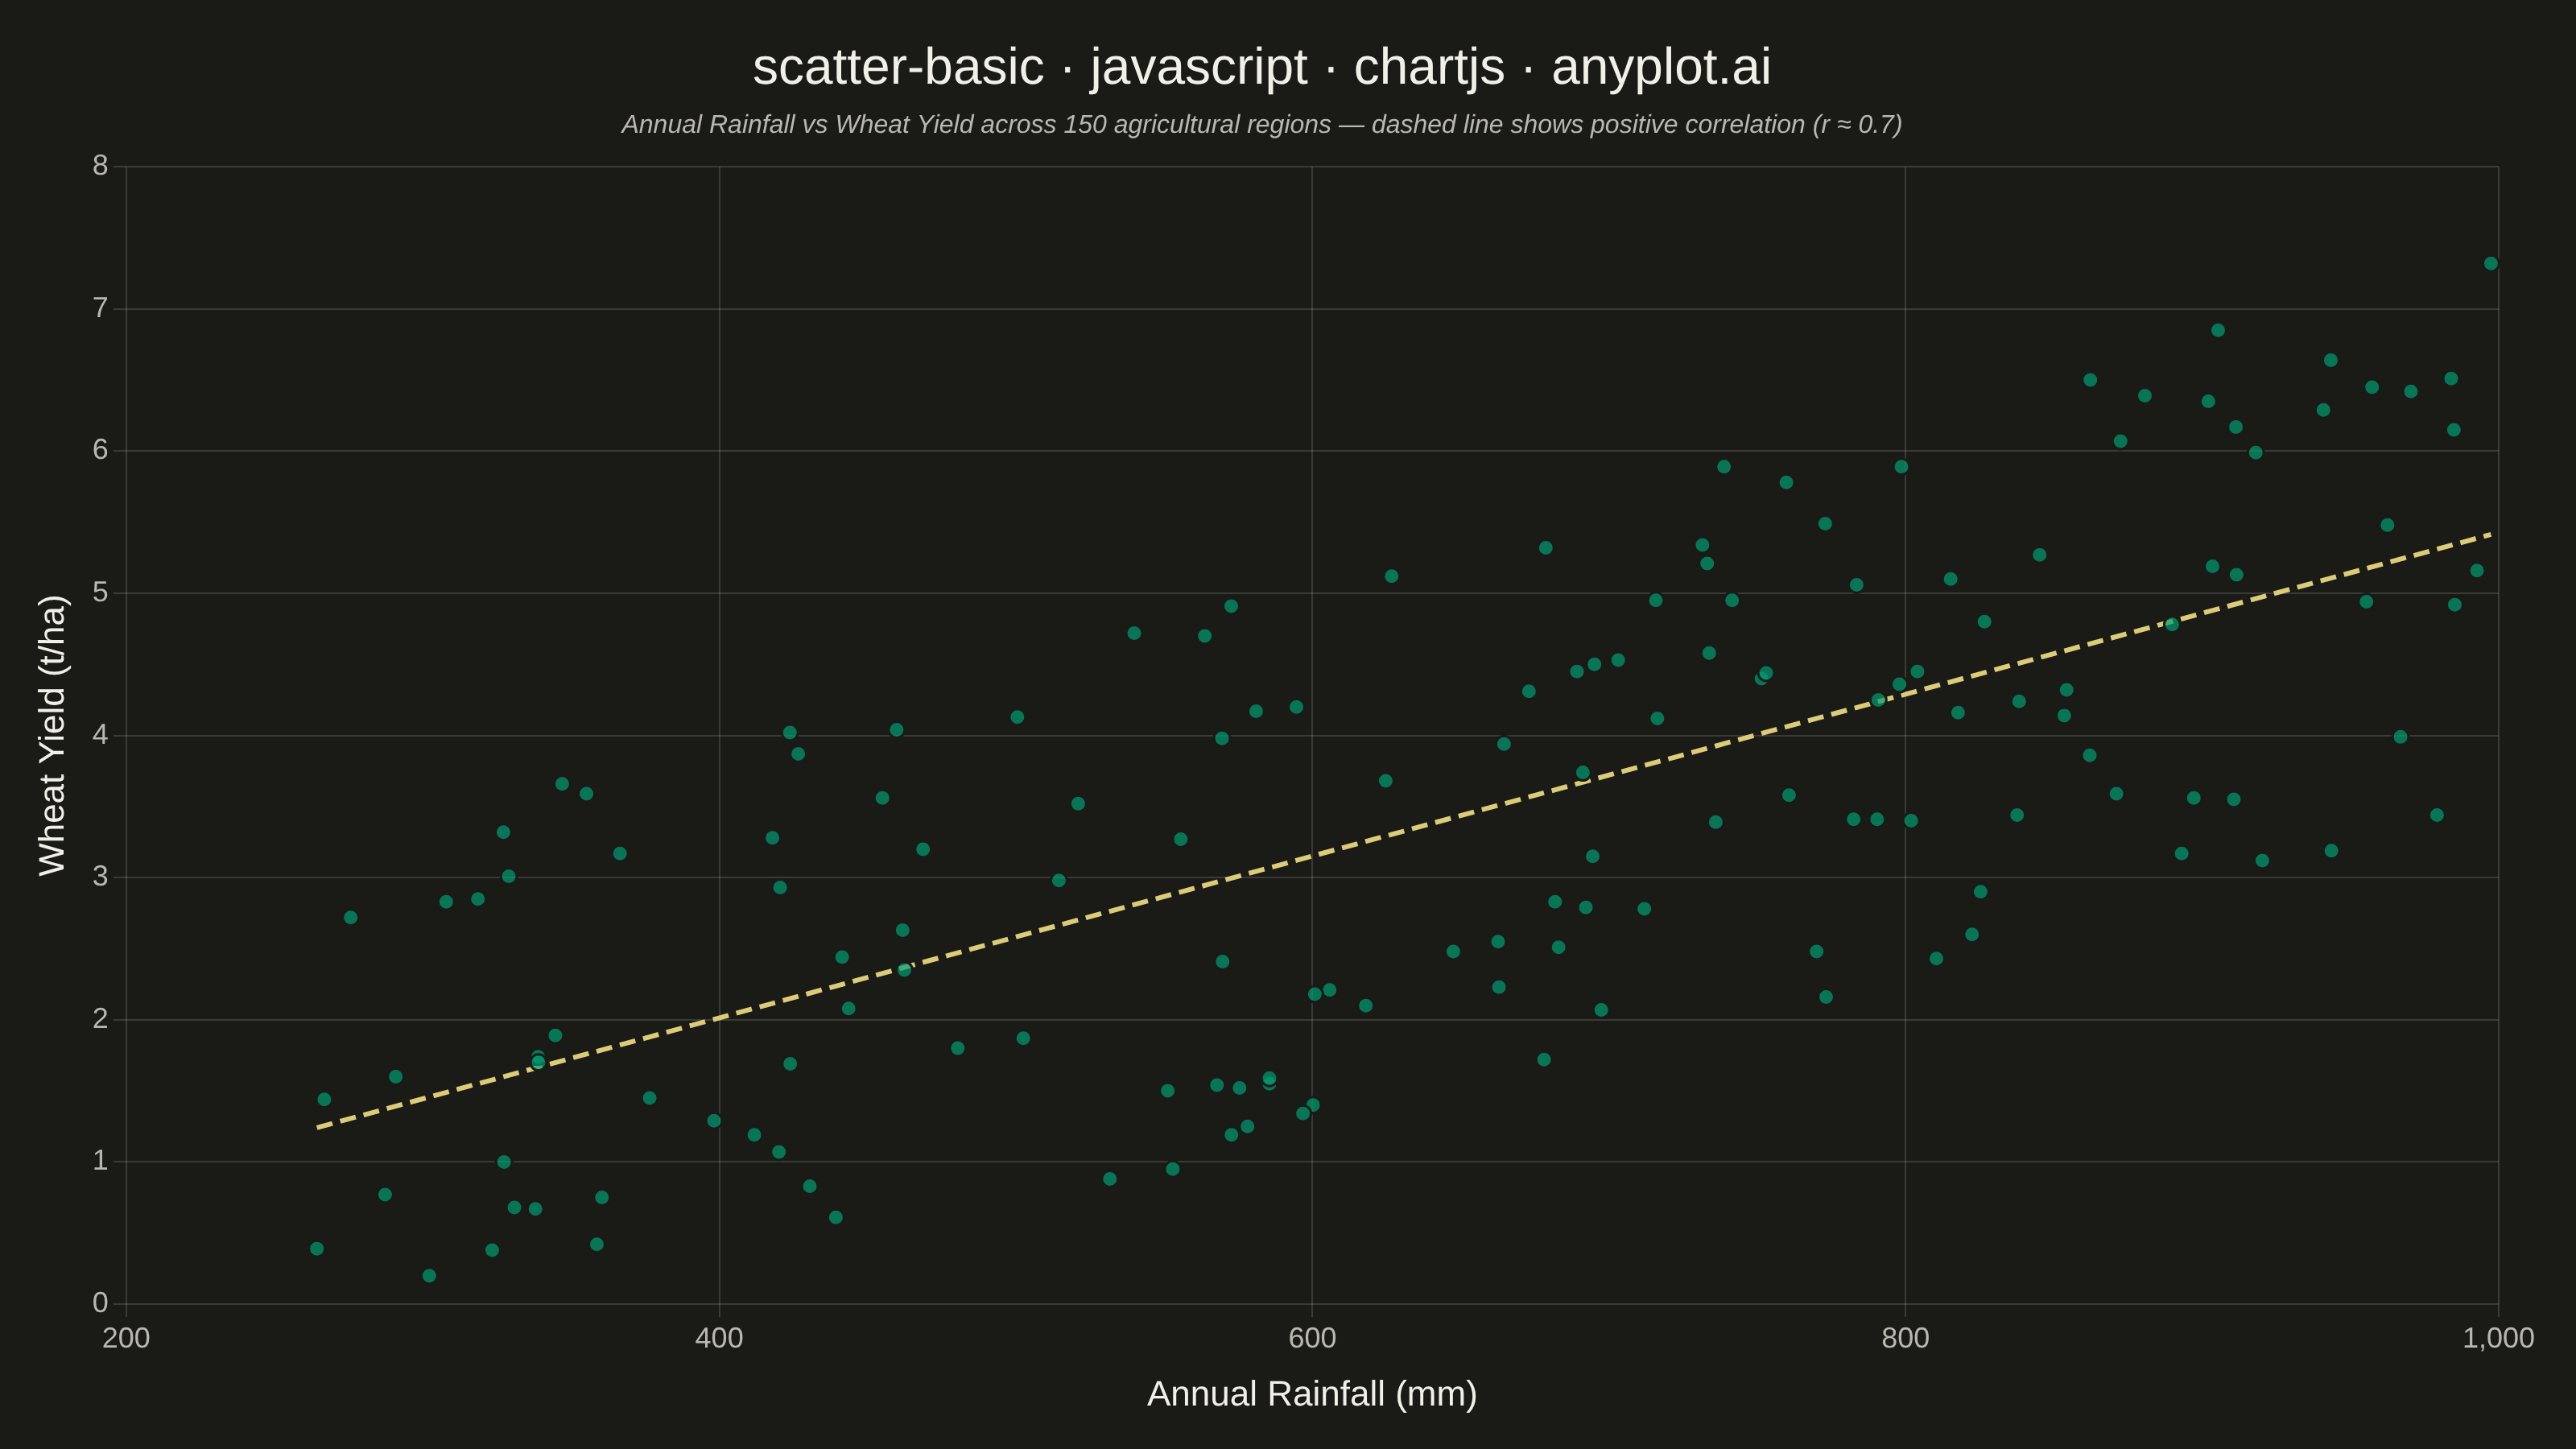
A fundamental 2D scatter plot that displays the relationship between two numeric variables by plotting points on a Cartesian coordinate system. This visualization is essential for exploring correlations, identifying patterns, detecting outliers, and understanding the distribution of paired data points.
// anyplot.ai
// scatter-basic: Basic Scatter Plot
// Library: chartjs 4.4.7 | JavaScript 22.23.0
// Quality: 91/100 | Updated: 2026-06-25

const t = window.ANYPLOT_TOKENS;

// Deterministic LCG for reproducible scatter data (seed = 42)
let seed = 42;
const rand = () => { seed = (seed * 1664525 + 1013904223) >>> 0; return seed / 0x100000000; };

// Data: Annual rainfall (mm) vs wheat yield (t/ha) across 150 agricultural regions
// Positive correlation r ≈ 0.7 with realistic noise
const n = 150;
const points = Array.from({ length: n }, () => {
  const rainfall = 250 + rand() * 750;
  const baseline = 1.2 + ((rainfall - 250) / 750) * 4.2;
  const yield_val = baseline + (rand() - 0.5) * 4.0;
  return { x: +rainfall.toFixed(1), y: +Math.max(0.2, yield_val).toFixed(2) };
});

// OLS linear regression to surface the r≈0.7 correlation
const meanX = points.reduce((s, p) => s + p.x, 0) / n;
const meanY = points.reduce((s, p) => s + p.y, 0) / n;
const slope = points.reduce((s, p) => s + (p.x - meanX) * (p.y - meanY), 0) /
              points.reduce((s, p) => s + (p.x - meanX) ** 2, 0);
const intercept = meanY - slope * meanX;
const minX = Math.min(...points.map(p => p.x));
const maxX = Math.max(...points.map(p => p.x));
const trendLine = [
  { x: minX, y: +(slope * minX + intercept).toFixed(3) },
  { x: maxX, y: +(slope * maxX + intercept).toFixed(3) },
];

// Canvas background plugin — fills with pageBg so dark theme renders correctly
const bgPlugin = {
  id: "canvasBg",
  beforeDraw(chart) {
    const { ctx, width, height } = chart;
    ctx.save();
    ctx.fillStyle = t.pageBg;
    ctx.fillRect(0, 0, width, height);
    ctx.restore();
  },
};

// Mount canvas into the harness container
const canvas = document.createElement("canvas");
document.getElementById("container").appendChild(canvas);

// Chart — mixed scatter + trend line
new Chart(canvas, {
  type: "scatter",
  plugins: [bgPlugin],
  data: {
    datasets: [
      {
        label: "Agricultural Region",
        data: points,
        backgroundColor: t.palette[0] + "b3",  // Imprint brand green at 70% opacity
        borderColor: t.pageBg,
        borderWidth: 1.5,
        pointRadius: 5,
      },
      {
        type: "line",
        label: "Linear Trend (r ≈ 0.7)",
        data: trendLine,
        borderColor: t.amber,
        borderWidth: 3,
        borderDash: [10, 5],
        pointRadius: 0,
        fill: false,
        tension: 0,
      },
    ],
  },
  options: {
    responsive: true,
    maintainAspectRatio: false,
    animation: false,
    layout: { padding: { top: 16, right: 48, bottom: 16, left: 16 } },
    plugins: {
      title: {
        display: true,
        text: "scatter-basic · javascript · chartjs · anyplot.ai",
        color: t.ink,
        font: { size: 32, weight: "normal" },
        padding: { top: 8, bottom: 6 },
      },
      subtitle: {
        display: true,
        text: "Annual Rainfall vs Wheat Yield across 150 agricultural regions — dashed line shows positive correlation (r ≈ 0.7)",
        color: t.inkSoft,
        font: { size: 16, style: "italic" },
        padding: { bottom: 16 },
      },
      legend: { display: false },
    },
    scales: {
      x: {
        ticks: { color: t.inkSoft, font: { size: 18 }, maxTicksLimit: 8 },
        grid: { color: t.grid },
        border: { display: false },
        title: {
          display: true,
          text: "Annual Rainfall (mm)",
          color: t.ink,
          font: { size: 22 },
          padding: { top: 8 },
        },
      },
      y: {
        ticks: { color: t.inkSoft, font: { size: 18 } },
        grid: { color: t.grid },
        border: { display: false },
        title: {
          display: true,
          text: "Wheat Yield (t/ha)",
          color: t.ink,
          font: { size: 22 },
          padding: { bottom: 8 },
        },
      },
    },
  },
});
Runnable source as JSON, for any HTTP client: https://api.anyplot.ai/specs/scatter-basic/chartjs/code. Any spec id and library id listed in llms-full.txt fit the same URL shape; every URL below is complete and callable.
{
  "spec_id": "scatter-basic",
  "language": "javascript",
  "library": "chartjs",
  "page": "https://anyplot.ai/scatter-basic/javascript/chartjs",
  "hub": "https://anyplot.ai/scatter-basic",
  "code_json": "https://api.anyplot.ai/specs/scatter-basic/chartjs/code",
  "spec_json": "https://api.anyplot.ai/specs/scatter-basic",
  "render_light_png": "https://storage.googleapis.com/anyplot-images/plots/scatter-basic/javascript/chartjs/plot-light.png",
  "render_dark_png": "https://storage.googleapis.com/anyplot-images/plots/scatter-basic/javascript/chartjs/plot-dark.png",
  "interactive_light_html": "https://storage.googleapis.com/anyplot-images/plots/scatter-basic/javascript/chartjs/plot-light.html",
  "interactive_dark_html": "https://storage.googleapis.com/anyplot-images/plots/scatter-basic/javascript/chartjs/plot-dark.html",
  "quality_score": 91.0,
  "license": "MIT",
  "guide": "https://anyplot.ai/llms.txt"
}
Part of Basic Scatter Plot on anyplot.ai.